Estimated zip code population in 2022: 39,628 Zip code population in 2010: 37,105 Zip code population in 2000: 33,991
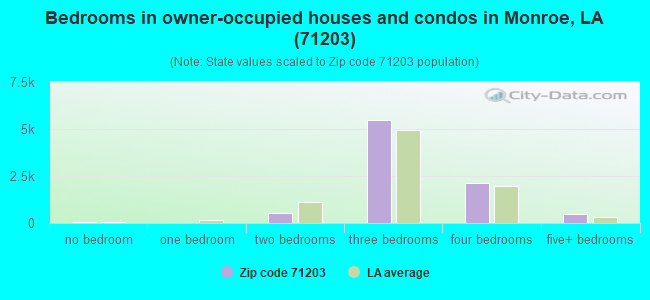
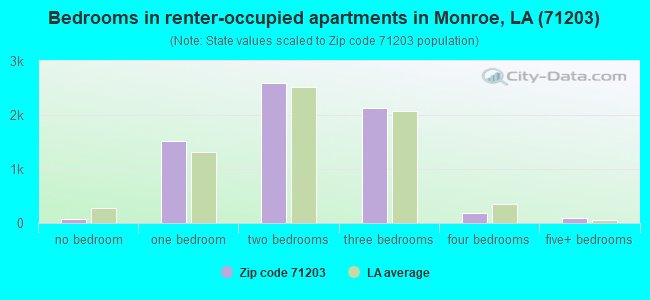
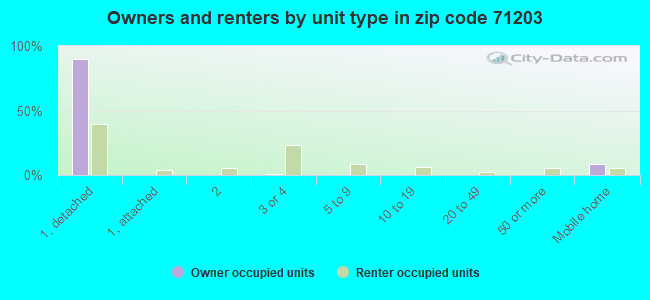
Houses and condos: 17,448 Renter-occupied apartments: 6,618
% of renters here:
43%
State:
32%
March 2022 cost of living index in zip code 71203: 85.2 (less than average, U.S. average is 100)
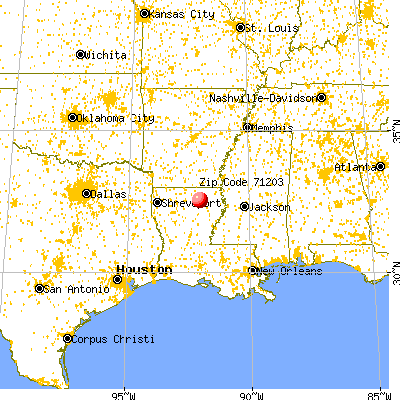
Land area: 118.8 sq. mi. Water area: 6.6 sq. mi.
Population density: 333 people per square mile
(very low).
OSM Map
General Map
Google Map
MSN Map
OSM Map
General Map
Google Map
MSN Map
OSM Map
General Map
Google Map
MSN Map
OSM Map
General Map
Google Map
MSN Map
Please wait while loading the map...
Real estate property taxes paid for housing units in 2022:
This zip code:
0.6% ($1,089)
Louisiana:
0.5% ($1,127)
Median real estate property taxes paid for housing units with mortgages in 2022: $1,298 (0.7%) Median real estate property taxes paid for housing units with no mortgage in 2022: $720 (0.4%)
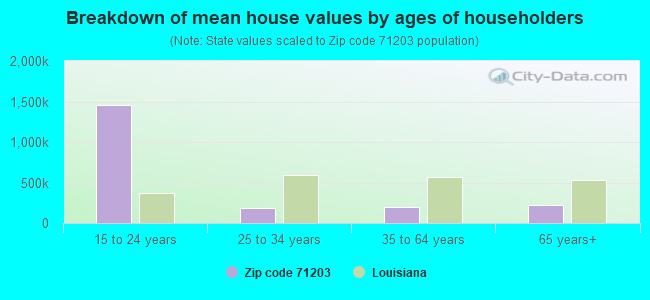
Estimated median house/condo value in 2022: $182,193
71203:
$182,193
Louisiana:
$209,200
According to our research of Louisiana and other state lists, there were 81 registered sex offenders living in 71203 zip code as of April 26, 2024. The ratio of all residents to sex offenders in zip code 71203 is 473 to 1. The ratio of registered sex offenders to all residents in this zip code is lower than the state average.
Median resident age:
This zip code:
34.0 years
Louisiana median age:
38.2 years
Average household size:
This zip code:
2.5 people
Louisiana:
2.5 people
Averages for the 2020 tax year for zip code 71203, filed in 2021:
Average Adjusted Gross Income (AGI) in 2020: $52,910 (Individual Income Tax Returns)
Here:
$52,910
State:
$60,757
Salary/wage: $44,339 (reported on 85.8% of returns)
Here:
$44,339
State:
$50,882
(% of AGI for various income ranges: 1179.2% for AGIs below $25k, 3674.7% for AGIs $25k-50k, 6973.0% for AGIs $50k-75k, 10075.1% for AGIs $75k-100k, 19227.6% for AGIs $100k-200k, 70995.8% for AGIs over 200k)
Taxable interest for individuals: $1,343 (reported on 20.1% of returns)
This zip code:
$1,343
Louisiana:
$1,576
(% of AGI for various income ranges: 6.1% for AGIs below $25k, 14.0% for AGIs $25k-50k, 37.1% for AGIs $50k-75k, 54.6% for AGIs $75k-100k, 103.2% for AGIs $100k-200k, 1389.2% for AGIs over 200k)
Ordinary dividends: $5,650 (reported on 10.0% of returns)
Here:
$5,650
State:
$7,743
(% of AGI for various income ranges: 7.1% for AGIs below $25k, 15.8% for AGIs $25k-50k, 55.9% for AGIs $50k-75k, 107.6% for AGIs $75k-100k, 247.5% for AGIs $100k-200k, 3575.0% for AGIs over 200k)
Net capital gain/loss in AGI: +$13,274 (reported on 9.3% of returns)
Here:
+$13,274
State:
+$16,917
(% of AGI for various income ranges: 3.4% for AGIs below $25k, 12.9% for AGIs $25k-50k, 37.7% for AGIs $50k-75k, 198.9% for AGIs $75k-100k, 351.0% for AGIs $100k-200k, 11401.7% for AGIs over 200k)
Profit/loss from business: +$3,684 (reported on 17.0% of returns)
Here:
+$3,684
State:
+$7,679
(% of AGI for various income ranges: 45.2% for AGIs below $25k, 29.7% for AGIs $50k-75k, 129.4% for AGIs $75k-100k, 354.8% for AGIs $100k-200k, 3904.2% for AGIs over 200k)
Taxable individual retirement arrangement distribution: $16,757 (reported on 6.2% of returns)
71203:
$16,757
Louisiana:
$20,716
(% of AGI for various income ranges: 21.9% for AGIs below $25k, 66.9% for AGIs $25k-50k, 199.8% for AGIs $50k-75k, 277.6% for AGIs $75k-100k, 667.2% for AGIs $100k-200k, 2260.0% for AGIs over 200k)
Self-employed (Keogh) retirement plans: $26,667 (reported on 0.2% of returns)
71203:
$26,667
Louisiana:
$27,459
(% of AGI for various income ranges: 100.0% for AGIs $100k-200k)
Total itemized deductions: $34,449 (reported on 6.3% of returns)
Here:
$34,449
State:
$36,265
(% of AGI for various income ranges: 17.7% for AGIs below $25k, 89.3% for AGIs $25k-50k, 375.7% for AGIs $50k-75k, 590.1% for AGIs $75k-100k, 1274.2% for AGIs $100k-200k, 8368.3% for AGIs over 200k)
Charity contributions: $15,526 (reported on 5.1% of returns)
Here:
$15,526
State:
$13,106
(% of AGI for various income ranges: 2.1% for AGIs below $25k, 18.9% for AGIs $25k-50k, 106.1% for AGIs $50k-75k, 163.8% for AGIs $75k-100k, 488.4% for AGIs $100k-200k, 4136.7% for AGIs over 200k)
Taxes paid: $6,514 (reported on 5.7% of returns)
71203:
$6,514
State:
$6,643
(% of AGI for various income ranges: 0.9% for AGIs below $25k, 9.9% for AGIs $25k-50k, 48.7% for AGIs $50k-75k, 90.7% for AGIs $75k-100k, 278.8% for AGIs $100k-200k, 1555.0% for AGIs over 200k)
Earned income credit: $2,828 (reported on 30.4% of returns)
Here:
$2,828
State:
$2,671
(% of AGI for various income ranges: 176.7% for AGIs below $25k, 113.6% for AGIs $25k-50k, 1.1% for AGIs $50k-75k)
Percentage of individuals using paid preparers for their 2020 taxes: 94.1%
Here:
94%
State:
92%
(% for various income ranges: 94.6% for AGIs below $25k, 94.3% for AGIs $25k-50k, 92.9% for AGIs $50k-75k, 92.7% for AGIs $75k-100k, 93.9% for AGIs $100k-200k, 92.7% for AGIs over 200k)
Averages for the 2012 tax year for zip code 71203, filed in 2013:
Average Adjusted Gross Income (AGI) in 2012: $46,191 (Individual Income Tax Returns)
Here:
$46,191
State:
$56,730
Salary/wage: $39,941 (reported on 87.8% of returns)
Here:
$39,941
State:
$45,545
(% of AGI for various income ranges: 82.9% for AGIs below $25k, 85.6% for AGIs $25k-50k, 78.3% for AGIs $50k-75k, 77.3% for AGIs $75k-100k, 78.8% for AGIs $100k-200k, 52.8% for AGIs over 200k)
Taxable interest for individuals: $1,177 (reported on 22.5% of returns)
This zip code:
$1,177
Louisiana:
$1,804
(% of AGI for various income ranges: 0.5% for AGIs below $25k, 0.4% for AGIs $25k-50k, 0.4% for AGIs $50k-75k, 0.5% for AGIs $75k-100k, 0.7% for AGIs $100k-200k, 0.8% for AGIs over 200k)
Ordinary dividends: $4,385 (reported on 11.1% of returns)
Here:
$4,385
State:
$7,610
(% of AGI for various income ranges: 1.0% for AGIs below $25k, 0.8% for AGIs $25k-50k, 0.7% for AGIs $50k-75k, 0.7% for AGIs $75k-100k, 0.8% for AGIs $100k-200k, 2.4% for AGIs over 200k)
Net capital gain/loss in AGI: +$8,146 (reported on 8.6% of returns)
Here:
+$8,146
State:
+$17,096
(% of AGI for various income ranges: 0.3% for AGIs $50k-75k, 0.6% for AGIs $75k-100k, 1.5% for AGIs $100k-200k, 6.1% for AGIs over 200k)
Profit/loss from business: +$7,726 (reported on 16.2% of returns)
Here:
+$7,726
State:
+$12,088
(% of AGI for various income ranges: 6.4% for AGIs below $25k, 0.5% for AGIs $25k-50k, 0.9% for AGIs $50k-75k, 1.5% for AGIs $75k-100k, 1.9% for AGIs $100k-200k, 5.8% for AGIs over 200k)
Taxable individual retirement arrangement distribution: $13,801 (reported on 7.1% of returns)
71203:
$13,801
Louisiana:
$16,085
(% of AGI for various income ranges: 1.5% for AGIs below $25k, 1.7% for AGIs $25k-50k, 2.4% for AGIs $50k-75k, 2.8% for AGIs $75k-100k, 2.1% for AGIs $100k-200k, 2.2% for AGIs over 200k)
Self-employment retirement plans: $23,267 (reported on 0.2% of returns)
71203:
$23,267
Louisiana:
$25,119
(% of AGI for various income ranges: 0.5% for AGIs $100k-200k)
Total itemized deductions: $21,442 (21% of AGI, reported on 22.5% of returns)
Here:
$21,442
State:
$23,585
Here:
20.8% of AGI
State:
18.1% of AGI
(% of AGI for various income ranges: 4.7% for AGIs below $25k, 8.8% for AGIs $25k-50k, 10.8% for AGIs $50k-75k, 12.4% for AGIs $75k-100k, 13.6% for AGIs $100k-200k, 10.7% for AGIs over 200k)
Charity contributions: $6,208 (reported on 18.6% of returns)
Here:
$6,208
State:
$5,533
(% of AGI for various income ranges: 0.8% for AGIs below $25k, 1.9% for AGIs $25k-50k, 2.5% for AGIs $50k-75k, 3.0% for AGIs $75k-100k, 3.4% for AGIs $100k-200k, 3.0% for AGIs over 200k)
Taxes paid: $5,059 (reported on 22.4% of returns)
71203:
$5,059
State:
$6,282
(% of AGI for various income ranges: 0.6% for AGIs below $25k, 1.2% for AGIs $25k-50k, 2.0% for AGIs $50k-75k, 2.4% for AGIs $75k-100k, 3.5% for AGIs $100k-200k, 4.3% for AGIs over 200k)
Earned income credit: $2,789 (reported on 33.1% of returns)
Here:
$2,789
State:
$2,633
(% of AGI for various income ranges: 12.7% for AGIs below $25k, 1.7% for AGIs $25k-50k)
Percentage of individuals using paid preparers for their 2012 taxes: 56.2%
Here:
56%
State:
57%
(% for various income ranges: 55.8% for AGIs below $25k, 51.5% for AGIs $25k-50k, 54.5% for AGIs $50k-75k, 62.7% for AGIs $75k-100k, 63.2% for AGIs $100k-200k, 80.0% for AGIs over 200k)
Averages for the 2004 tax year for zip code 71203, filed in 2005:
Average Adjusted Gross Income (AGI) in 2004: $37,720 (Individual Income Tax Returns)
Here:
$37,720
State:
$39,411
Salary/wage: $33,692 (reported on 88.6% of returns)
Here:
$33,692
State:
$34,434
(% of AGI for various income ranges: 105.3% for AGIs below $10k, 84.4% for AGIs $10k-25k, 84.8% for AGIs $25k-50k, 83.4% for AGIs $50k-75k, 83.2% for AGIs $75k-100k, 64.3% for AGIs over 100k)
Taxable interest for individuals: $1,516 (reported on 30.5% of returns)
This zip code:
$1,516
Louisiana:
$1,606
(% of AGI for various income ranges: 2.6% for AGIs below $10k, 1.3% for AGIs $10k-25k, 1.2% for AGIs $25k-50k, 1.0% for AGIs $50k-75k, 1.3% for AGIs $75k-100k, 1.3% for AGIs over 100k)
Taxable dividends: $2,400 (reported on 14.3% of returns)
Here:
$2,400
State:
$3,235
(% of AGI for various income ranges: 2.5% for AGIs below $10k, 0.5% for AGIs $10k-25k, 0.6% for AGIs $25k-50k, 0.6% for AGIs $50k-75k, 0.9% for AGIs $75k-100k, 1.4% for AGIs over 100k)
Net capital gain/loss: +$5,754 (reported on 11.4% of returns)
Here:
+$5,754
State:
+$8,531
(% of AGI for various income ranges: -0.9% for AGIs below $10k, 0.1% for AGIs $10k-25k, 0.2% for AGIs $25k-50k, 0.5% for AGIs $50k-75k, 0.7% for AGIs $75k-100k, 5.4% for AGIs over 100k)
Profit/loss from business: +$7,871 (reported on 14.6% of returns)
Here:
+$7,871
State:
+$9,128
(% of AGI for various income ranges: 6.2% for AGIs below $10k, 4.4% for AGIs $10k-25k, 1.5% for AGIs $25k-50k, 1.1% for AGIs $50k-75k, 1.8% for AGIs $75k-100k, 5.5% for AGIs over 100k)
IRA payment deduction: $3,307 (reported on 1.6% of returns)
71203:
$3,307
Louisiana:
$3,055
(% of AGI for various income ranges: 0.1% for AGIs $10k-25k, 0.2% for AGIs $25k-50k, 0.1% for AGIs $50k-75k, 0.1% for AGIs $75k-100k, 0.1% for AGIs over 100k)
Self-employed pension: $17,138 (reported on 0.2% of returns)
Here:
$17,138
Louisiana:
$17,274
Total itemized deductions: $17,996 (23% of AGI, reported on 23.7% of returns)
Here:
$17,996
State:
$18,222
Here:
22.8% of AGI
State:
20.3% of AGI
(% of AGI for various income ranges: 4.9% for AGIs below $10k, 4.9% for AGIs $10k-25k, 10.8% for AGIs $25k-50k, 11.9% for AGIs $50k-75k, 14.1% for AGIs $75k-100k, 13.4% for AGIs over 100k)
Charity contributions deductions: $4,934 (6% of AGI, reported on 20.3% of returns)
Here:
$4,934
State:
$4,190
Here:
6.0% of AGI
State:
4.4% of AGI
(% of AGI for various income ranges: 0.4% for AGIs below $10k, 0.7% for AGIs $10k-25k, 2.2% for AGIs $25k-50k, 3.0% for AGIs $50k-75k, 3.5% for AGIs $75k-100k, 3.4% for AGIs over 100k)
Total tax: $5,720 (reported on 65.2% of returns)
71203:
$5,720
State:
$6,529
(% of AGI for various income ranges: 2.8% for AGIs below $10k, 2.9% for AGIs $10k-25k, 6.1% for AGIs $25k-50k, 8.5% for AGIs $50k-75k, 10.5% for AGIs $75k-100k, 17.7% for AGIs over 100k)
Earned income credit: $2,249 (reported on 31.0% of returns)
Here:
$2,249
State:
$2,103
Percentage of individuals using paid preparers for their 2004 taxes: 64.0%
Here:
64%
State:
61%
(% for various income ranges: 59.1% for AGIs below $10k, 70.4% for AGIs $10k-25k, 61.0% for AGIs $25k-50k, 60.0% for AGIs $50k-75k, 62.6% for AGIs $75k-100k, 70.2% for AGIs over 100k)
Likely homosexual households (counted as self-reported same-sex unmarried-partner households)
Lesbian couples: 0.4% of all households
Gay men: 0.0% of all households
Household received Food Stamps/SNAP in the past 12 months: 3,050 Household did not receive Food Stamps/SNAP in the past 12 months: 12,259
Women who had a birth in the past 12 months: 641 (224 now married, 424 unmarried) Women who did not have a birth in the past 12 months: 9,347 (3,173 now married, 6,184 unmarried)
Housing units in zip code 71203 with a mortgage: 5,167 (266 second mortgage, 169 both second mortgage and home equity loan) Houses without a mortgage: 52
Median monthly owner costs for units with a mortgage: $1,357 Median monthly owner costs for units without a mortgage: $470
Residents with income below the poverty level in 2022:
This zip code:
23.4%
Whole state:
18.6%
Residents with income below 50% of the poverty level in 2022:
This zip code:
12.9%
Whole state:
10.1%
Median number of rooms in houses and condos:
Here:
6.3
State:
6.2
Median number of rooms in apartments:
Here:
4.4
State:
4.4
Notable locations in this zip code not listed on our city pages
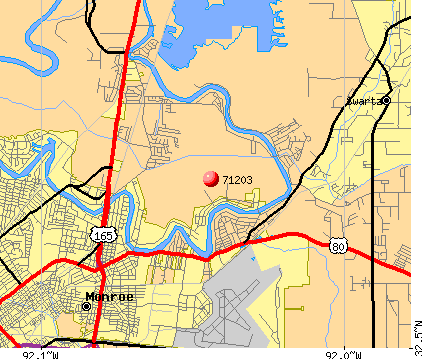
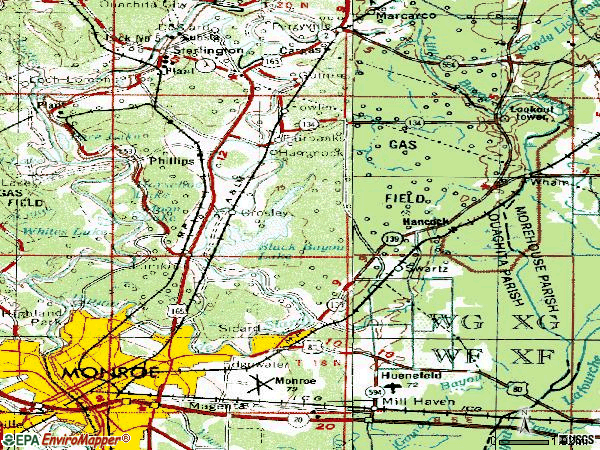
Notable locations in zip code 71203: Phillips (A), Glendora Plantation (B), Lock Arbor (C), Bakers Landing (D), D'Arbonne Landing (E), Glendora Landing (F), Monroe Industrial Park (G), Moon Lake Landing (H), Smith Landing (I), Sterlington Landing (J), Sterlington Station (K), White Landing (L), Youngs Landing (M), Monroe Fire Department Station 7 Monroe Regional Airport (N), Monroe Fire Department Station 9 Cypress Point (O), Saint Joseph Home (P), Brown Auditorium (Q), Ewing Coliseum (R), Louisiana Baptist Childrens Home (S), Sandel Library (T). Display/hide their locations on the map
Shopping Centers: Pecanland Mall Shopping Center (1), Lakeshore Shopping Center (2), Westchester Shopping Center (3). Display/hide their locations on the map
Churches in zip code 71203 include: Love Road Church (A), Bethel Church (B), Fairbanks Baptist Church (C), Loch Arbor Baptist Church (D), King Solomon Church (E), Baptist Student Center (F), College Place Baptist Church (G), College Town Assembly of God Church (H), First Apostolic Church (I). Display/hide their locations on the map
Cemeteries: Bufferin Cemetery (1), Phillips Cemetery (2), Spring Hill Cemetery (3), Cosper Cemetery (4), Memorial Park Cemetery (5), Glendora Cemetery (6), Rock Row Cemetery (7). Display/hide their locations on the map
Lakes and swamps: Pace Lake (A), Black Bayou Lake (B), Moon Lake (C), Hamilton Lake (D), Horseshoe Lake (E), Fish Lake (F), Alligator Lake (G), Devils Hole (H). Display/hide their locations on the map
Streams, rivers, and creeks: Caney Creek (A), Black Bayou (B), Puckett Slough (C), River Styx Bayou (D), Mill Bayou (E), Long Bridge Creek (F), Lonewa Bayou (G). Display/hide their locations on the map
Parks in zip code 71203 include: Powell Avenue Recreation Center (1), Malone Stadium (2), Heard Tennis Stadium (3), Cities Service Wildlife Management Area (4), Chenault Park (5), Brown Stadium (6), Russell Sage State Wildlife Management Area (7). Display/hide their locations on the map
In group quarters: 1,113 (-1 institutionalized population)
Size of family households: 3,941 2-persons, 2,107 3-persons, 1,870 4-persons, 610 5-persons, 343 6-persons, 138 7-or-more-persons
Size of nonfamily households: 5,421 1-person, 674 2-persons, 184 3-persons
4,608 married couples with children.
3,886 single-parent households (471 men, 3,415 women).
96.1% of residents of 71203 zip code speak English at home.
1.1% of residents speak Spanish at home (58% very well, 33% well, 6% not well, 4% not at all).
1.3% of residents speak other Indo-European language at home (79% very well, 21% well).
1.0% of residents speak Asian or Pacific Island language at home (84% very well, 13% well, 3% not well).
0.4% of residents speak other language at home (71% very well, 29% well).
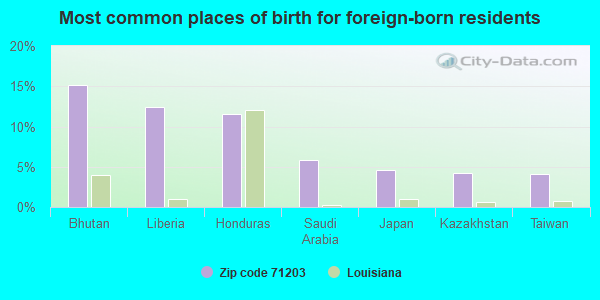
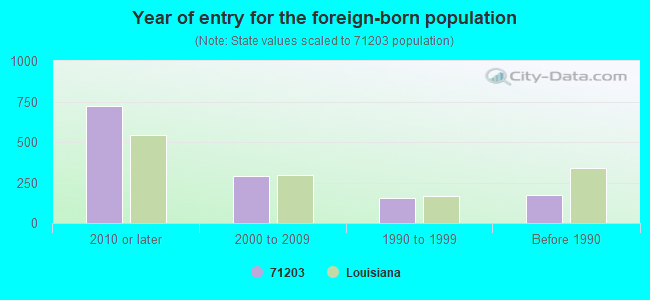
Foreign born population: 1,205 (3.0%) (36.0% of them are naturalized citizens)
Major facilities with environmental interests located in this zip code:
GUIDE LOUISIANA LLC (11000 MILHAVEN ROAD in MONROE, LA)
CRITERIA AND HAZARDOUS AIR POLLUTANT INVENTORY (Inventory of air pollution sources) National Pollutant Discharge Elimination System NON-MAJOR (Tracking pollutant discharge elimination systems) - permit AIR MAJOR ("Best Available" air pollution technologies tracking) HAZARDOUS WASTE BIENNIAL REPORTER (Resource Conservation and Recovery Act (tracking hazardous waste)) Large Quantity Generators, more that 1000 kg of hazardous waste/month (Resource Conservation and Recovery Act (tracking hazardous waste)) - notification TRI REPORTER (Tracking of toxic chemicals releasing facilities) Business SIC classification: PLASTICS PRODUCTS; VEHICULAR LIGHTING EQUIPMENT Business NAICS classification: VEHICULAR LIGHTING EQUIPMENT MANUFACTURING.; VEHICULAR LIGHTING EQUIPMENT MANUFACTURING. Organizations: DENNIS CHAPPELL (CONTACT/OPERATOR)
, GUIDE LOUISIANA, LLC (CONTACT/OWNER)
Alternative names: DELPHI INTERIOR AND LIGHTING SYSTEMS, DELPHI INTERIOR AND LIGHTING SYSTEMS, DELPHI INTR LIT, GUIDE CORPORATION, GUIDE CORPORATION, GUIDE LOUISIANA L L C, MONROE GUIDE LLC
OUACHITA PARISH HIGH SCHOOL (681 HIGHWAY 594 in MONROE, LA)
(Geographic Names Information System) (National Center for Education Statistics) - STATE ID-037019 Organizations: OUACHITA PARISH SCHOOL BOARD (SCHOOL DISTRICT)
MOORE FERTILIZER & CHEM CO (2428 STERLINGTON RD in MONROE, LA)
(Integrated Compliance Information System) - ICIS-06-1989-0478, FORMAL ENFORCEMENT ACTION COMPLIANCE ACTIVITY (Tracking inspections of insecticide, fungicide, and rodenticide, and toxic substances)
OUACHITA JUNIOR HIGH SCHOOL (5500 BLANKS STREET in MONROE, LA)
(Geographic Names Information System) (National Center for Education Statistics) - STATE ID-037020 Organizations: OUACHITA PARISH SCHOOL BOARD (SCHOOL DISTRICT)
GOAL (GO-ACHIEVE-LEARN) SCHOOL (300 SHERROUSE STREET in MONROE, LA)
(National Center for Education Statistics) - STATE ID-065029 Organizations: CITY OF MONROE SCHOOL BOARD (SCHOOL DISTRICT)
E-Z MART #114 (338 HWY 594 in MONROE, LA)
(Integrated Compliance Information System) - ICIS-06-1998-0210, FORMAL ENFORCEMENT ACTION Business SIC classification: GROCERY STORES
NEIGHBOR'S WATER WELL CORP WATER SYS (128 OLD DEPOT RD in MONROE, LA)
(Integrated Compliance Information System) - ICIS-06-2000-0740, FORMAL ENFORCEMENT ACTION Business SIC classification: WATER SUPPLY
CHARMINGDALE SUBDIVISION WATER SYS (1863 HWY 80 E in MONROE, LA)
(Integrated Compliance Information System) - ICIS-06-2000-0737, FORMAL ENFORCEMENT ACTION Business SIC classification: WATER SUPPLY
HIGH COUNTRY ESTATES WATER SYS (1863 HWY 80 E in MONROE, LA)
(Integrated Compliance Information System) - ICIS-06-2000-0744, FORMAL ENFORCEMENT ACTION Business SIC classification: WATER SUPPLY
FLEETWOOD PARK SUBDIVISION WATER SYS (1863 HWY 80 E in MONROE, LA)
(Integrated Compliance Information System) - ICIS-06-2000-0738, FORMAL ENFORCEMENT ACTION Business SIC classification: WATER SUPPLY
RIETSCHLE THOMAS MONROE (4601 CENTRAL AVENUE in MONROE, LA)
AIR MINOR (AIRS/AFS) Conditionally Exempt Small Quantity Generators, less than 100 kg/month of hazardous waste (Resource Conservation and Recovery Act (tracking hazardous waste)) - notification Business SIC classification: COATING, ENGRAVING, AND ALLIED SERVICES Business NAICS classification: AIR AND GAS COMPRESSOR MANUFACTURING. Organizations: THOMAS INDUSTRIES (CONTACT/OWNER)
Alternative names: JOHN KUECKER, THOMAS INDUSTRIES, THOMAS IND/MONROE
MONROE MACK SLS (2602 MILHAVEN RD in MONROE, LA)
National Pollutant Discharge Elimination System NON-MAJOR (Tracking pollutant discharge elimination systems) - permit Conditionally Exempt Small Quantity Generators, less than 100 kg/month of hazardous waste (Resource Conservation and Recovery Act (tracking hazardous waste)) - notification Business SIC classification: NONCLASSIFIABLE ESTABLISHMENTS Organizations: MONROE MACK SALES (CONTACT/OWNER)
Alternative names: MONROE MACK SALES INC., MONROE MACK SALES I-
ALLEN TRACTOR CO (806 I20 E FRONTAGE RD in MONROE, LA)
(Resource Conservation and Recovery Act (tracking hazardous waste)) Organizations: JIM ALLEN (CONTACT/OWNER)
Housing units lacking complete plumbing facilities: 1.3% Housing units lacking complete kitchen facilities: 1.8%
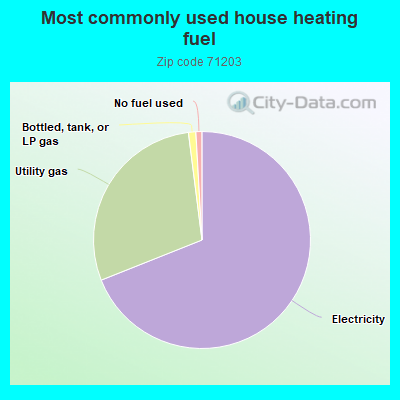
68.9%Electricity
29.0%Utility gas
1.1%Bottled, tank, or LP gas
0.9%No fuel used
Population in 1990: 35,643.
Place of birth for U.S.-born residents:
This state: 30,921
Northeast: 373
Midwest: 1,397
South: 4,508
West: 1,077
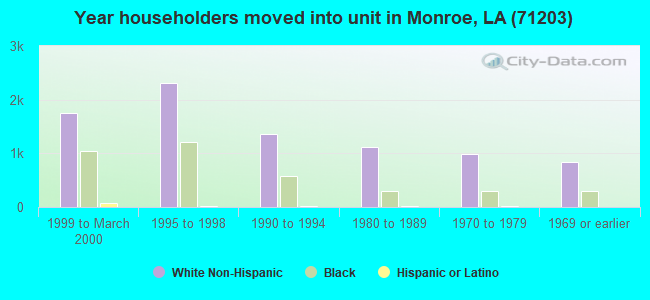
53% of the 71203 zip code residents lived in the same house 5 years ago. Out of people who lived in different houses, 58% lived in this county. Out of people who lived in different counties, 50% lived in Louisiana.
91% of the 71203 zip code residents lived in the same house 1 year ago. Out of people who lived in different houses, 74% moved from this county. Out of people who lived in different houses, 14% moved from different county within same state. Out of people who lived in different houses, 8% moved from different state. Out of people who lived in different houses, 3% moved from abroad.
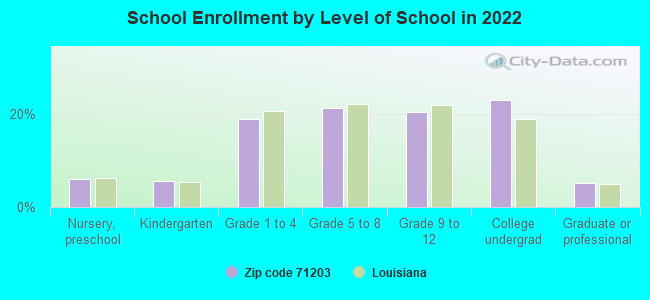
Private vs. public school enrollment:
Students in private schools in grades 1 to 8 (elementary and middle school): 731
Here:
16.0%
Louisiana:
19.6%
Students in private schools in grades 9 to 12 (high school): 361
Here:
15.5%
Louisiana:
18.3%
Students in private undergraduate colleges: 388
Here:
14.5%
Louisiana:
17.4%
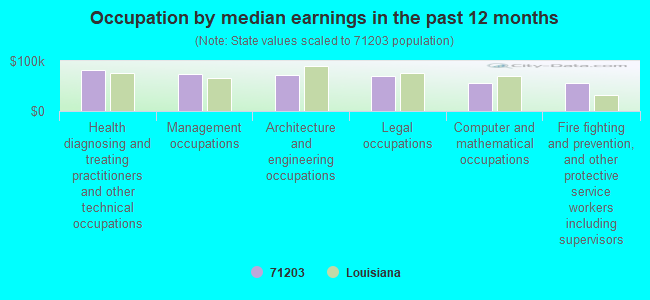
Occupation by median earnings in the past 12 months ($)
82,760Health diagnosing and treating practitioners and other technical occupations
73,934Management occupations
71,526Architecture and engineering occupations
70,511Legal occupations
55,751Computer and mathematical occupations
55,636Fire fighting and prevention, and other protective service workers including supervisors
Companies with biggest federal contracts located in this zip code (MONROE, LA):
COOLEY DENNIS & DENMON ENGINEE (114 VENABLE LANE; small business) : $27,742,393 in 174 contractsfrom 1999 to 2006
Contracts for Engineering and Technical Services, Other Quality Control, Testing and Inspection Services -- Miscellaneous, Architect - Engineer Services (including landscaping, interior layout, and designing) by Army, U.S. Army Corps of Engineers - civil program financing only Signed by year:2000: $921,930; 2001: $456,766; 2002: $937,561; 2003: $1,129,373; 2004: $150,831; 2005: $24,058,503; 2006: $18,384.
Biggest contracts:
$21,769,713 with Army for Engineering and Technical Services. Signed on 2005-11-09. Completion date: 2005-11-29.
$874,680 with Army for Other Quality Control, Testing and Inspection Services -- Miscellaneous. Taking place in MS. Signed on 2005-09-16. Completion date: 2005-12-30.
$874,680 with U.S. Army Corps of Engineers - civil program financing only for Other Quality Control, Testing and Inspection Services -- Miscellaneous. Taking place in MS. Signed on 2005-09-16. Completion date: 2005-12-30.
$416,160 with U.S. Army Corps of Engineers - civil program financing only for Other Quality Control, Testing and Inspection Services -- Miscellaneous. Taking place in AR. Signed on 2000-07-27. Completion date: 2002-10-31.
GREEN LOUIS PARK SERVICE INC (487 KEYSTONE RD; small business) : $3,311,187 in 96 contractsfrom 1999 to 2006
Contracts for Landscaping/Groundskeeping Services, Custodial Janitorial Services by Army, U.S. Army Corps of Engineers - civil program financing only, Air Force Signed by year:2000: $431,684; 2001: $671,714; 2002: $237,439; 2003: $383,018; 2004: $360,661; 2005: $660,160; 2006: $503,344.
Biggest contracts:
$263,000 with Army for Landscaping/Groundskeeping Services. Taking place in AR. Signed on 2006-05-18. Completion date: 2006-05-31.
$154,683 with U.S. Army Corps of Engineers - civil program financing only for Landscaping/Groundskeeping Services. Taking place in AR. Signed on 2005-06-01. Completion date: 2006-05-31.
$154,683 with Army for Landscaping/Groundskeeping Services. Taking place in AR. Signed on 2005-06-01. Completion date: 2006-05-31.
$142,785 with Army for Landscaping/Groundskeeping Services. Signed on 2004-01-29. Completion date: 2004-07-31.
MONROE AIR CENTER,LLC (5410 OPERATIONS ROAD; small business) : $2,831,532 in 2 contractsfrom 2001 to 2003
$1,542,209 with Defense Logistics Agency for Liquid Propellants and Fuels, Petroleum Base. Signed on 2001-05-09. Completion date: 2004-03-31.
$1,289,323, same as above.Signed on 2003-12-30. Completion date: 2007-03-31.
CONSOLIDATED TRUCK PARTS INC (2604 MILLHAVEN RD; small business) : $1,206,362 in 36 contractsfrom 2004 to 2006
Contracts for Vehicular Power Transmission Components, Vehicular Brake, Steering, Axle, Wheel, and Track Components, Miscellaneous Vehicular Components, Guided Missile Handling and Servicing Equipment, and moreby Army, Defense Logistics Agency Signed by year:2000: $0; 2001: $0; 2002: $0; 2003: $0; 2004: $552,599; 2005: $156,346; 2006: $497,417.
Biggest contracts:
$526,253 with Army for Vehicular Power Transmission Components. Signed on 2004-12-16. Completion date: 2005-12-30.
$58,625, same as above.Signed on 2006-06-23. Completion date: 2006-06-30.
$58,625, same as above.Signed on 2006-02-01. Completion date: 2006-02-03.
$58,625, same as above.Signed on 2006-04-11. Completion date: 2006-04-14.
CENTURYTEL INC (100 CENTURYTEL DRIVE) : $716,115 in 35 contractsfrom 2000 to 2006
Contracts for Telephone and/or Communications Services (includes Telegraph, Telex, and Cablevision Services), ADP Telecommunications and Transmission Services, Telephone and Telegraph Equipment by Army, National Park Service, U.S. Coast Guard, Department of Veterans Affairs, and others Signed by year:2000: $58,000; 2001: $0; 2002: $0; 2003: $51,559; 2004: $164,482; 2005: $324,678; 2006: $117,396.
Biggest contracts:
$63,941 with Army for Telephone and/or Communications Services (includes Telegraph, Telex, and Cablevision Services). Taking place in WI. Signed on 2005-02-18. Completion date: 2005-11-30.
$63,941, same as above.Signed on 2005-12-06. Completion date: 2005-11-30.
$58,000 with National Park Service for Telephone and/or Communications Services (includes Telegraph, Telex, and Cablevision Services). Taking place in WA. Signed on 2000-08-15. Completion date: 2001-01-15.
$55,200 with U.S. Coast Guard for ADP Telecommunications and Transmission Services. Taking place in DC. Signed on 2005-10-06. Effective on 2005-10-03. Completion date: 2005-10-03.
MONROE MACK SALES INC (2602 MILLHAVEN RD; small business)
$157,356 with Defense Logistics Agency for Industrial Sewing Machines and Mobile Textile Repair Shops. Signed on 2002-04-01. Completion date: 2002-05-10.
SALVATOS SVCS (114 BIRCHWOOD DR; small business)
$88,856 with Air Force for Landscaping/Groundskeeping Services. Signed on 2002-03-27. Completion date: 2002-04-30.
SOLO COMPOSITE SOLUTIONS, INC (1030 INABNET BLVD, SW 504; small business)
$74,700 with Defense Logistics Agency for Miscellaneous Construction Materials. Taking place in DC. Signed on 2001-11-05. Completion date: 2001-12-28.
AUTOMATED DIGITAL TECHNOLOGIES (104 SHADY LANE; small business) : $73,571 in 2 contractsfrom 2000 to 2002
$45,375 with Air Force for Photographic Sets, Kits, and Outfits. Signed on 2002-09-25. Completion date: 2002-10-25.
$28,196 with Air Force for Maintenance, Repair or Alteration of Real Property -- Office Buildings. Signed on 2000-05-04. Completion date: 2000-05-22.
SCOTT CONSTRUCTION EQUIPMENT C (1000 HIGHWAY 165 N) : $70,845 in 9 contractsfrom 2004 to 2005
Contracts for Lease or Rental of Equipment -- Construction, Mining, Excavating, and Highway Maintenance Equipment, Earth Moving and Excavating Equipment by Army, U.S. Army Corps of Engineers - civil program financing only, U.S. Fish and Wildlife Service Signed by year:2000: $0; 2001: $0; 2002: $0; 2003: $0; 2004: $76,365; 2005: -$5,520; 2006: $0.
Biggest contracts:
$25,000 with Army for Lease or Rental of Equipment -- Construction, Mining, Excavating, and Highway Maintenance Equipment. Signed on 2004-08-26. Completion date: 2004-11-02.
$25,000 with U.S. Army Corps of Engineers - civil program financing only for Lease or Rental of Equipment -- Construction, Mining, Excavating, and Highway Maintenance Equipment. Signed on 2004-08-26. Completion date: 2004-11-02.
$8,000 with U.S. Fish and Wildlife Service for Earth Moving and Excavating Equipment. Signed on 2004-07-15. Completion date: 2004-07-15.
$6,475, same as above.Signed on 2004-06-04. Completion date: 2004-07-14.
Top industries in this zip code by the number of employees in 2005:
2002 - 2018 National Fire Incident Reporting System (NFIRS) incidents
According to the data from the years 2002 - 2018 the average number of fire incidents per year is 150. The highest number of reported fires - 233 took place in 2010, and the least - 67 in 2014. The data has an increasing trend.
When looking into fire subcategories, the most reports belonged to: Outside Fires (47.3%), and Structure Fires (35.3%).
Fire incident types reported to NFIRS in Zip Code 71203


 Nearest zip codes: 71209, 71201, 71229, 71291, 71280, 71202.


 According to the data from the years 2002 - 2018 the average number of fire incidents per year is 150. The highest number of reported fires - 233 took place in 2010, and the least - 67 in 2014. The data has an increasing trend.
 When looking into fire subcategories, the most reports belonged to: Outside Fires (47.3%), and Structure Fires (35.3%).