Estimated zip code population in 2022: 34,230 Zip code population in 2010: 32,644 Zip code population in 2000: 31,063
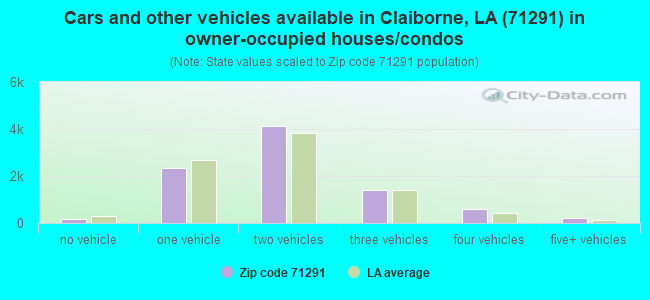
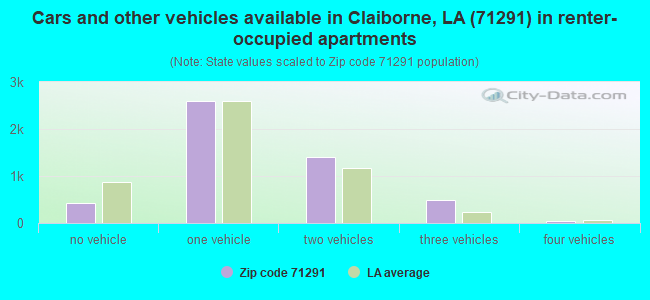
Houses and condos: 15,525 Renter-occupied apartments: 4,972
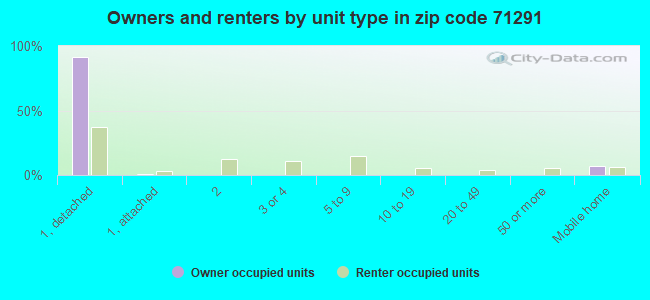
% of renters here:
36%
State:
32%
March 2022 cost of living index in zip code 71291: 84.5 (less than average, U.S. average is 100)
Land area: 64.8 sq. mi. Water area: 2.1 sq. mi.
Population density: 528 people per square mile
(low).
OSM Map
General Map
Google Map
MSN Map
OSM Map
General Map
Google Map
MSN Map
OSM Map
General Map
Google Map
MSN Map
OSM Map
General Map
Google Map
MSN Map
Please wait while loading the map...
Real estate property taxes paid for housing units in 2022:
This zip code:
0.4% ($944)
Louisiana:
0.5% ($1,127)
Median real estate property taxes paid for housing units with mortgages in 2022: $1,043 (0.5%) Median real estate property taxes paid for housing units with no mortgage in 2022: $883 (0.4%)
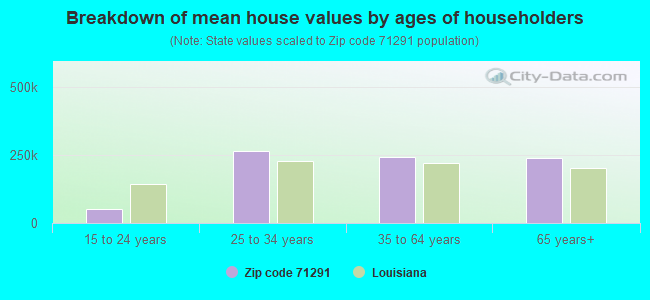
Estimated median house/condo value in 2022: $215,952
71291:
$215,952
Louisiana:
$209,200
According to our research of Louisiana and other state lists, there were 38 registered sex offenders living in 71291 zip code as of April 27, 2024. The ratio of all residents to sex offenders in zip code 71291 is 851 to 1. The ratio of registered sex offenders to all residents in this zip code is lower than the state average.
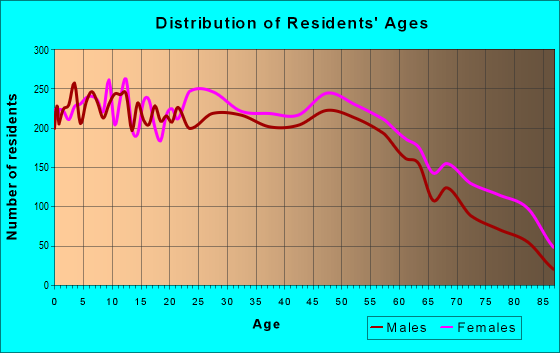
Median resident age:
This zip code:
39.0 years
Louisiana median age:
38.2 years
Average household size:
This zip code:
2.4 people
Louisiana:
2.5 people
Averages for the 2020 tax year for zip code 71291, filed in 2021:
Average Adjusted Gross Income (AGI) in 2020: $63,164 (Individual Income Tax Returns)
Here:
$63,164
State:
$60,757
Salary/wage: $52,721 (reported on 82.0% of returns)
Here:
$52,721
State:
$50,882
(% of AGI for various income ranges: 1077.9% for AGIs below $25k, 3549.8% for AGIs $25k-50k, 6674.2% for AGIs $50k-75k, 9689.5% for AGIs $75k-100k, 17938.0% for AGIs $100k-200k, 62868.8% for AGIs over 200k)
Taxable interest for individuals: $1,241 (reported on 27.9% of returns)
This zip code:
$1,241
Louisiana:
$1,576
(% of AGI for various income ranges: 11.4% for AGIs below $25k, 19.7% for AGIs $25k-50k, 40.2% for AGIs $50k-75k, 63.0% for AGIs $75k-100k, 113.7% for AGIs $100k-200k, 1000.6% for AGIs over 200k)
Ordinary dividends: $5,498 (reported on 13.3% of returns)
Here:
$5,498
State:
$7,743
(% of AGI for various income ranges: 14.1% for AGIs below $25k, 25.8% for AGIs $25k-50k, 53.9% for AGIs $50k-75k, 109.7% for AGIs $75k-100k, 245.7% for AGIs $100k-200k, 3008.8% for AGIs over 200k)
Net capital gain/loss in AGI: +$22,985 (reported on 13.3% of returns)
Here:
+$22,985
State:
+$16,917
(% of AGI for various income ranges: 8.8% for AGIs below $25k, 24.4% for AGIs $25k-50k, 73.3% for AGIs $50k-75k, 121.2% for AGIs $75k-100k, 476.1% for AGIs $100k-200k, 22586.2% for AGIs over 200k)
Profit/loss from business: +$9,767 (reported on 17.1% of returns)
Here:
+$9,767
State:
+$7,679
(% of AGI for various income ranges: 84.6% for AGIs below $25k, 112.3% for AGIs $25k-50k, 159.2% for AGIs $50k-75k, 211.5% for AGIs $75k-100k, 548.0% for AGIs $100k-200k, 4593.1% for AGIs over 200k)
Taxable individual retirement arrangement distribution: $16,322 (reported on 8.8% of returns)
71291:
$16,322
Louisiana:
$20,716
(% of AGI for various income ranges: 40.3% for AGIs below $25k, 101.3% for AGIs $25k-50k, 174.2% for AGIs $50k-75k, 344.3% for AGIs $75k-100k, 566.4% for AGIs $100k-200k, 2840.6% for AGIs over 200k)
Self-employed (Keogh) retirement plans: $26,033 (reported on 0.2% of returns)
71291:
$26,033
Louisiana:
$27,459
(% of AGI for various income ranges: 488.1% for AGIs over 200k)
Total itemized deductions: $37,517 (reported on 5.9% of returns)
Here:
$37,517
State:
$36,265
(% of AGI for various income ranges: 27.9% for AGIs below $25k, 77.5% for AGIs $25k-50k, 173.2% for AGIs $50k-75k, 330.5% for AGIs $75k-100k, 944.8% for AGIs $100k-200k, 8085.6% for AGIs over 200k)
Charity contributions: $19,419 (reported on 4.8% of returns)
Here:
$19,419
State:
$13,106
(% of AGI for various income ranges: 1.2% for AGIs below $25k, 15.8% for AGIs $25k-50k, 41.5% for AGIs $50k-75k, 84.9% for AGIs $75k-100k, 399.0% for AGIs $100k-200k, 4460.6% for AGIs over 200k)
Taxes paid: $6,328 (reported on 5.6% of returns)
71291:
$6,328
State:
$6,643
(% of AGI for various income ranges: 1.5% for AGIs below $25k, 7.2% for AGIs $25k-50k, 20.8% for AGIs $50k-75k, 53.0% for AGIs $75k-100k, 188.4% for AGIs $100k-200k, 1272.5% for AGIs over 200k)
Earned income credit: $2,470 (reported on 20.0% of returns)
Here:
$2,470
State:
$2,671
(% of AGI for various income ranges: 119.2% for AGIs below $25k, 83.4% for AGIs $25k-50k, 1.0% for AGIs $50k-75k)
Percentage of individuals using paid preparers for their 2020 taxes: 93.2%
Here:
93%
State:
92%
(% for various income ranges: 92.9% for AGIs below $25k, 93.6% for AGIs $25k-50k, 92.1% for AGIs $50k-75k, 94.1% for AGIs $75k-100k, 93.6% for AGIs $100k-200k, 93.9% for AGIs over 200k)
Averages for the 2012 tax year for zip code 71291, filed in 2013:
Average Adjusted Gross Income (AGI) in 2012: $53,799 (Individual Income Tax Returns)
Here:
$53,799
State:
$56,730
Salary/wage: $46,198 (reported on 85.3% of returns)
Here:
$46,198
State:
$45,545
(% of AGI for various income ranges: 76.4% for AGIs below $25k, 82.2% for AGIs $25k-50k, 77.9% for AGIs $50k-75k, 79.7% for AGIs $75k-100k, 78.1% for AGIs $100k-200k, 46.5% for AGIs over 200k)
Taxable interest for individuals: $1,325 (reported on 30.0% of returns)
This zip code:
$1,325
Louisiana:
$1,804
(% of AGI for various income ranges: 0.9% for AGIs below $25k, 0.5% for AGIs $25k-50k, 0.6% for AGIs $50k-75k, 0.5% for AGIs $75k-100k, 0.7% for AGIs $100k-200k, 1.3% for AGIs over 200k)
Ordinary dividends: $3,767 (reported on 13.7% of returns)
Here:
$3,767
State:
$7,610
(% of AGI for various income ranges: 1.0% for AGIs below $25k, 0.6% for AGIs $25k-50k, 0.7% for AGIs $50k-75k, 0.5% for AGIs $75k-100k, 0.7% for AGIs $100k-200k, 2.2% for AGIs over 200k)
Net capital gain/loss in AGI: +$7,651 (reported on 11.6% of returns)
Here:
+$7,651
State:
+$17,096
(% of AGI for various income ranges: 0.2% for AGIs $25k-50k, 0.4% for AGIs $50k-75k, 0.7% for AGIs $75k-100k, 1.3% for AGIs $100k-200k, 6.1% for AGIs over 200k)
Profit/loss from business: +$12,920 (reported on 16.6% of returns)
Here:
+$12,920
State:
+$12,088
(% of AGI for various income ranges: 8.0% for AGIs below $25k, 2.1% for AGIs $25k-50k, 2.5% for AGIs $50k-75k, 1.8% for AGIs $75k-100k, 2.5% for AGIs $100k-200k, 8.9% for AGIs over 200k)
Taxable individual retirement arrangement distribution: $13,103 (reported on 9.3% of returns)
71291:
$13,103
Louisiana:
$16,085
(% of AGI for various income ranges: 2.6% for AGIs below $25k, 2.1% for AGIs $25k-50k, 2.4% for AGIs $50k-75k, 1.9% for AGIs $75k-100k, 2.8% for AGIs $100k-200k, 1.7% for AGIs over 200k)
Self-employment retirement plans: $21,350 (reported on 0.3% of returns)
71291:
$21,350
Louisiana:
$25,119
Total itemized deductions: $21,334 (20% of AGI, reported on 25.7% of returns)
Here:
$21,334
State:
$23,585
Here:
19.5% of AGI
State:
18.1% of AGI
(% of AGI for various income ranges: 5.7% for AGIs below $25k, 8.3% for AGIs $25k-50k, 9.8% for AGIs $50k-75k, 10.4% for AGIs $75k-100k, 12.3% for AGIs $100k-200k, 11.1% for AGIs over 200k)
Charity contributions: $6,598 (reported on 19.9% of returns)
Here:
$6,598
State:
$5,533
(% of AGI for various income ranges: 0.7% for AGIs below $25k, 1.4% for AGIs $25k-50k, 2.1% for AGIs $50k-75k, 2.4% for AGIs $75k-100k, 3.3% for AGIs $100k-200k, 3.5% for AGIs over 200k)
Taxes paid: $4,768 (reported on 25.4% of returns)
71291:
$4,768
State:
$6,282
(% of AGI for various income ranges: 0.5% for AGIs below $25k, 1.0% for AGIs $25k-50k, 1.6% for AGIs $50k-75k, 2.1% for AGIs $75k-100k, 3.2% for AGIs $100k-200k, 3.6% for AGIs over 200k)
Earned income credit: $2,400 (reported on 21.7% of returns)
Here:
$2,400
State:
$2,633
(% of AGI for various income ranges: 8.4% for AGIs below $25k, 1.2% for AGIs $25k-50k)
Percentage of individuals using paid preparers for their 2012 taxes: 57.4%
Here:
57%
State:
57%
(% for various income ranges: 53.7% for AGIs below $25k, 54.0% for AGIs $25k-50k, 59.0% for AGIs $50k-75k, 60.3% for AGIs $75k-100k, 67.9% for AGIs $100k-200k, 83.8% for AGIs over 200k)
Averages for the 2004 tax year for zip code 71291, filed in 2005:
Average Adjusted Gross Income (AGI) in 2004: $41,036 (Individual Income Tax Returns)
Here:
$41,036
State:
$39,411
Salary/wage: $37,579 (reported on 86.1% of returns)
Here:
$37,579
State:
$34,434
(% of AGI for various income ranges: 197.8% for AGIs below $10k, 79.0% for AGIs $10k-25k, 81.3% for AGIs $25k-50k, 83.3% for AGIs $50k-75k, 83.8% for AGIs $75k-100k, 66.6% for AGIs over 100k)
Taxable interest for individuals: $1,610 (reported on 39.1% of returns)
This zip code:
$1,610
Louisiana:
$1,606
(% of AGI for various income ranges: 8.8% for AGIs below $10k, 1.9% for AGIs $10k-25k, 1.5% for AGIs $25k-50k, 1.2% for AGIs $50k-75k, 0.9% for AGIs $75k-100k, 1.7% for AGIs over 100k)
Taxable dividends: $2,101 (reported on 17.9% of returns)
Here:
$2,101
State:
$3,235
(% of AGI for various income ranges: 4.0% for AGIs below $10k, 1.0% for AGIs $10k-25k, 0.7% for AGIs $25k-50k, 0.7% for AGIs $50k-75k, 0.8% for AGIs $75k-100k, 1.2% for AGIs over 100k)
Net capital gain/loss: +$5,125 (reported on 15.0% of returns)
Here:
+$5,125
State:
+$8,531
(% of AGI for various income ranges: -3.0% for AGIs below $10k, 0.3% for AGIs $10k-25k, 0.5% for AGIs $25k-50k, 1.0% for AGIs $50k-75k, 1.5% for AGIs $75k-100k, 4.4% for AGIs over 100k)
Profit/loss from business: +$7,811 (reported on 15.9% of returns)
Here:
+$7,811
State:
+$9,128
(% of AGI for various income ranges: 4.5% for AGIs below $10k, 4.9% for AGIs $10k-25k, 2.3% for AGIs $25k-50k, 2.0% for AGIs $50k-75k, 1.4% for AGIs $75k-100k, 4.4% for AGIs over 100k)
IRA payment deduction: $3,142 (reported on 1.9% of returns)
71291:
$3,142
Louisiana:
$3,055
(% of AGI for various income ranges: 0.2% for AGIs $10k-25k, 0.2% for AGIs $25k-50k, 0.1% for AGIs $50k-75k, 0.1% for AGIs $75k-100k, 0.2% for AGIs over 100k)
Self-employed pension: $11,509 (reported on 0.4% of returns)
Here:
$11,509
Louisiana:
$17,274
(% of AGI for various income ranges: 0.1% for AGIs $10k-25k, 0.0% for AGIs $50k-75k, 0.3% for AGIs over 100k)
Total itemized deductions: $17,890 (22% of AGI, reported on 26.7% of returns)
Here:
$17,890
State:
$18,222
Here:
21.8% of AGI
State:
20.3% of AGI
(% of AGI for various income ranges: 14.3% for AGIs below $10k, 6.4% for AGIs $10k-25k, 9.5% for AGIs $25k-50k, 12.0% for AGIs $50k-75k, 13.7% for AGIs $75k-100k, 13.6% for AGIs over 100k)
Charity contributions deductions: $5,254 (6% of AGI, reported on 23.1% of returns)
Here:
$5,254
State:
$4,190
Here:
6.1% of AGI
State:
4.4% of AGI
(% of AGI for various income ranges: 1.2% for AGIs below $10k, 1.1% for AGIs $10k-25k, 1.8% for AGIs $25k-50k, 2.6% for AGIs $50k-75k, 3.4% for AGIs $75k-100k, 4.5% for AGIs over 100k)
Total tax: $5,856 (reported on 73.0% of returns)
71291:
$5,856
State:
$6,529
(% of AGI for various income ranges: 6.8% for AGIs below $10k, 3.7% for AGIs $10k-25k, 6.5% for AGIs $25k-50k, 8.4% for AGIs $50k-75k, 10.1% for AGIs $75k-100k, 17.4% for AGIs over 100k)
Earned income credit: $1,942 (reported on 20.3% of returns)
Here:
$1,942
State:
$2,103
Percentage of individuals using paid preparers for their 2004 taxes: 61.6%
Here:
62%
State:
61%
(% for various income ranges: 56.5% for AGIs below $10k, 64.4% for AGIs $10k-25k, 60.5% for AGIs $25k-50k, 61.1% for AGIs $50k-75k, 60.6% for AGIs $75k-100k, 70.9% for AGIs over 100k)
Likely homosexual households (counted as self-reported same-sex unmarried-partner households)
Lesbian couples: 0.0% of all households
Gay men: 0.1% of all households
Household received Food Stamps/SNAP in the past 12 months: 1,699 Household did not receive Food Stamps/SNAP in the past 12 months: 12,019
Women who had a birth in the past 12 months: 313 (140 now married, 175 unmarried) Women who did not have a birth in the past 12 months: 7,947 (3,767 now married, 4,150 unmarried)
Housing units in zip code 71291 with a mortgage: 4,871 (458 second mortgage, 28 home equity loan, 350 both second mortgage and home equity loan) Houses without a mortgage: 202
Median monthly owner costs for units with a mortgage: $1,368 Median monthly owner costs for units without a mortgage: $450
Residents with income below the poverty level in 2022:
This zip code:
13.8%
Whole state:
18.6%
Residents with income below 50% of the poverty level in 2022:
This zip code:
5.5%
Whole state:
10.1%
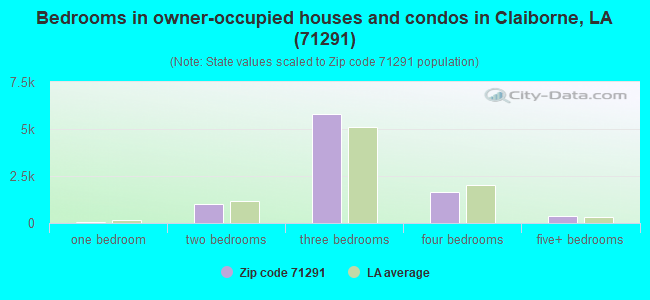
Median number of rooms in houses and condos:
Here:
6.5
State:
6.2
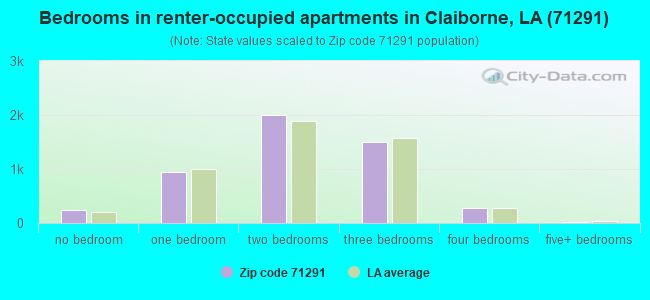
Median number of rooms in apartments:
Here:
4.6
State:
4.4
Notable locations in this zip code not listed on our city pages
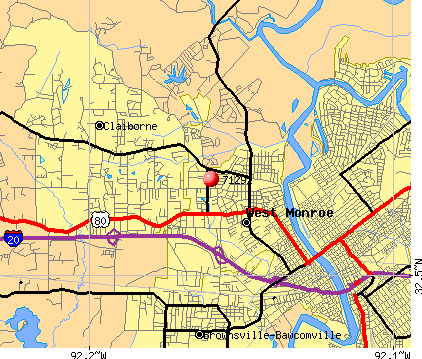
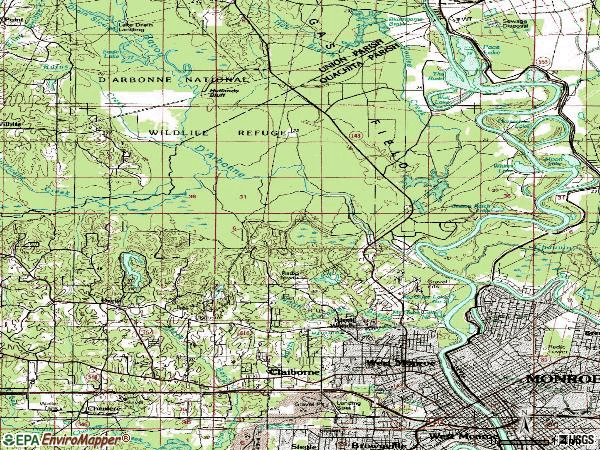
Notable locations in zip code 71291: Highland Park Golf Course (A), Lonewa Landing (B), River Styx Landing (C), Smith Landing (D), Trenton Landing (E), Upper Paragoud Landing (F), Ouachita Valley Public Library (G), West Monroe City Hall (H), West Monroe Convention Center (I), West Monroe Public Library (J), Ouachita Parish Fire Protection District 1 Station 6 Cheniere (K), Ouachita Parish Fire Protection District 1 Station 2 Wallace (L), West Monroe Fire Department (M). Display/hide their locations on the map
Shopping Centers: Glenwood Mall Shopping Center (1), Sunshine Heights Shopping Center (2), West Gate Shopping Center (3). Display/hide their locations on the map
Churches in zip code 71291 include: Camp Road Church (A), Chapel Hill Church (B), Goodhope Baptist Church (C), Fair Park Baptist Church (D), Dean Chapel (E), Mount Horeb Church (F), Claiborne Assembly of God Church (G), Claiborne United Methodist Church (H), Community Baptist Church (I). Display/hide their locations on the map
Lakes: Whites Lake (A), McGuire Lake Number Two (B), McGuire Lake Number One (C), Cotton Patch Lake (D), Wall Lake (E). Display/hide their locations on the map
In group quarters: 395 (-1 institutionalized population)
Size of family households: 4,606 2-persons, 2,392 3-persons, 1,636 4-persons, 451 5-persons, 147 6-persons, 80 7-or-more-persons
Size of nonfamily households: 3,494 1-person, 963 2-persons, 83 3-persons
4,855 married couples with children.
1,555 single-parent households (512 men, 1,043 women).
96.3% of residents of 71291 zip code speak English at home.
1.8% of residents speak Spanish at home (37% very well, 6% well, 17% not well, 41% not at all).
1.8% of residents speak other Indo-European language at home (71% very well, 12% well, 16% not well).
0.4% of residents speak Asian or Pacific Island language at home (83% very well, 17% well).
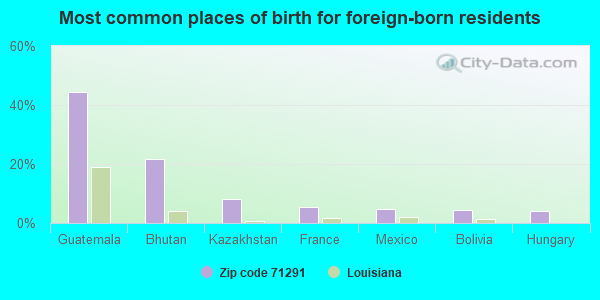
Foreign born population: 838 (2.4%) (53.1% of them are naturalized citizens)
Major facilities with environmental interests located in this zip code:
GOOD HOPE MIDDLE SCHOOL (400 GOOD HOPE ROAD in WEST MONROE, LA)
(National Center for Education Statistics) - STATE ID-037053 National Pollutant Discharge Elimination System NON-MAJOR (Tracking pollutant discharge elimination systems) - permit Organizations: OUACHITA PARISH SCHOOL BOARD (SCHOOL DISTRICT)
GREATER OUACHITA WATER COMPANY (COUNTRY ESTATES WELL in WEST MONROE, LA)
National Pollutant Discharge Elimination System NON-MAJOR (Tracking pollutant discharge elimination systems) - permit National Pollutant Discharge Elimination System NON-MAJOR (Tracking pollutant discharge elimination systems) - permit National Pollutant Discharge Elimination System NON-MAJOR (Tracking pollutant discharge elimination systems) - permit Business SIC classification: SEWERAGE SYSTEMS Alternative names: COUNTRY HERITAGE ESTATES, GRACE UTILITIES, GRACE UTILITIES-COUNTRY ES, GREATER OUACHITA WATER CO - CO, OUACHITA PAR POLICE JURY, QUACHITA PARISH POLICE JURY
GEORGE WELCH ELEMENTARY SCHOOL (199 CALDWELL ROAD in WEST MONROE, LA)
(Geographic Names Information System) (National Center for Education Statistics) - STATE ID-037047 Organizations: OUACHITA PARISH SCHOOL BOARD (SCHOOL DISTRICT)
HIGHLAND ELEMENTARY SCHOOL (1501 WELLERMAN ROAD in WEST MONROE, LA)
(Geographic Names Information System) (National Center for Education Statistics) - STATE ID-037010 Organizations: OUACHITA PARISH SCHOOL BOARD (SCHOOL DISTRICT)
GREEN ACRES SUBDIVISION WATER SYSTEM - LA1073016 (2800 NORTH 7TH in WEST MONROE, LA)
(Integrated Compliance Information System) - ICIS-06-2003-1267, FORMAL ENFORCEMENT ACTION, COMMUNITY WATER SYSTEM (SDWIS) Alternative names: GREEN ACRES SUBD. W.S.
PINE BAYOU WATER SYSTEM (2800 NORTH 7TH STREET in WEST MONROE, LA)
(Integrated Compliance Information System) - ICIS-06-2003-1269, FORMAL ENFORCEMENT ACTION, COMMUNITY WATER SYSTEM (SDWIS) Alternative names: PINE BAYOU WATER SYSTEM - LA1073038
HILLSIDE PARK SUBDIVISION WATER SYSTEM - LA1073064 (2800 NORTH 7TH in WEST MONROE, LA)
(Integrated Compliance Information System) - ICIS-06-2003-1272, FORMAL ENFORCEMENT ACTION, COMMUNITY WATER SYSTEM (SDWIS) Alternative names: HILLSIDE PARK SUBD. WS
RICHLAND HEIGHTS SUBDIVISION WATER SYSTEM LA1083015 (2800 NORTH 7TH in WEST MONROE, LA)
(Integrated Compliance Information System) - ICIS-06-2003-1278, FORMAL ENFORCEMENT ACTION COMMUNITY WATER SYSTEM (SDWIS) Alternative names: RICHLAND HEIGHTS SUB W S
PARADISE POINT WATER SYS (2800 NORTH 7TH STREET in WEST MONROE, LA)
(Integrated Compliance Information System) - ICIS-06-2003-1250, FORMAL ENFORCEMENT ACTION, ICIS-06-2003-1258, ICIS-06-2003-1250, COMMUNITY WATER SYSTEM (SDWIS)
BANCROFT PAPER BAG (425 BANCROFT RD in WEST MONROE, LA)
AIR MAJOR (AIRS/AFS) CRITERIA AND HAZARDOUS AIR POLLUTANT INVENTORY (Inventory of air pollution sources) National Pollutant Discharge Elimination System NON-MAJOR (Tracking pollutant discharge elimination systems) - permit Conditionally Exempt Small Quantity Generators, less than 100 kg/month of hazardous waste (Resource Conservation and Recovery Act (tracking hazardous waste)) - notification TRI REPORTER (Tracking of toxic chemicals releasing facilities) Business SIC classification: PLASTICS, FOIL, AND COATED PAPER BAGS Business NAICS classification: PLASTICS, FOIL, AND COATED PAPER BAG MANUFACTURING. Organizations: BANCROFT BAG INC (CONTACT/OWNER)
Alternative names: BANCROFT BAG INC, BANCROFT BOG, INC., BANCROFTBAG, FRED DONISI
103 TRUCK STOP INC W S (4007 WHITES FERRY RD in WEST MONROE, LA)
(Integrated Compliance Information System) - ICIS-06-1990-0301, FORMAL ENFORCEMENT ACTION Business SIC classification: GASOLINE SERVICE STATIONS
MONROE SAND & GRAVEL (HWY 32 in WEST MONROE, LA)
(Integrated Compliance Information System) - ICIS-06-1987-0055, FORMAL ENFORCEMENT ACTION
GEORGIA PAC PKG DIV (400 CENTRAL AVE in WEST MONROE, LA)
AIR MINOR (AIRS/AFS) Business SIC classification: CORRUGATED AND SOLID FIBER BOXES Alternative names: GEORGIA PACIFIC packaging division, JAY JACKSON
Housing units lacking complete plumbing facilities: 5.2% Housing units lacking complete kitchen facilities: 4.7%
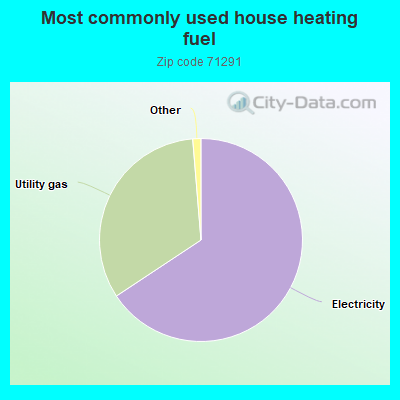
65.7%Electricity
33.0%Utility gas
Population in 1990: 27,809. Population change in the 1990s: +3,254 (+11.7%).
Place of birth for U.S.-born residents:
This state: 24,921
Northeast: 493
Midwest: 1,080
South: 5,719
West: 1,036
55% of the 71291 zip code residents lived in the same house 5 years ago. Out of people who lived in different houses, 66% lived in this county. Out of people who lived in different counties, 50% lived in Louisiana.
89% of the 71291 zip code residents lived in the same house 1 year ago. Out of people who lived in different houses, 57% moved from this county. Out of people who lived in different houses, 22% moved from different county within same state. Out of people who lived in different houses, 14% moved from different state. Out of people who lived in different houses, 7% moved from abroad.
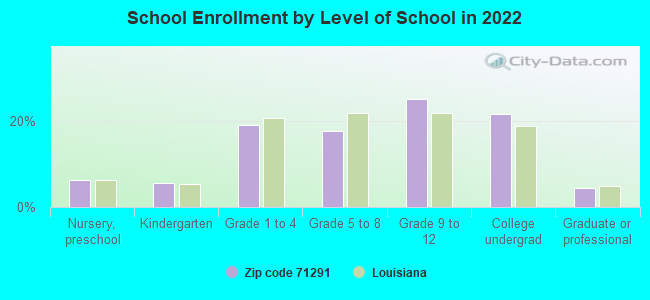
Private vs. public school enrollment:
Students in private schools in grades 1 to 8 (elementary and middle school): 246
Here:
9.0%
Louisiana:
19.6%
Students in private schools in grades 9 to 12 (high school): 225
Here:
12.0%
Louisiana:
18.3%
Students in private undergraduate colleges: 361
Here:
22.1%
Louisiana:
17.4%
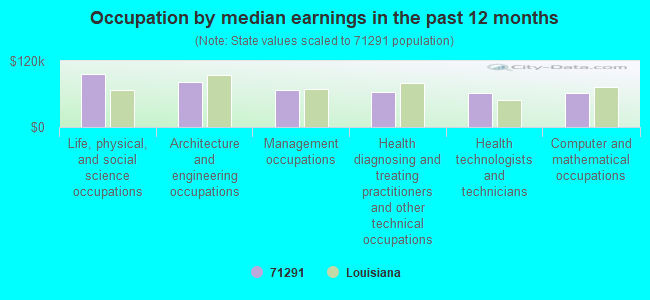
Occupation by median earnings in the past 12 months ($)
95,630Life, physical, and social science occupations
81,867Architecture and engineering occupations
67,088Management occupations
64,544Health diagnosing and treating practitioners and other technical occupations
62,304Health technologists and technicians
61,518Computer and mathematical occupations
Companies with federal contracts located in this zip code:
CHEEKS ELECTRIC INC (1005 CROSLEY ST in WEST MONROE, LA; small business) : $6,068 in 2 contractsin 2004
$3,034 with Army for Maintenance, Repair and Rebuilding of Equipment -- Refrigeration, Air Conditioning, and Air Circulating Equipment. Signed on 2004-05-24. Completion date: 2004-05-26.
$3,034 with U.S. Army Corps of Engineers - civil program financing only for Maintenance, Repair and Rebuilding of Equipment -- Refrigeration, Air Conditioning, and Air Circulating Equipment. Signed on 2004-05-24. Completion date: 2004-05-26.
SEVEN INTERNET STORES, INC (131 GREENBRIAR DR in WEST MONROE, LA; small business) : $0 in 2 contractsin 2005
$3,839 with Army for Miscellaneous Weapons. Taking place in CA. Signed on 2005-09-28. Completion date: 2005-10-05.
-$3,839, same as above.Signed on 2005-09-30. Completion date: 2005-10-05.
Top industries in this zip code by the number of employees in 2005:
2002 - 2018 National Fire Incident Reporting System (NFIRS) incidents
Based on the data from the years 2002 - 2018 the average number of fire incidents per year is 172. The highest number of reported fires - 256 took place in 2011, and the least - 92 in 2007. The data has a rising trend.
When looking into fire subcategories, the most incidents belonged to: Outside Fires (53.1%), and Structure Fires (30.6%).
Fire incident types reported to NFIRS in Zip Code 71291
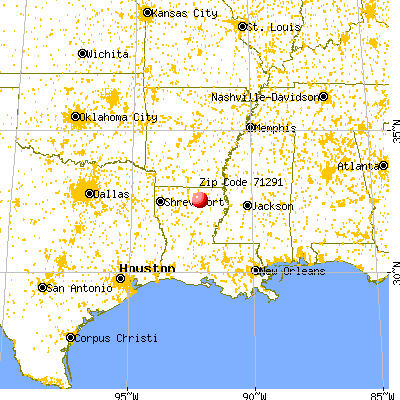


 Nearest zip codes: 71201, 71209, 71203, 71280, 71292, 71225.
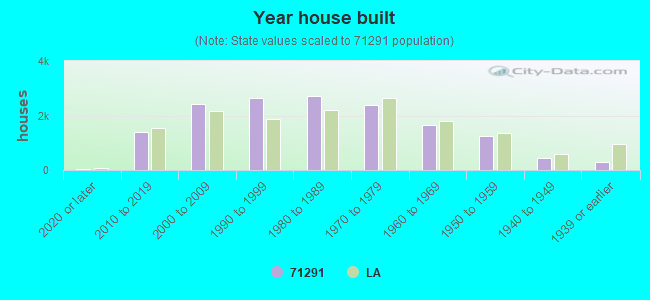


 Based on the data from the years 2002 - 2018 the average number of fire incidents per year is 172. The highest number of reported fires - 256 took place in 2011, and the least - 92 in 2007. The data has a rising trend.
 When looking into fire subcategories, the most incidents belonged to: Outside Fires (53.1%), and Structure Fires (30.6%).