Estimated zip code population in 2022: 1,901 Zip code population in 2010: 2,197 Zip code population in 2000: 1,724
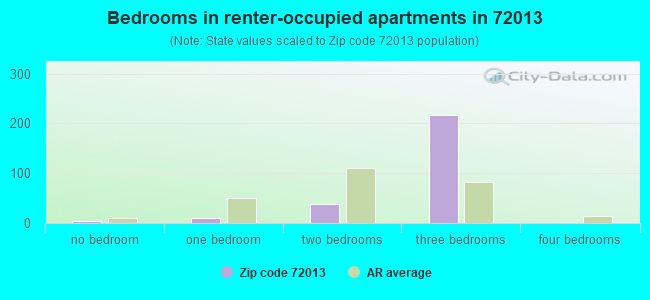
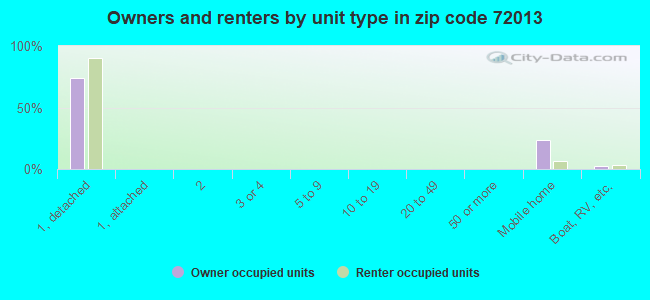
Houses and condos: 1,013 Renter-occupied apartments: 284
% of renters here:
34%
State:
34%
March 2022 cost of living index in zip code 72013: 76.2 (low, U.S. average is 100)
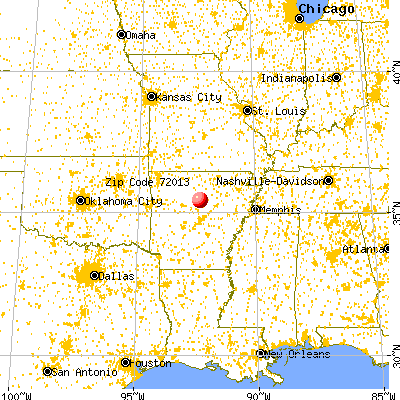
Land area: 97.8 sq. mi. Water area: 1.7 sq. mi.
Population density: 19 people per square mile
(very low).
OSM Map
General Map
Google Map
MSN Map
OSM Map
General Map
Google Map
MSN Map
OSM Map
General Map
Google Map
MSN Map
OSM Map
General Map
Google Map
MSN Map
Please wait while loading the map...
Real estate property taxes paid for housing units in 2022:
This zip code:
0.5% ($723)
Arkansas:
0.5% ($977)
Median real estate property taxes paid for housing units with mortgages in 2022: $909 (0.5%) Median real estate property taxes paid for housing units with no mortgage in 2022: $612 (0.4%)
Business Search- 14 Million verified businesses
Males: 992
(52.2%)
Females: 909
(47.8%)
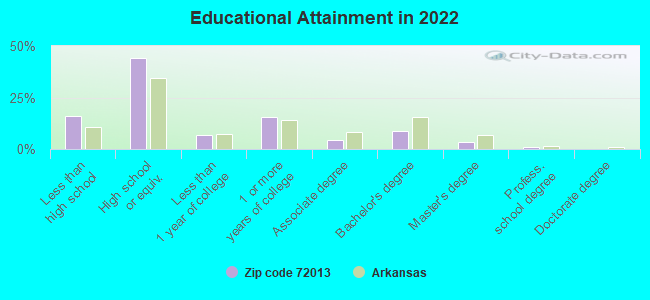
For population 25 years and over in 72013:
High school or higher: 83.1%
Bachelor's degree or higher: 13.1%
Graduate or professional degree: 4.6%
Unemployed: 2.6%
Mean travel time to work (commute): 48.7 minutes
For population 15 years and over in 72013:
Never married: 21.6%
Now married: 55.5%
Separated: 2.6%
Widowed: 9.2%
Divorced: 11.0%
Zip code 72013 compared to state average:
Unemployed percentage below state average.
Black race population percentage significantly below state average.
Hispanic race population percentage significantly below state average.
Median age significantly above state average.
Foreign-born population percentage significantly below state average.
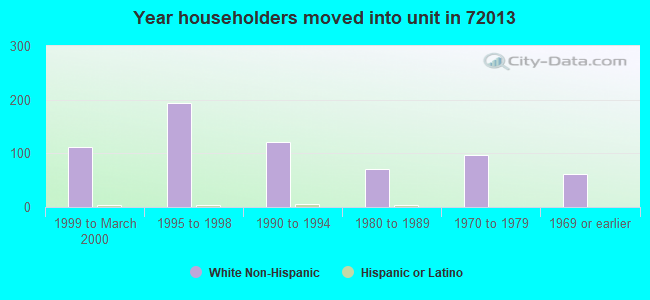
Length of stay since moving in significantly above state average.
Number of college students significantly below state average.
Percentage of population with a bachelor's degree or higher below state average.
Averages for the 2020 tax year for zip code 72013, filed in 2021:
Average Adjusted Gross Income (AGI) in 2020: $47,173 (Individual Income Tax Returns)
Here:
$47,173
State:
$64,872
Salary/wage: $44,115 (reported on 77.9% of returns)
Here:
$44,115
State:
$50,644
(% of AGI for various income ranges: 1109.6% for AGIs below $25k, 3547.1% for AGIs $25k-50k, 6605.0% for AGIs $50k-75k, 9280.0% for AGIs $75k-100k, 22290.0% for AGIs $100k-200k)
Taxable interest for individuals: $848 (reported on 29.9% of returns)
This zip code:
$848
Arkansas:
$1,857
(% of AGI for various income ranges: 19.2% for AGIs below $25k, 44.3% for AGIs $25k-50k, 51.2% for AGIs $50k-75k, 12.0% for AGIs $75k-100k, 100.0% for AGIs $100k-200k)
Ordinary dividends: $1,190 (reported on 13.0% of returns)
Here:
$1,190
State:
$21,681
(% of AGI for various income ranges: 12.1% for AGIs below $25k, 35.7% for AGIs $25k-50k, 80.0% for AGIs $75k-100k)
Net capital gain/loss in AGI: +$2,560 (reported on 13.0% of returns)
Here:
+$2,560
State:
+$22,815
(% of AGI for various income ranges: 98.6% for AGIs $25k-50k, 45.0% for AGIs $50k-75k, 220.0% for AGIs $100k-200k)
Profit/loss from business: +$5,636 (reported on 18.2% of returns)
Here:
+$5,636
State:
+$9,743
(% of AGI for various income ranges: 120.4% for AGIs below $25k, 226.4% for AGIs $25k-50k, 190.0% for AGIs $50k-75k, 77.5% for AGIs $100k-200k)
Taxable individual retirement arrangement distribution: $10,300 (reported on 7.8% of returns)
72013:
$10,300
Arkansas:
$18,502
(% of AGI for various income ranges: 120.4% for AGIs below $25k, 411.2% for AGIs $50k-75k)
Taxes paid: $7,400 (reported on 2.6% of returns)
72013:
$7,400
State:
$7,196
(% of AGI for various income ranges: 185.0% for AGIs $50k-75k)
Earned income credit: $2,524 (reported on 22.1% of returns)
Here:
$2,524
State:
$2,546
(% of AGI for various income ranges: 121.7% for AGIs below $25k, 97.9% for AGIs $25k-50k)
Percentage of individuals using paid preparers for their 2020 taxes: 97.4%
Here:
97%
State:
94%
(% for various income ranges: 96.8% for AGIs below $25k, 94.7% for AGIs $25k-50k, 100.0% for AGIs $50k-75k, 100.0% for AGIs $75k-100k, 100.0% for AGIs $100k-200k)
Averages for the 2012 tax year for zip code 72013, filed in 2013:
Average Adjusted Gross Income (AGI) in 2012: $48,727 (Individual Income Tax Returns)
Here:
$48,727
State:
$52,148
Salary/wage: $36,463 (reported on 74.7% of returns)
Here:
$36,463
State:
$41,669
(% of AGI for various income ranges: 63.4% for AGIs below $25k, 66.9% for AGIs $25k-50k, 65.8% for AGIs $50k-75k, 56.3% for AGIs $75k-100k, 41.4% for AGIs $100k-200k)
Taxable interest for individuals: $745 (reported on 36.7% of returns)
This zip code:
$745
Arkansas:
$1,648
(% of AGI for various income ranges: 1.1% for AGIs below $25k, 0.5% for AGIs $25k-50k, 0.5% for AGIs $50k-75k, 0.6% for AGIs $75k-100k, 0.5% for AGIs $100k-200k)
Ordinary dividends: $964 (reported on 13.9% of returns)
Here:
$964
State:
$20,675
(% of AGI for various income ranges: 0.7% for AGIs below $25k, 0.5% for AGIs $50k-75k, 0.3% for AGIs $100k-200k)
Net capital gain/loss in AGI: +$5,488 (reported on 10.1% of returns)
Here:
+$5,488
State:
+$15,222
Profit/loss from business: +$9,421 (reported on 17.7% of returns)
Here:
+$9,421
State:
+$9,665
(% of AGI for various income ranges: 10.5% for AGIs below $25k, 2.5% for AGIs $25k-50k, 2.8% for AGIs $50k-75k, 8.5% for AGIs $75k-100k)
Taxable individual retirement arrangement distribution: $6,583 (reported on 7.6% of returns)
72013:
$6,583
Arkansas:
$13,644
Total itemized deductions: $20,584 (22% of AGI, reported on 24.1% of returns)
Here:
$20,584
State:
$23,276
Here:
21.6% of AGI
State:
19.1% of AGI
(% of AGI for various income ranges: 8.0% for AGIs below $25k, 7.5% for AGIs $25k-50k, 10.0% for AGIs $50k-75k, 9.0% for AGIs $75k-100k, 12.9% for AGIs $100k-200k)
Charity contributions: $5,031 (reported on 16.5% of returns)
Here:
$5,031
State:
$5,996
(% of AGI for various income ranges: 1.5% for AGIs $25k-50k, 2.9% for AGIs $50k-75k, 2.3% for AGIs $100k-200k)
Taxes paid: $6,437 (reported on 24.1% of returns)
72013:
$6,437
State:
$7,941
(% of AGI for various income ranges: 1.1% for AGIs below $25k, 1.2% for AGIs $25k-50k, 2.8% for AGIs $50k-75k, 3.2% for AGIs $75k-100k, 5.1% for AGIs $100k-200k)
Earned income credit: $2,250 (reported on 22.8% of returns)
Here:
$2,250
State:
$2,455
(% of AGI for various income ranges: 8.4% for AGIs below $25k, 1.2% for AGIs $25k-50k)
Percentage of individuals using paid preparers for their 2012 taxes: 74.7%
Here:
75%
State:
61%
(% for various income ranges: 67.7% for AGIs below $25k, 73.7% for AGIs $25k-50k, 78.6% for AGIs $50k-75k, 85.7% for AGIs $75k-100k, 87.5% for AGIs $100k-200k)
Averages for the 2004 tax year for zip code 72013, filed in 2005:
Average Adjusted Gross Income (AGI) in 2004: $28,732 (Individual Income Tax Returns)
Here:
$28,732
State:
$39,270
Salary/wage: $27,974 (reported on 81.1% of returns)
Here:
$27,974
State:
$34,079
(% of AGI for various income ranges: 97.8% for AGIs below $10k, 73.5% for AGIs $10k-25k, 84.8% for AGIs $25k-50k, 80.4% for AGIs $50k-75k, 69.5% for AGIs $75k-100k, 73.7% for AGIs over 100k)
Taxable interest for individuals: $1,152 (reported on 32.8% of returns)
This zip code:
$1,152
Arkansas:
$1,904
(% of AGI for various income ranges: 10.7% for AGIs below $10k, 2.5% for AGIs $10k-25k, 0.7% for AGIs $25k-50k, 0.7% for AGIs $50k-75k, 0.5% for AGIs $75k-100k)
Taxable dividends: $561 (reported on 11.6% of returns)
Here:
$561
State:
$5,995
(% of AGI for various income ranges: 0.6% for AGIs below $10k, 0.5% for AGIs $10k-25k, 0.2% for AGIs $25k-50k, 0.2% for AGIs $50k-75k)
Net capital gain/loss: +$1,632 (reported on 12.3% of returns)
Here:
+$1,632
State:
+$10,430
Profit/loss from business: +$6,185 (reported on 18.4% of returns)
Here:
+$6,185
State:
+$7,823
(% of AGI for various income ranges: 20.7% for AGIs below $10k, 7.8% for AGIs $10k-25k, 2.5% for AGIs $25k-50k, 3.9% for AGIs $50k-75k)
IRA payment deduction: $2,733 (reported on 2.1% of returns)
72013:
$2,733
Arkansas:
$3,204
Total itemized deductions: $15,718 (30% of AGI, reported on 17.6% of returns)
Here:
$15,718
State:
$18,389
Here:
30.2% of AGI
State:
21.0% of AGI
(% of AGI for various income ranges: 7.5% for AGIs $10k-25k, 9.3% for AGIs $25k-50k, 12.4% for AGIs $50k-75k, 17.3% for AGIs $75k-100k)
Charity contributions deductions: $2,820 (5% of AGI, reported on 14.2% of returns)
Here:
$2,820
State:
$4,725
Here:
5.4% of AGI
State:
5.1% of AGI
(% of AGI for various income ranges: 0.9% for AGIs $10k-25k, 1.1% for AGIs $25k-50k, 2.0% for AGIs $50k-75k, 2.9% for AGIs $75k-100k)
Total tax: $2,950 (reported on 65.5% of returns)
72013:
$2,950
State:
$6,047
(% of AGI for various income ranges: 3.3% for AGIs below $10k, 3.8% for AGIs $10k-25k, 5.3% for AGIs $25k-50k, 7.4% for AGIs $50k-75k, 10.2% for AGIs $75k-100k, 14.1% for AGIs over 100k)
Earned income credit: $1,970 (reported on 28.1% of returns)
Here:
$1,970
State:
$1,909
Percentage of individuals using paid preparers for their 2004 taxes: 72.3%
Here:
72%
State:
67%
(% for various income ranges: 66.2% for AGIs below $10k, 75.5% for AGIs $10k-25k, 71.4% for AGIs $25k-50k, 71.4% for AGIs $50k-75k, 118.8% for AGIs $75k-100k)
Household received Food Stamps/SNAP in the past 12 months: 20 Household did not receive Food Stamps/SNAP in the past 12 months: 829
Women who had a birth in the past 12 months: 61 (32 now married, 28 unmarried) Women who did not have a birth in the past 12 months: 315 (162 now married, 153 unmarried)
Housing units in zip code 72013 with a mortgage: 299 (27 second mortgage, 8 both second mortgage and home equity loan) Median monthly owner costs for units with a mortgage: $1,147 Median monthly owner costs for units without a mortgage: $380
Residents with income below the poverty level in 2022:
This zip code:
13.0%
Whole state:
16.8%
Residents with income below 50% of the poverty level in 2022:
This zip code:
10.3%
Whole state:
8.5%
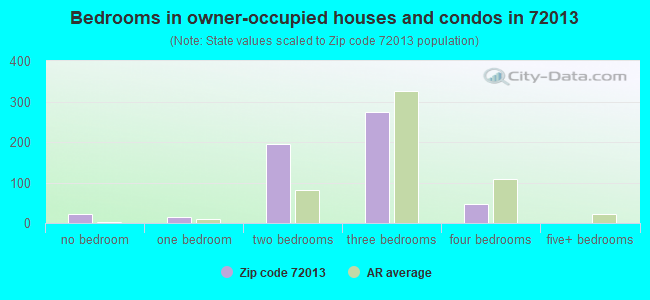
Median number of rooms in houses and condos:
Here:
5.4
State:
6.1
Median number of rooms in apartments:
Here:
5.6
State:
4.3
Notable locations in this zip code not listed on our city pages
Notable locations in zip code 72013: Bee Branch Volunteer Fire Department (A), Morganton Volunteer Fire Department (B). Display/hide their locations on the map
Churches in zip code 72013 include: Bethlehem Church (A), Parish Chapel (B), Bee Branch Baptist Church (C), Mount Zion Church (D), Steele Hopewell United Methodist Church (E), Pine Mountain Church (F), Pleasant Valley Church (G), Colony Church of Christ (H), Rabbit Ridge Church (I). Display/hide their locations on the map
Streams, rivers, and creeks: Little Creek (A), Linn Creek (B), Kill Dead Creek (C), Grassy Creek (D), Wild Goose Branch (E), Duke Creek (F), Scroggins Creek (G), Bee Branch (H). Display/hide their locations on the map
Size of family households: 413 2-persons, 166 3-persons, 50 4-persons, 21 5-persons, 4 6-persons
Size of nonfamily households: 182 1-person, 5 2-persons
193 married couples with children.
28 single-parent households (28 men).
99.5% of residents of 72013 zip code speak English at home.
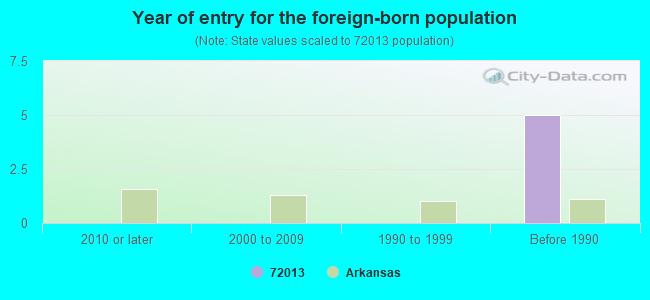
Foreign born population: 0 (0.0%)
:
0.0%
Whole state:
5.1%
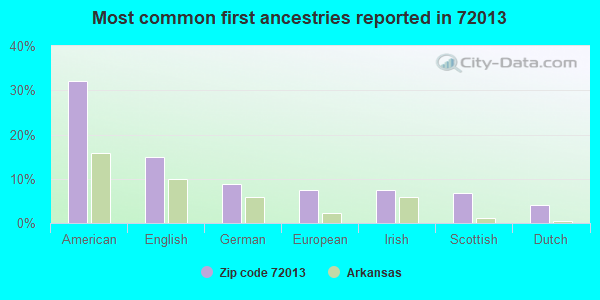
32%American
15%English
9%German
7%European
7%Irish
7%Scottish
4%Dutch
Year of entry for the foreign-born population
02010 or later
02000 to 2009
01990 to 1999
5Before 1990
Facilities with environmental interests located in this zip code:
CADRON CREEK CATFISH HOUSE (HWY 65 & HWY 92, VAN BUREN CO. in BEE BRANCH, AR)
National Pollutant Discharge Elimination System NON-MAJOR (Tracking pollutant discharge elimination systems) - permit STATE MASTER (PDS) - WATER-AR0047457, National Pollutant Discharge Elimination System Permit Business SIC classification: EATING PLACES
SOUTH SIDE ELEMENTARY SCHOOL (334 SOUTHSIDE ROAD in BEE BRANCH, AR)
(Geographic Names Information System) (National Center for Education Statistics) - STATE ID-7105018
SOUTH SIDE HIGH SCHOOL (334 SOUTHSIDE ROAD in BEE BRANCH, AR)
(Geographic Names Information System) (National Center for Education Statistics) - STATE ID-7105019
Housing units lacking complete plumbing facilities: 3.9% Housing units lacking complete kitchen facilities: 4.0%
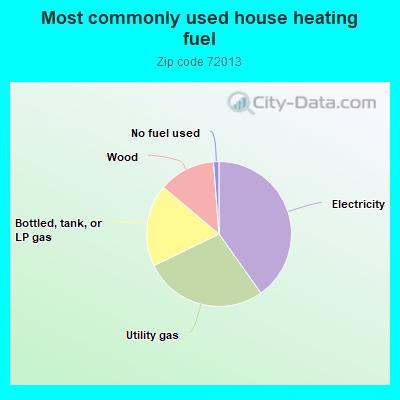
40.3%Electricity
27.7%Utility gas
18.4%Bottled, tank, or LP gas
12.7%Wood
1.2%No fuel used
Population in 1990: 1,344. Population change in the 1990s: +380 (+28.3%).
Place of birth for U.S.-born residents:
This state: 1,252
Northeast: 74
Midwest: 211
South: 233
West: 117
59% of the 72013 zip code residents lived in the same house 5 years ago. Out of people who lived in different houses, 39% lived in this county. Out of people who lived in different counties, 50% lived in Arkansas.
100% of the 72013 zip code residents lived in the same house 1 year ago. Out of people who lived in different houses, 700% moved from this county.
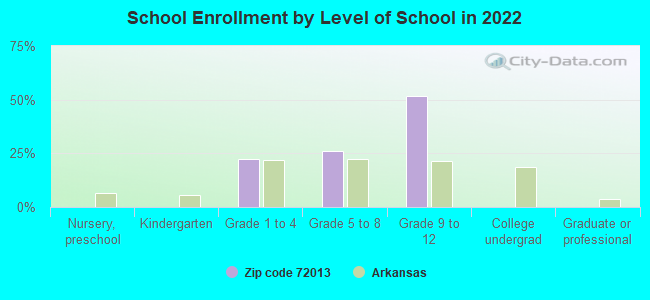
Private vs. public school enrollment:
Students in private schools in grades 1 to 8 (elementary and middle school): 17
Here:
22.9%
Arkansas:
10.5%
Students in private schools in grades 9 to 12 (high school): 16
Here:
20.6%
Arkansas:
8.7%
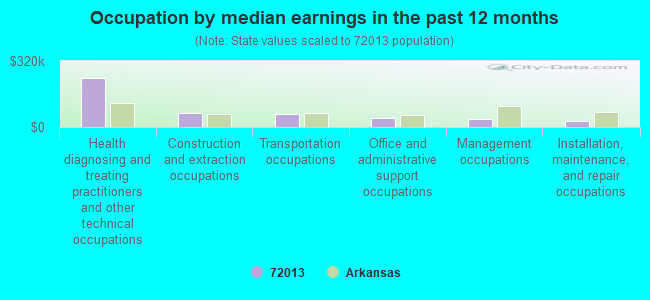
Occupation by median earnings in the past 12 months ($)
239,238Health diagnosing and treating practitioners and other technical occupations
66,970Construction and extraction occupations
63,253Transportation occupations
43,119Office and administrative support occupations
40,294Management occupations
28,393Installation, maintenance, and repair occupations
Top industries in this zip code by the number of employees in 2005:
Construction: Structural Steel and Precast Concrete Contractors (5-9: 1)
Construction: Site Preparation Contractors (5-9: 1)
Construction: Plumbing, Heating, and Air-Conditioning Contractors (1-4: 3)
Construction: Commercial and Institutional Building Construction (1-4: 2)
Finance and Insurance: Commercial Banking (1-4: 1)
Fatal accident statistics in 2014:
Fatal accident count: 1
Vehicles involved in fatal accidents: 1
Fatal accidents caused by drunken drivers: 1
Fatalities: 1
Persons involved in fatal accidents: 1
Pedestrians involved in fatal accidents: 0
Fatal accident statistics in 2012:
Fatal accident count: 2
Vehicles involved in fatal accidents: 2
Fatal accidents caused by drunken drivers: 1
Fatalities: 2
Persons involved in fatal accidents: 3
Pedestrians involved in fatal accidents: 0
2003 - 2018 National Fire Incident Reporting System (NFIRS) incidents
According to the data from the years 2003 - 2018 the average number of fire incidents per year is 20. The highest number of reported fire incidents - 58 took place in 2014, and the least - 2 in 2006. The data has a rising trend.
When looking into fire subcategories, the most incidents belonged to: Outside Fires (50.6%), and Structure Fires (37.6%).
Fire incident types reported to NFIRS in Zip Code 72013


 Nearest zip codes: 72039, 72061, 72088, 72131, 72153, 72058.


 According to the data from the years 2003 - 2018 the average number of fire incidents per year is 20. The highest number of reported fire incidents - 58 took place in 2014, and the least - 2 in 2006. The data has a rising trend.
 When looking into fire subcategories, the most incidents belonged to: Outside Fires (50.6%), and Structure Fires (37.6%).