Estimated zip code population in 2022: 12,208 Zip code population in 2010: 10,344 Zip code population in 2000: 9,784
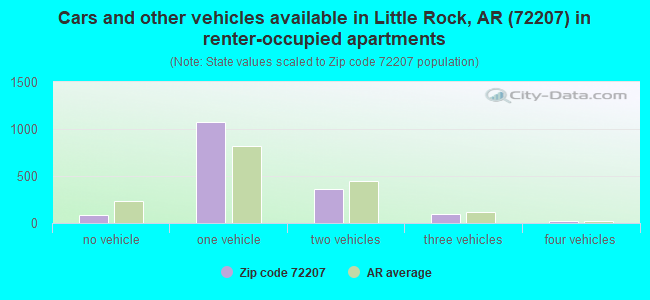
Houses and condos: 6,324 Renter-occupied apartments: 1,648
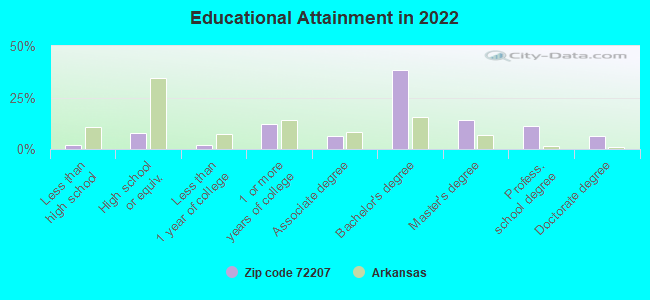
% of renters here:
29%
State:
34%
March 2022 cost of living index in zip code 72207: 85.8 (less than average, U.S. average is 100)
Land area: 3.1 sq. mi. Water area: 0.0 sq. mi.
Population density: 3,997 people per square mile
(average).
OSM Map
General Map
Google Map
MSN Map
OSM Map
General Map
Google Map
MSN Map
OSM Map
General Map
Google Map
MSN Map
OSM Map
General Map
Google Map
MSN Map
Please wait while loading the map...
Real estate property taxes paid for housing units in 2022:
This zip code:
0.7% ($2,988)
Arkansas:
0.5% ($977)
Median real estate property taxes paid for housing units with mortgages in 2022: $3,462 (0.8%) Median real estate property taxes paid for housing units with no mortgage in 2022: $2,686 (0.7%)
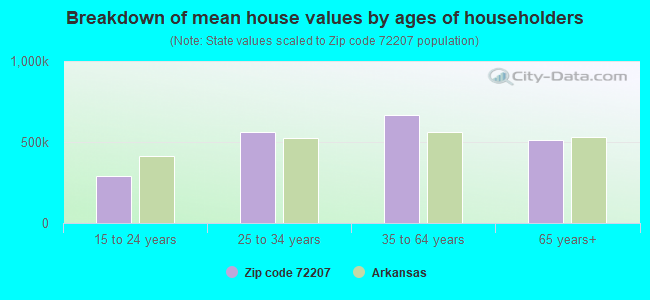
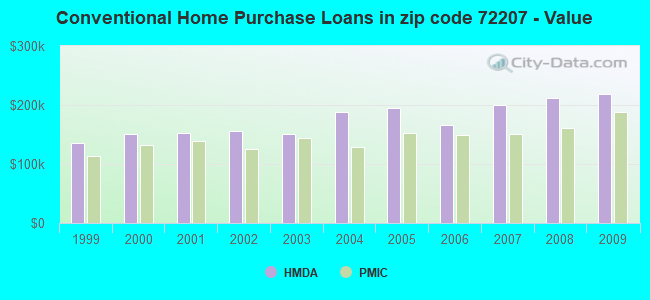
Estimated median house/condo value in 2022: $424,479
72207:
$424,479
Arkansas:
$179,800
According to our research of Arkansas and other state lists, there were 4 registered sex offenders living in 72207 zip code as of April 27, 2024. The ratio of all residents to sex offenders in zip code 72207 is 2,644 to 1. The ratio of registered sex offenders to all residents in this zip code is much lower than the state average.
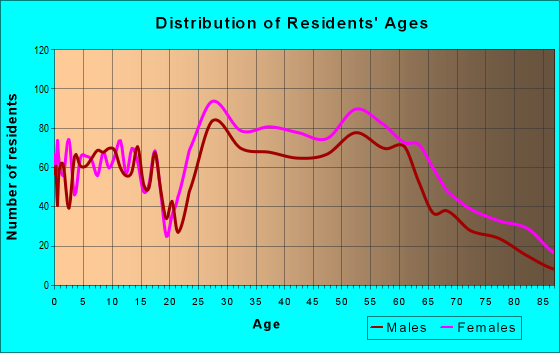
Median resident age:
This zip code:
40.7 years
Arkansas median age:
38.9 years
Average household size:
This zip code:
2.1 people
Arkansas:
2.4 people
Averages for the 2020 tax year for zip code 72207, filed in 2021:
Average Adjusted Gross Income (AGI) in 2020: $175,228 (Individual Income Tax Returns)
Here:
$175,228
State:
$64,872
Salary/wage: $127,164 (reported on 77.0% of returns)
Here:
$127,164
State:
$50,644
(% of AGI for various income ranges: 1375.6% for AGIs below $25k, 3945.0% for AGIs $25k-50k, 6918.8% for AGIs $50k-75k, 10261.5% for AGIs $75k-100k, 20295.5% for AGIs $100k-200k, 121304.5% for AGIs over 200k)
Taxable interest for individuals: $4,403 (reported on 49.1% of returns)
This zip code:
$4,403
Arkansas:
$1,857
(% of AGI for various income ranges: 25.3% for AGIs below $25k, 52.3% for AGIs $25k-50k, 116.8% for AGIs $50k-75k, 188.5% for AGIs $75k-100k, 288.8% for AGIs $100k-200k, 3069.0% for AGIs over 200k)
Ordinary dividends: $29,040 (reported on 41.6% of returns)
Here:
$29,040
State:
$21,681
(% of AGI for various income ranges: 91.6% for AGIs below $25k, 180.3% for AGIs $25k-50k, 336.5% for AGIs $50k-75k, 613.5% for AGIs $75k-100k, 1318.2% for AGIs $100k-200k, 18762.8% for AGIs over 200k)
Net capital gain/loss in AGI: +$48,726 (reported on 38.4% of returns)
Here:
+$48,726
State:
+$22,815
(% of AGI for various income ranges: 40.9% for AGIs below $25k, 105.5% for AGIs $25k-50k, 199.0% for AGIs $50k-75k, 424.2% for AGIs $75k-100k, 1342.8% for AGIs $100k-200k, 31600.7% for AGIs over 200k)
Profit/loss from business: +$30,420 (reported on 20.0% of returns)
Here:
+$30,420
State:
+$9,743
(% of AGI for various income ranges: 135.9% for AGIs below $25k, 165.2% for AGIs $25k-50k, 349.5% for AGIs $50k-75k, 481.2% for AGIs $75k-100k, 1382.8% for AGIs $100k-200k, 7679.7% for AGIs over 200k)
Taxable individual retirement arrangement distribution: $33,188 (reported on 12.4% of returns)
72207:
$33,188
Arkansas:
$18,502
(% of AGI for various income ranges: 53.5% for AGIs below $25k, 148.2% for AGIs $25k-50k, 238.8% for AGIs $50k-75k, 703.1% for AGIs $75k-100k, 1441.5% for AGIs $100k-200k, 4142.4% for AGIs over 200k)
Self-employed (Keogh) retirement plans: $27,664 (reported on 2.6% of returns)
72207:
$27,664
Arkansas:
$24,438
(% of AGI for various income ranges: 156.8% for AGIs $100k-200k, 1119.3% for AGIs over 200k)
Total itemized deductions: $51,270 (reported on 23.4% of returns)
Here:
$51,270
State:
$52,840
(% of AGI for various income ranges: 115.3% for AGIs below $25k, 247.4% for AGIs $25k-50k, 625.2% for AGIs $50k-75k, 888.8% for AGIs $75k-100k, 2207.2% for AGIs $100k-200k, 16552.4% for AGIs over 200k)
Charity contributions: $28,681 (reported on 20.0% of returns)
Here:
$28,681
State:
$35,735
(% of AGI for various income ranges: 12.5% for AGIs below $25k, 37.3% for AGIs $25k-50k, 97.5% for AGIs $50k-75k, 225.4% for AGIs $75k-100k, 572.5% for AGIs $100k-200k, 9342.4% for AGIs over 200k)
Taxes paid: $8,714 (reported on 23.4% of returns)
72207:
$8,714
State:
$7,196
(% of AGI for various income ranges: 18.9% for AGIs below $25k, 39.7% for AGIs $25k-50k, 127.5% for AGIs $50k-75k, 251.2% for AGIs $75k-100k, 631.5% for AGIs $100k-200k, 2347.6% for AGIs over 200k)
Earned income credit: $2,231 (reported on 9.2% of returns)
Here:
$2,231
State:
$2,546
(% of AGI for various income ranges: 98.4% for AGIs below $25k, 51.0% for AGIs $25k-50k)
Percentage of individuals using paid preparers for their 2020 taxes: 91.0%
Here:
91%
State:
94%
(% for various income ranges: 89.1% for AGIs below $25k, 90.1% for AGIs $25k-50k, 89.2% for AGIs $50k-75k, 87.8% for AGIs $75k-100k, 92.2% for AGIs $100k-200k, 95.5% for AGIs over 200k)
Averages for the 2012 tax year for zip code 72207, filed in 2013:
Average Adjusted Gross Income (AGI) in 2012: $182,116 (Individual Income Tax Returns)
Here:
$182,116
State:
$52,148
Salary/wage: $123,042 (reported on 79.6% of returns)
Here:
$123,042
State:
$41,669
(% of AGI for various income ranges: 70.4% for AGIs below $25k, 77.2% for AGIs $25k-50k, 72.2% for AGIs $50k-75k, 68.5% for AGIs $75k-100k, 66.9% for AGIs $100k-200k, 48.0% for AGIs over 200k)
Taxable interest for individuals: $7,182 (reported on 50.1% of returns)
This zip code:
$7,182
Arkansas:
$1,648
(% of AGI for various income ranges: 2.4% for AGIs below $25k, 1.0% for AGIs $25k-50k, 1.6% for AGIs $50k-75k, 1.4% for AGIs $75k-100k, 1.4% for AGIs $100k-200k, 2.2% for AGIs over 200k)
Ordinary dividends: $41,109 (reported on 40.7% of returns)
Here:
$41,109
State:
$20,675
(% of AGI for various income ranges: 5.7% for AGIs below $25k, 2.4% for AGIs $25k-50k, 3.3% for AGIs $50k-75k, 3.4% for AGIs $75k-100k, 3.7% for AGIs $100k-200k, 11.2% for AGIs over 200k)
Net capital gain/loss in AGI: +$73,471 (reported on 34.3% of returns)
Here:
+$73,471
State:
+$15,222
(% of AGI for various income ranges: 0.4% for AGIs below $25k, 1.2% for AGIs $25k-50k, 1.2% for AGIs $50k-75k, 2.0% for AGIs $75k-100k, 2.8% for AGIs $100k-200k, 18.1% for AGIs over 200k)
Profit/loss from business: +$26,103 (reported on 20.0% of returns)
Here:
+$26,103
State:
+$9,665
(% of AGI for various income ranges: 8.1% for AGIs below $25k, 3.8% for AGIs $25k-50k, 3.7% for AGIs $50k-75k, 3.0% for AGIs $75k-100k, 5.2% for AGIs $100k-200k, 2.2% for AGIs over 200k)
Taxable individual retirement arrangement distribution: $25,189 (reported on 13.6% of returns)
72207:
$25,189
Arkansas:
$13,644
(% of AGI for various income ranges: 3.7% for AGIs below $25k, 2.8% for AGIs $25k-50k, 2.8% for AGIs $50k-75k, 3.7% for AGIs $75k-100k, 3.5% for AGIs $100k-200k, 1.4% for AGIs over 200k)
Self-employment retirement plans: $23,691 (reported on 2.0% of returns)
72207:
$23,691
Arkansas:
$20,153
Total itemized deductions: $46,784 (15% of AGI, reported on 51.7% of returns)
Here:
$46,784
State:
$23,276
Here:
14.6% of AGI
State:
19.1% of AGI
(% of AGI for various income ranges: 16.7% for AGIs below $25k, 11.4% for AGIs $25k-50k, 13.7% for AGIs $50k-75k, 14.8% for AGIs $75k-100k, 16.7% for AGIs $100k-200k, 12.6% for AGIs over 200k)
Charity contributions: $11,509 (reported on 44.8% of returns)
Here:
$11,509
State:
$5,996
(% of AGI for various income ranges: 1.5% for AGIs below $25k, 1.3% for AGIs $25k-50k, 1.9% for AGIs $50k-75k, 2.3% for AGIs $75k-100k, 2.7% for AGIs $100k-200k, 3.1% for AGIs over 200k)
Taxes paid: $22,941 (reported on 51.6% of returns)
72207:
$22,941
State:
$7,941
(% of AGI for various income ranges: 3.2% for AGIs below $25k, 2.9% for AGIs $25k-50k, 4.5% for AGIs $50k-75k, 5.1% for AGIs $75k-100k, 7.2% for AGIs $100k-200k, 6.8% for AGIs over 200k)
Earned income credit: $1,927 (reported on 9.4% of returns)
Here:
$1,927
State:
$2,455
(% of AGI for various income ranges: 4.6% for AGIs below $25k, 0.4% for AGIs $25k-50k)
Percentage of individuals using paid preparers for their 2012 taxes: 59.3%
Here:
59%
State:
61%
(% for various income ranges: 53.9% for AGIs below $25k, 47.2% for AGIs $25k-50k, 52.2% for AGIs $50k-75k, 58.3% for AGIs $75k-100k, 64.8% for AGIs $100k-200k, 85.4% for AGIs over 200k)
Averages for the 2004 tax year for zip code 72207, filed in 2005:
Average Adjusted Gross Income (AGI) in 2004: $102,236 (Individual Income Tax Returns)
Here:
$102,236
State:
$39,270
Salary/wage: $73,381 (reported on 76.2% of returns)
Here:
$73,381
State:
$34,079
(% of AGI for various income ranges: 68.0% for AGIs $10k-25k, 76.9% for AGIs $25k-50k, 66.8% for AGIs $50k-75k, 67.1% for AGIs $75k-100k, 48.5% for AGIs over 100k)
Taxable interest for individuals: $4,939 (reported on 58.6% of returns)
This zip code:
$4,939
Arkansas:
$1,904
(% of AGI for various income ranges: 5.0% for AGIs $10k-25k, 2.7% for AGIs $25k-50k, 3.0% for AGIs $50k-75k, 2.3% for AGIs $75k-100k, 2.7% for AGIs over 100k)
Taxable dividends: $14,858 (reported on 46.8% of returns)
Here:
$14,858
State:
$5,995
(% of AGI for various income ranges: 4.5% for AGIs $10k-25k, 3.1% for AGIs $25k-50k, 3.0% for AGIs $50k-75k, 4.6% for AGIs $75k-100k, 7.7% for AGIs over 100k)
Net capital gain/loss: +$34,197 (reported on 40.2% of returns)
Here:
+$34,197
State:
+$10,430
(% of AGI for various income ranges: 1.9% for AGIs $10k-25k, 1.4% for AGIs $25k-50k, 3.2% for AGIs $50k-75k, 3.7% for AGIs $75k-100k, 16.9% for AGIs over 100k)
Profit/loss from business: +$23,144 (reported on 17.9% of returns)
Here:
+$23,144
State:
+$7,823
(% of AGI for various income ranges: 5.1% for AGIs $10k-25k, 2.7% for AGIs $25k-50k, 3.9% for AGIs $50k-75k, 4.8% for AGIs $75k-100k, 4.0% for AGIs over 100k)
Profit/loss from farming: +$5,483 (reported on 0.5% of returns)
Here:
+$5,483
State:
-$5,941
IRA payment deduction: $3,449 (reported on 3.2% of returns)
72207:
$3,449
Arkansas:
$3,204
(% of AGI for various income ranges: 0.2% for AGIs $10k-25k, 0.3% for AGIs $25k-50k, 0.2% for AGIs $50k-75k, 0.2% for AGIs $75k-100k, 0.1% for AGIs over 100k)
Self-employed pension: $19,163 (reported on 2.3% of returns)
Here:
$19,163
Arkansas:
$14,742
(% of AGI for various income ranges: 0.2% for AGIs $50k-75k, 0.2% for AGIs $75k-100k, 0.5% for AGIs over 100k)
Total itemized deductions: $30,500 (17% of AGI, reported on 51.0% of returns)
Here:
$30,500
State:
$18,389
Here:
17.3% of AGI
State:
21.0% of AGI
(% of AGI for various income ranges: 14.6% for AGIs $10k-25k, 14.8% for AGIs $25k-50k, 16.4% for AGIs $50k-75k, 18.0% for AGIs $75k-100k, 14.7% for AGIs over 100k)
Charity contributions deductions: $8,914 (5% of AGI, reported on 45.9% of returns)
Here:
$8,914
State:
$4,725
Here:
4.7% of AGI
State:
5.1% of AGI
(% of AGI for various income ranges: 2.5% for AGIs $10k-25k, 2.3% for AGIs $25k-50k, 2.8% for AGIs $50k-75k, 3.1% for AGIs $75k-100k, 4.4% for AGIs over 100k)
Total tax: $22,035 (reported on 82.8% of returns)
72207:
$22,035
State:
$6,047
(% of AGI for various income ranges: 4.2% for AGIs $10k-25k, 8.4% for AGIs $25k-50k, 11.0% for AGIs $50k-75k, 11.7% for AGIs $75k-100k, 20.6% for AGIs over 100k)
Earned income credit: $1,533 (reported on 8.4% of returns)
Here:
$1,533
State:
$1,909
Percentage of individuals using paid preparers for their 2004 taxes: 64.4%
Here:
64%
State:
67%
(% for various income ranges: 60.3% for AGIs below $10k, 60.9% for AGIs $10k-25k, 55.3% for AGIs $25k-50k, 61.5% for AGIs $50k-75k, 68.9% for AGIs $75k-100k, 78.4% for AGIs over 100k)
Likely homosexual households (counted as self-reported same-sex unmarried-partner households)
Lesbian couples: 0.2% of all households
Gay men: 0.0% of all households
Household received Food Stamps/SNAP in the past 12 months: 206 Household did not receive Food Stamps/SNAP in the past 12 months: 5,592
Women who had a birth in the past 12 months: 82 (66 now married, 16 unmarried) Women who did not have a birth in the past 12 months: 2,589 (1,184 now married, 1,405 unmarried)
Housing units in zip code 72207 with a mortgage: 2,569 (305 second mortgage, 6 home equity loan, 252 both second mortgage and home equity loan) Houses without a mortgage: 82
Median monthly owner costs for units with a mortgage: $2,014 Median monthly owner costs for units without a mortgage: $797
Residents with income below the poverty level in 2022:
This zip code:
5.0%
Whole state:
16.8%
Residents with income below 50% of the poverty level in 2022:
This zip code:
3.1%
Whole state:
8.5%
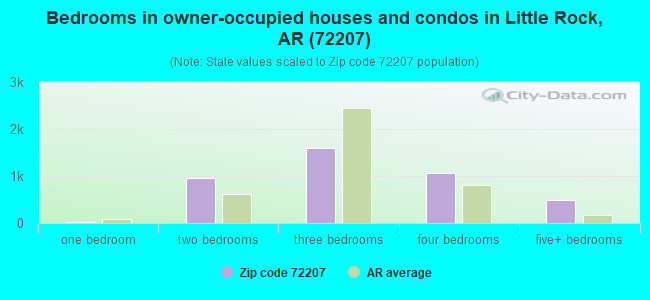
Median number of rooms in houses and condos:
Here:
7.2
State:
6.1
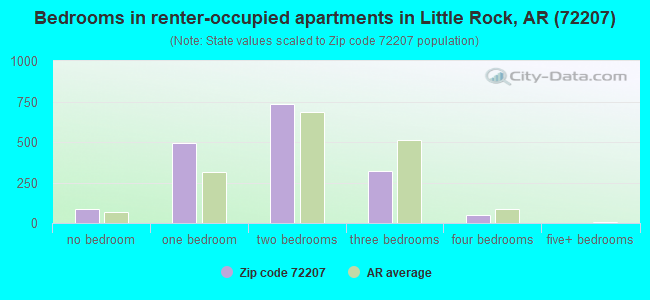
Median number of rooms in apartments:
Here:
3.9
State:
4.3
Notable locations in this zip code not listed on our city pages
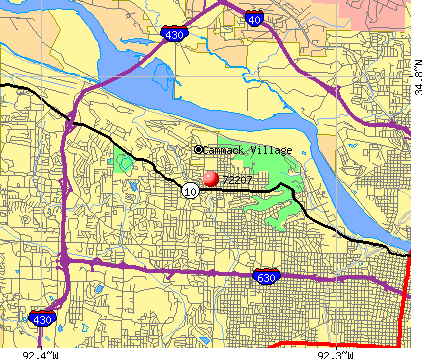
Notable locations in zip code 72207: Cammack Village Police Department (A), Cammack Village Volunteer Fire Department (B), Little Rock Fire Station 10 (C), Little Rock Fire Station 12 (D). Display/hide their locations on the map
Shopping Centers: Pulaski Heights Shopping Center (1), Tanglewood Shopping Center (2), Westgate Shopping Center (3). Display/hide their locations on the map
Churches in zip code 72207 include: Westover Hills Presbyterian Church (A), Trinity United Methodist Church (B), Saint Paul United Methodist Church (C), Forest Highlands Baptist Church (D), Covenant Presbyterian Church (E), Calvary Baptist Church (F). Display/hide their locations on the map
Tourist attraction (not listed on the city page) : Eagle Forum of Arkansas (Cultural Attractions- Events- & Facilities; 1501 North University Avenue Suite 468).
2,140 married couples with children.
587 single-parent households (86 men, 501 women).
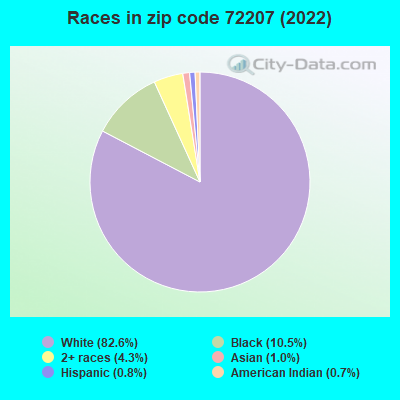
97.9% of residents of 72207 zip code speak English at home.
0.8% of residents speak Spanish at home (90% very well, 8% well, 2% not well).
1.0% of residents speak other Indo-European language at home (93% very well, 7% not well).
0.2% of residents speak Asian or Pacific Island language at home (96% very well, 4% well).
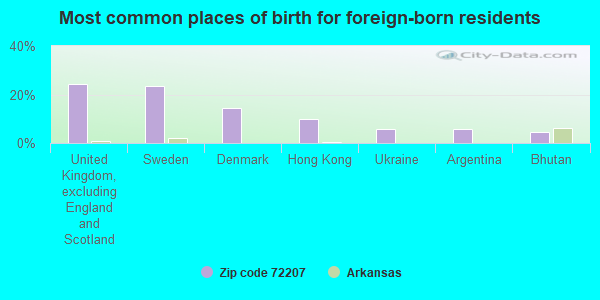
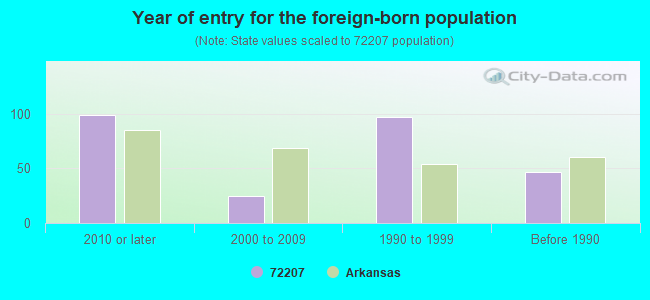
Foreign born population: 239 (2.0%) (53.4% of them are naturalized citizens)
Facilities with environmental interests located in this zip code:
CHEVRON-CANTRELL (7500 CANTRELL in LITTLE ROCK, AR)
STATE MASTER (PDS) - RST-60001029, FACILITY (Resource Conservation and Recovery Act (tracking hazardous waste)) Organizations: BANK OF THE OZARKS (CONTACT/GENERAL)
, YELENICH ROCKY (CONTACT/OWNER)
EXXON CO USA 54832 (9202 N RODNEY PARHAM in LITTLE ROCK, AR)
(Integrated Compliance Information System) - ICIS-06-2001-0210, FORMAL ENFORCEMENT ACTION (Resource Conservation and Recovery Act (tracking hazardous waste)) Business SIC classification: GROCERY STORES; GASOLINE SERVICE STATIONS
FIRESTONE STORE 44N1 (7310 CANTRELL RD in LITTLE ROCK, AR)
STATE MASTER (PDS) - RST-60000442, FACILITY Conditionally Exempt Small Quantity Generators, less than 100 kg/month of hazardous waste (Resource Conservation and Recovery Act (tracking hazardous waste)) - notification Organizations: MARLINCAR PROPERTIES INC (CONTACT/GENERAL)
, BRIDGESTONE/FIRESTONE INC (CONTACT/OWNER)
Alternative names: FIRESTONE STORE # 44N1
FOREST PARK ELEMENTARY SCHOOL (1600 N. TYLER ST. in LITTLE ROCK, AR)
(Geographic Names Information System) (National Center for Education Statistics) - STATE ID-6001024 Organizations: LITTLE ROCK (SCHOOL DISTRICT)
JEFFERSON ELEMENTARY SCHOOL (2600 N. MCKINLEY ST. in LITTLE ROCK, AR)
(Geographic Names Information System) (National Center for Education Statistics) - STATE ID-6001030 Organizations: LITTLE ROCK (SCHOOL DISTRICT)
#109 CANTRELL CHIEF (7002 CANTRELL in LITTLE ROCK, AR)
(Integrated Compliance Information System) - ICIS-06-1997-0709, FORMAL ENFORCEMENT ACTION Business SIC classification: PETROLEUM BULK STATIONS AND TERMINALS
DRUG ENFORCEMENT ADMINISTRATION (2105 NORTH CLEVELAND STREET in LITTLE ROCK, AR)
(Resource Conservation and Recovery Act (tracking hazardous waste)) Alternative names: DRUG ENFORCEMENT ADMINSTRATION, ENVIRONMENTAL MANAGERMENT INC
SHERWIN-WILLIAMS PAINT CO (724 TOWNE OAKS in LITTLE ROCK, AR)
(Resource Conservation and Recovery Act (tracking hazardous waste)) Organizations: SHERWIN WILLIAMS CO (CONTACT/OWNER)
BRITISH CARS OF LITTLE ROCK (7321 CANTRELL RD in LITTLE ROCK, AR)
Conditionally Exempt Small Quantity Generators, less than 100 kg/month of hazardous waste (Resource Conservation and Recovery Act (tracking hazardous waste)) - notification Organizations: SCHAEFFER HARRELL & JOSEPH (CONTACT/OWNER)
LEVINSON CLEANERS (5004 KAVANAUGH in LITTLE ROCK, AR)
Conditionally Exempt Small Quantity Generators, less than 100 kg/month of hazardous waste (Resource Conservation and Recovery Act (tracking hazardous waste)) - notification Organizations: RAMBO BILL ROBERTS EDNA (CONTACT/OWNER)
LEVINSON CLEANERS (7509 CANTRELL RD in LITTLE ROCK, AR)
Conditionally Exempt Small Quantity Generators, less than 100 kg/month of hazardous waste (Resource Conservation and Recovery Act (tracking hazardous waste)) - notification Organizations: RAMDO BILL (CONTACT/OWNER)
SHINNS CLEANERS (2800 FOXCROFT in LITTLE ROCK, AR)
Conditionally Exempt Small Quantity Generators, less than 100 kg/month of hazardous waste (Resource Conservation and Recovery Act (tracking hazardous waste)) - notification Organizations: SHINN SONNY (CONTACT/OWNER)
Housing units lacking complete plumbing facilities: 0.7% Housing units lacking complete kitchen facilities: 1.5%
66.5%Utility gas
32.6%Electricity
0.9%Bottled, tank, or LP gas
Population in 1990: 25,217.
Place of birth for U.S.-born residents:
This state: 8,408
Northeast: 235
Midwest: 899
South: 2,091
West: 238
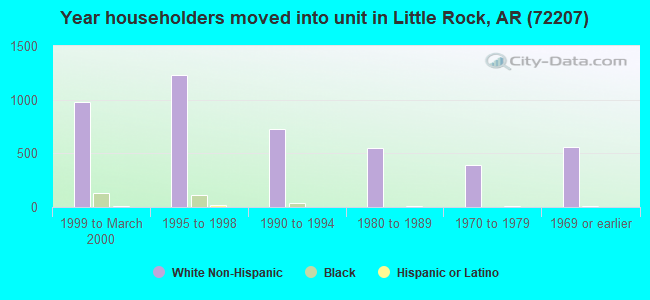
50% of the 72207 zip code residents lived in the same house 5 years ago. Out of people who lived in different houses, 60% lived in this county. Out of people who lived in different counties, 50% lived in Arkansas.
88% of the 72207 zip code residents lived in the same house 1 year ago. Out of people who lived in different houses, 53% moved from this county. Out of people who lived in different houses, 29% moved from different county within same state. Out of people who lived in different houses, 14% moved from different state.
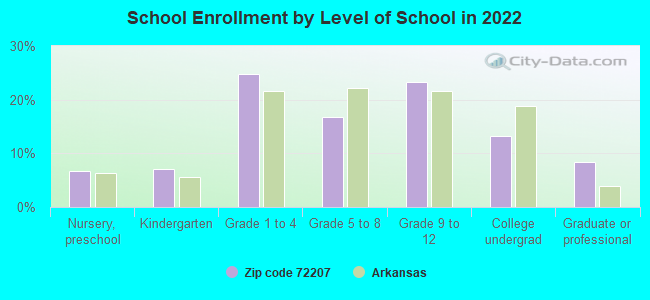
Private vs. public school enrollment:
Students in private schools in grades 1 to 8 (elementary and middle school): 536
Here:
41.0%
Arkansas:
10.5%
Students in private schools in grades 9 to 12 (high school): 349
Here:
47.8%
Arkansas:
8.7%
Students in private undergraduate colleges: 53
Here:
12.9%
Arkansas:
19.4%
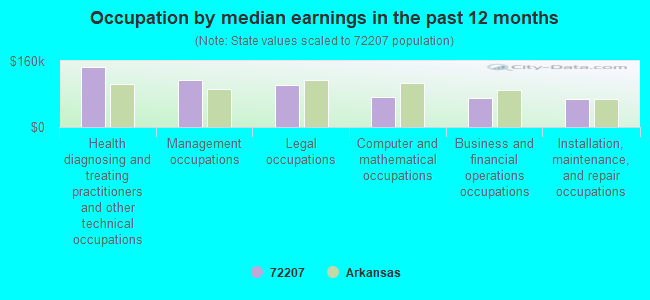
Occupation by median earnings in the past 12 months ($)
146,253Health diagnosing and treating practitioners and other technical occupations
114,521Management occupations
101,877Legal occupations
71,983Computer and mathematical occupations
70,369Business and financial operations occupations
66,823Installation, maintenance, and repair occupations
Companies with federal contracts located in this zip code:
CAVER, DR GILBERT G (5307 KAVANAUGH BLVD in LITTLE ROCK, AR; small business) : $87,500 in 2 contractsfrom 2003 to 2004
$70,000 with Army for Dentistry Services. Signed on 2003-09-26. Completion date: 2003-09-26.
$17,500 with Army for Personal Care Services (includes such services as barber and beauty shop, shoe repairs, tailoring, etc.). Signed on 2004-09-30. Completion date: 2005-09-30.
roman catholic diocese Little Rock (2500 N. Tyler in Little Rock, AR) : $86,708 in 2 contractsin 2005
$43,354 with Public Buildings Service for Lease or Rental of Facilities -- Office Buildings. Signed on 2005-09-14. Effective on 2005-09-16. Completion date: 2005-12-08.
$43,354, same as above.Signed on 2005-09-14. Completion date: 2005-12-13.
THOMAS FILMS, INC (6 BROADVIEW DR in LITTLE ROCK, AR; small business)
$20,000 with U.S. Army Corps of Engineers - civil program financing only for Film/Video Tape Production Services. Signed on 2002-07-30. Completion date: 2002-08-26.
QUAIL VALLEY FARM INC (7509 CANTRELL RD STE 103F in LITTLE ROCK, AR; small business)
$9,372 with Army for Soil Preparation Equipment. Signed on 2004-05-24. Completion date: 2004-06-04.
NATIONAL H V A C SERVICE, LTD (7123 INTERSTATE STE 16 in LITTLE ROCK, AR; small business)
$6,600 with Army for Maintenance, Repair or Alteration of Real Property -- Maintenance Buildings. Signed on 2002-06-06. Completion date: 2002-06-28.
HANDHELDMED, INC (66 CARMEL DRIVE in LITTLE ROCK, GA; small business)
$4,676 with Air Force for ADP Software. Taking place in GA. Signed on 2003-03-24. Completion date: 2003-03-04.
Top industries in this zip code by the number of employees in 2005:
Administrative and Support and Waste Management and Remediation Services: Security Guards and Patrol Services (250-499 employees: 1 establishment)
Other Services (except Public Administration): Religious Organizations (100-249: 1, 20-49: 5, 10-19: 1, 5-9: 1, 1-4: 2)
2002 - 2018 National Fire Incident Reporting System (NFIRS) incidents
Based on the data from the years 2002 - 2018 the average number of fire incidents per year is 7. The highest number of fires - 26 took place in 2018, and the least - 0 in 2007. The data has a growing trend.
When looking into fire subcategories, the most reports belonged to: Structure Fires (40.0%), and Outside Fires (33.9%).
Fire incident types reported to NFIRS in Zip Code 72207


+$5,483
-$5,941
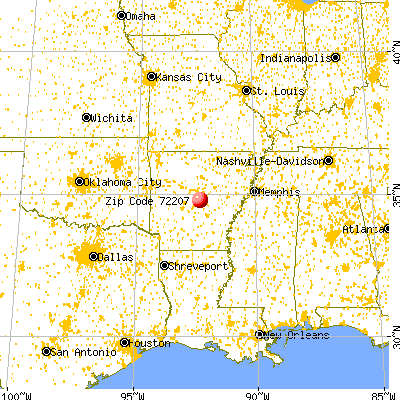
 Nearest zip codes: 72205, 72227, 72204, 72212, 72118, 72201.
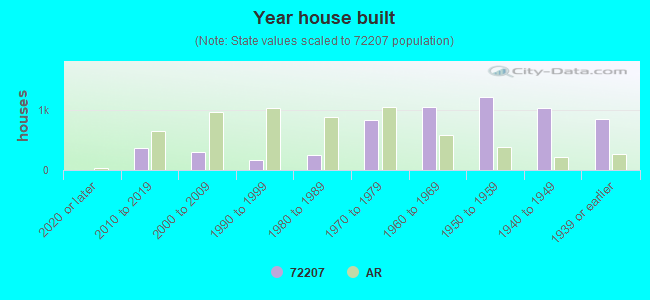


 Based on the data from the years 2002 - 2018 the average number of fire incidents per year is 7. The highest number of fires - 26 took place in 2018, and the least - 0 in 2007. The data has a growing trend.
 When looking into fire subcategories, the most reports belonged to: Structure Fires (40.0%), and Outside Fires (33.9%).