Estimated zip code population in 2022: 3,501 Zip code population in 2010: 3,272 Zip code population in 2000: 3,330
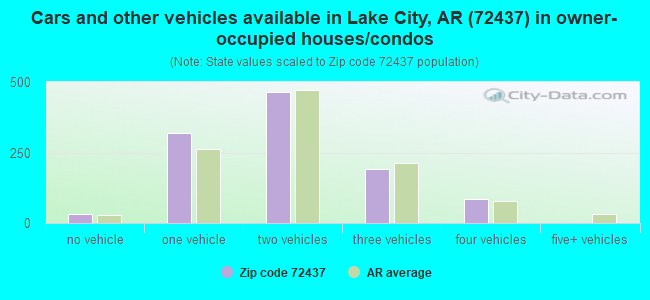
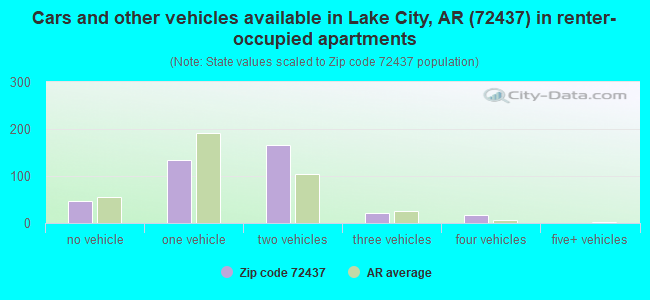
Houses and condos: 1,624 Renter-occupied apartments: 389
% of renters here:
26%
State:
34%
March 2022 cost of living index in zip code 72437: 78.7 (low, U.S. average is 100)
Land area: 106.5 sq. mi. Water area: 2.1 sq. mi.
Population density: 33 people per square mile
(very low).
OSM Map
General Map
Google Map
MSN Map
OSM Map
General Map
Google Map
MSN Map
OSM Map
General Map
Google Map
MSN Map
OSM Map
General Map
Google Map
MSN Map
Please wait while loading the map...
Real estate property taxes paid for housing units in 2022:
This zip code:
0.6% ($839)
Arkansas:
0.5% ($977)
Median real estate property taxes paid for housing units with mortgages in 2022: $961 (0.5%) Median real estate property taxes paid for housing units with no mortgage in 2022: $685 (0.6%)
Business Search- 14 Million verified businesses
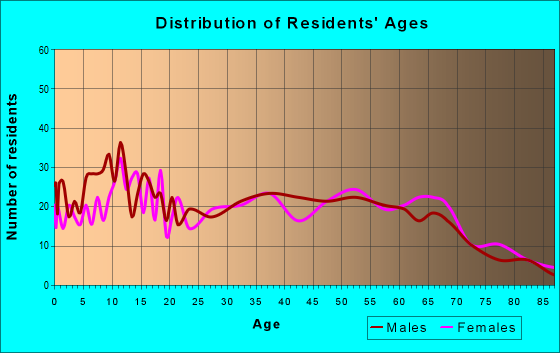
Males: 1,807
(51.6%)
Females: 1,693
(48.4%)
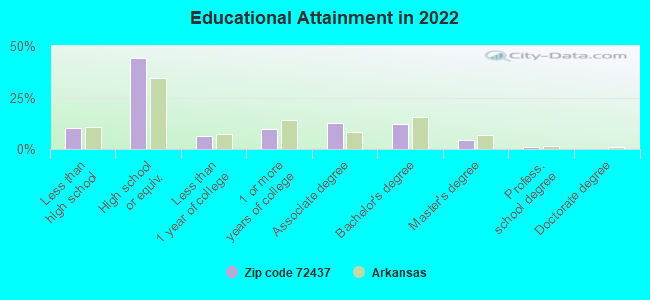
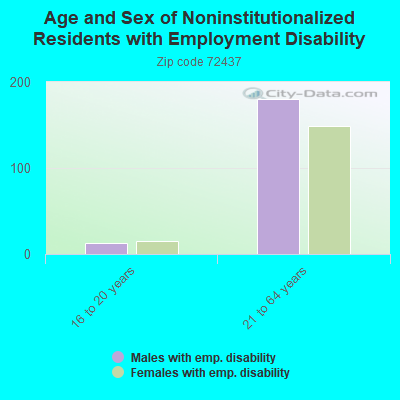
For population 25 years and over in 72437:
High school or higher: 89.5%
Bachelor's degree or higher: 17.4%
Graduate or professional degree: 5.4%
Unemployed: 5.2%
Mean travel time to work (commute): 23.1 minutes
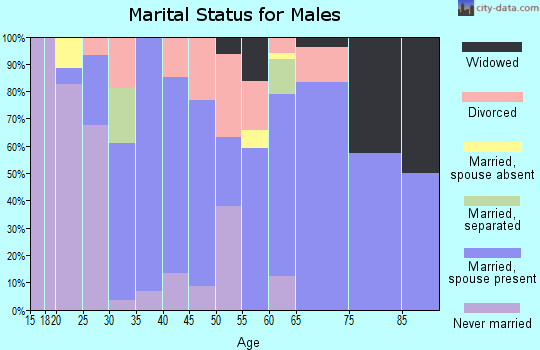
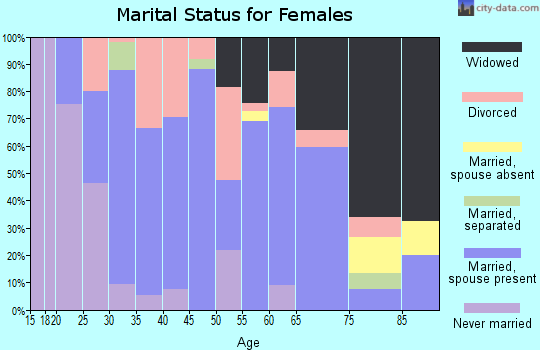
For population 15 years and over in 72437:
Never married: 21.3%
Now married: 57.4%
Separated: 2.5%
Widowed: 10.1%
Divorced: 8.8%
Zip code 72437 compared to state average:
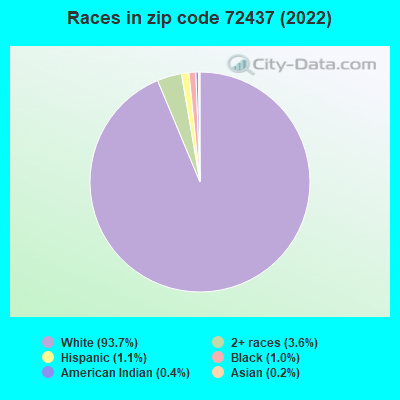
Black race population percentage significantly below state average.
Hispanic race population percentage significantly below state average.
Foreign-born population percentage significantly below state average.
Length of stay since moving in significantly above state average.
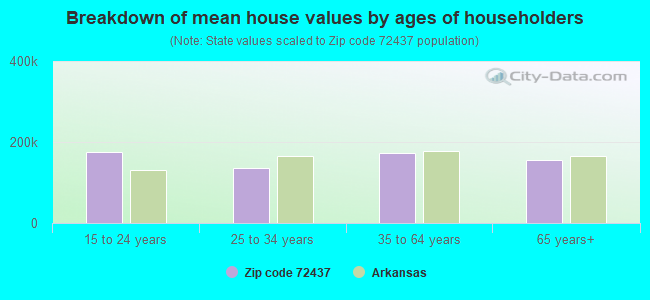
Estimated median house/condo value in 2022: $146,807
72437:
$146,807
Arkansas:
$179,800
According to our research of Arkansas and other state lists, there were 4 registered sex offenders living in 72437 zip code as of April 27, 2024. The ratio of all residents to sex offenders in zip code 72437 is 966 to 1. The ratio of registered sex offenders to all residents in this zip code is lower than the state average.
Median resident age:
This zip code:
35.1 years
Arkansas median age:
38.9 years
Average household size:
This zip code:
2.3 people
Arkansas:
2.4 people
Averages for the 2020 tax year for zip code 72437, filed in 2021:
Average Adjusted Gross Income (AGI) in 2020: $49,796 (Individual Income Tax Returns)
Here:
$49,796
State:
$64,872
Salary/wage: $44,933 (reported on 85.5% of returns)
Here:
$44,933
State:
$50,644
(% of AGI for various income ranges: 1142.2% for AGIs below $25k, 3750.0% for AGIs $25k-50k, 6770.6% for AGIs $50k-75k, 9783.0% for AGIs $75k-100k, 20315.0% for AGIs $100k-200k)
Taxable interest for individuals: $738 (reported on 21.0% of returns)
This zip code:
$738
Arkansas:
$1,857
(% of AGI for various income ranges: 10.3% for AGIs below $25k, 5.3% for AGIs $25k-50k, 24.7% for AGIs $50k-75k, 38.0% for AGIs $75k-100k, 100.0% for AGIs $100k-200k)
Ordinary dividends: $557 (reported on 5.1% of returns)
Here:
$557
State:
$21,681
(% of AGI for various income ranges: 1.6% for AGIs below $25k, 7.1% for AGIs $50k-75k, 26.2% for AGIs $100k-200k)
Net capital gain/loss in AGI: +$3,411 (reported on 6.5% of returns)
Here:
+$3,411
State:
+$22,815
(% of AGI for various income ranges: 2.4% for AGIs below $25k, 70.0% for AGIs $50k-75k, 223.7% for AGIs $100k-200k)
Profit/loss from business: +$6,352 (reported on 16.7% of returns)
Here:
+$6,352
State:
+$9,743
(% of AGI for various income ranges: 99.5% for AGIs below $25k, 156.0% for AGIs $25k-50k, 220.6% for AGIs $50k-75k, 87.0% for AGIs $75k-100k, 203.8% for AGIs $100k-200k)
Taxable individual retirement arrangement distribution: $10,671 (reported on 5.1% of returns)
72437:
$10,671
Arkansas:
$18,502
(% of AGI for various income ranges: 34.3% for AGIs below $25k, 55.3% for AGIs $25k-50k, 454.0% for AGIs $75k-100k)
Total itemized deductions: $28,467 (reported on 2.2% of returns)
Here:
$28,467
State:
$52,840
(% of AGI for various income ranges: 1067.5% for AGIs $100k-200k)
Charity contributions: $9,967 (reported on 2.2% of returns)
Here:
$9,967
State:
$35,735
(% of AGI for various income ranges: 299.0% for AGIs $75k-100k)
Taxes paid: $7,333 (reported on 2.2% of returns)
72437:
$7,333
State:
$7,196
(% of AGI for various income ranges: 275.0% for AGIs $100k-200k)
Earned income credit: $2,372 (reported on 21.0% of returns)
Here:
$2,372
State:
$2,546
(% of AGI for various income ranges: 112.7% for AGIs below $25k, 90.3% for AGIs $25k-50k)
Percentage of individuals using paid preparers for their 2020 taxes: 97.1%
Here:
97%
State:
94%
(% for various income ranges: 93.8% for AGIs below $25k, 100.0% for AGIs $25k-50k, 95.7% for AGIs $50k-75k, 100.0% for AGIs $75k-100k, 100.0% for AGIs $100k-200k)
Averages for the 2012 tax year for zip code 72437, filed in 2013:
Average Adjusted Gross Income (AGI) in 2012: $41,707 (Individual Income Tax Returns)
Here:
$41,707
State:
$52,148
Salary/wage: $34,149 (reported on 87.9% of returns)
Here:
$34,149
State:
$41,669
(% of AGI for various income ranges: 78.5% for AGIs below $25k, 85.0% for AGIs $25k-50k, 84.9% for AGIs $50k-75k, 77.7% for AGIs $75k-100k, 43.1% for AGIs $100k-200k)
Taxable interest for individuals: $506 (reported on 24.2% of returns)
This zip code:
$506
Arkansas:
$1,648
(% of AGI for various income ranges: 0.4% for AGIs below $25k, 0.2% for AGIs $25k-50k, 0.1% for AGIs $50k-75k, 0.4% for AGIs $75k-100k, 0.4% for AGIs $100k-200k)
Ordinary dividends: $1,386 (reported on 5.3% of returns)
Here:
$1,386
State:
$20,675
Net capital gain/loss in AGI: +$3,320 (reported on 3.8% of returns)
Here:
+$3,320
State:
+$15,222
Profit/loss from business: +$2,494 (reported on 13.6% of returns)
Here:
+$2,494
State:
+$9,665
(% of AGI for various income ranges: 6.1% for AGIs below $25k, 0.6% for AGIs $25k-50k)
Taxable individual retirement arrangement distribution: $9,100 (reported on 4.5% of returns)
72437:
$9,100
Arkansas:
$13,644
Total itemized deductions: $19,250 (20% of AGI, reported on 15.2% of returns)
Here:
$19,250
State:
$23,276
Here:
20.0% of AGI
State:
19.1% of AGI
(% of AGI for various income ranges: 5.6% for AGIs $25k-50k, 6.8% for AGIs $50k-75k, 8.4% for AGIs $75k-100k, 11.3% for AGIs $100k-200k)
Charity contributions: $5,793 (reported on 11.4% of returns)
Here:
$5,793
State:
$5,996
(% of AGI for various income ranges: 0.9% for AGIs $25k-50k, 1.4% for AGIs $50k-75k, 1.9% for AGIs $75k-100k, 3.0% for AGIs $100k-200k)
Taxes paid: $6,180 (reported on 15.2% of returns)
72437:
$6,180
State:
$7,941
(% of AGI for various income ranges: 0.9% for AGIs $25k-50k, 1.7% for AGIs $50k-75k, 2.6% for AGIs $75k-100k, 4.9% for AGIs $100k-200k)
Earned income credit: $2,300 (reported on 25.8% of returns)
Here:
$2,300
State:
$2,455
(% of AGI for various income ranges: 8.0% for AGIs below $25k, 1.3% for AGIs $25k-50k)
Percentage of individuals using paid preparers for their 2012 taxes: 69.7%
Here:
70%
State:
61%
(% for various income ranges: 65.5% for AGIs below $25k, 71.1% for AGIs $25k-50k, 70.6% for AGIs $50k-75k, 72.7% for AGIs $75k-100k, 87.5% for AGIs $100k-200k)
Averages for the 2004 tax year for zip code 72437, filed in 2005:
Average Adjusted Gross Income (AGI) in 2004: $29,936 (Individual Income Tax Returns)
Here:
$29,936
State:
$39,270
Salary/wage: $26,471 (reported on 87.3% of returns)
Here:
$26,471
State:
$34,079
(% of AGI for various income ranges: 82.6% for AGIs below $10k, 81.1% for AGIs $10k-25k, 84.3% for AGIs $25k-50k, 84.9% for AGIs $50k-75k, 70.1% for AGIs $75k-100k, 33.5% for AGIs over 100k)
Taxable interest for individuals: $1,035 (reported on 31.1% of returns)
This zip code:
$1,035
Arkansas:
$1,904
(% of AGI for various income ranges: 2.0% for AGIs below $10k, 1.4% for AGIs $10k-25k, 0.5% for AGIs $25k-50k, 1.0% for AGIs $50k-75k, 1.6% for AGIs $75k-100k, 1.7% for AGIs over 100k)
Taxable dividends: $692 (reported on 8.9% of returns)
Here:
$692
State:
$5,995
(% of AGI for various income ranges: 0.4% for AGIs below $10k, 0.1% for AGIs $10k-25k, 0.1% for AGIs $25k-50k, 0.0% for AGIs $50k-75k, 0.7% for AGIs $75k-100k, 0.7% for AGIs over 100k)
Net capital gain/loss: +$4,908 (reported on 7.3% of returns)
Here:
+$4,908
State:
+$10,430
(% of AGI for various income ranges: -0.1% for AGIs $10k-25k, 0.3% for AGIs $25k-50k, 2.1% for AGIs $50k-75k, 5.9% for AGIs over 100k)
Profit/loss from business: +$4,403 (reported on 16.4% of returns)
Here:
+$4,403
State:
+$7,823
(% of AGI for various income ranges: 16.2% for AGIs below $10k, 5.6% for AGIs $10k-25k, 2.2% for AGIs $25k-50k, 0.2% for AGIs $50k-75k)
IRA payment deduction: $3,071 (reported on 2.3% of returns)
72437:
$3,071
Arkansas:
$3,204
Total itemized deductions: $13,886 (22% of AGI, reported on 12.5% of returns)
Here:
$13,886
State:
$18,389
Here:
21.9% of AGI
State:
21.0% of AGI
(% of AGI for various income ranges: 3.7% for AGIs $10k-25k, 4.7% for AGIs $25k-50k, 4.5% for AGIs $50k-75k, 10.2% for AGIs $75k-100k, 13.9% for AGIs over 100k)
Charity contributions deductions: $3,938 (6% of AGI, reported on 10.7% of returns)
Here:
$3,938
State:
$4,725
Here:
6.1% of AGI
State:
5.1% of AGI
(% of AGI for various income ranges: 0.8% for AGIs $10k-25k, 0.9% for AGIs $25k-50k, 1.0% for AGIs $50k-75k, 2.4% for AGIs $75k-100k, 4.8% for AGIs over 100k)
Total tax: $3,398 (reported on 69.5% of returns)
72437:
$3,398
State:
$6,047
(% of AGI for various income ranges: 4.0% for AGIs below $10k, 3.8% for AGIs $10k-25k, 5.7% for AGIs $25k-50k, 8.6% for AGIs $50k-75k, 11.0% for AGIs $75k-100k, 19.5% for AGIs over 100k)
Earned income credit: $1,786 (reported on 27.8% of returns)
Here:
$1,786
State:
$1,909
Percentage of individuals using paid preparers for their 2004 taxes: 79.2%
Here:
79%
State:
67%
(% for various income ranges: 72.4% for AGIs below $10k, 82.3% for AGIs $10k-25k, 78.9% for AGIs $25k-50k, 82.6% for AGIs $50k-75k, 83.8% for AGIs $75k-100k, 79.2% for AGIs over 100k)
Likely homosexual households (counted as self-reported same-sex unmarried-partner households)
Lesbian couples: 0.3% of all households
Gay men: 0.0% of all households
Household received Food Stamps/SNAP in the past 12 months: 88 Household did not receive Food Stamps/SNAP in the past 12 months: 1,393
Women who had a birth in the past 12 months: 142 (120 now married, 24 unmarried) Women who did not have a birth in the past 12 months: 632 (490 now married, 145 unmarried)
Housing units in zip code 72437 with a mortgage: 595 (15 second mortgage, 14 both second mortgage and home equity loan) Houses without a mortgage: 9
Median monthly owner costs for units with a mortgage: $1,013 Median monthly owner costs for units without a mortgage: $376
Residents with income below the poverty level in 2022:
This zip code:
8.9%
Whole state:
16.8%
Residents with income below 50% of the poverty level in 2022:
This zip code:
6.5%
Whole state:
8.5%
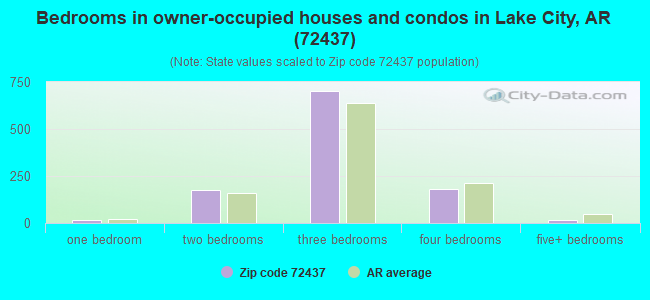
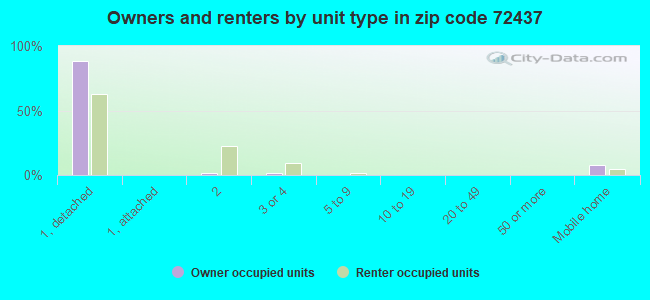
Median number of rooms in houses and condos:
Here:
5.9
State:
6.1
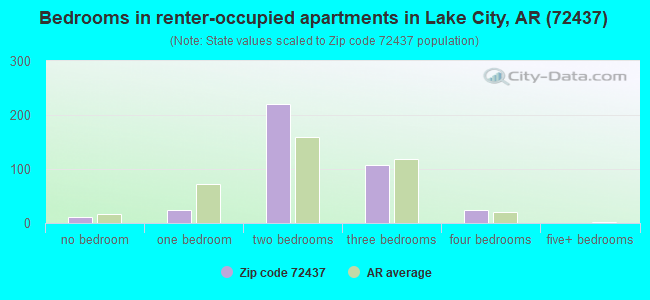
Median number of rooms in apartments:
Here:
4.8
State:
4.3
Notable locations in this zip code not listed on our city pages
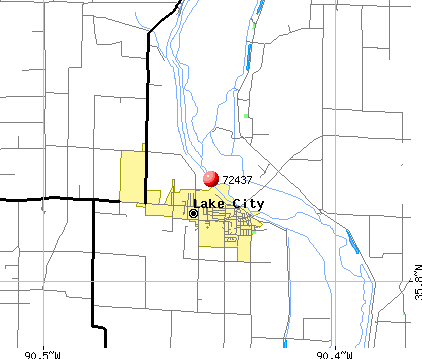
Notable locations in zip code 72437: Jackson Landing (A), Lake City Police Department (B), Craighead County Sheriff's Office - East (C), Lake City Fire Protection District Dixie Station (D), Lake City Volunteer Fire Main Station (E), Air - Evacuation Lifeteam 2 (F). Display/hide their locations on the map
Churches in zip code 72437 include: Walnut Grove Church (A), Brown Church (B), Burnt Hill Church (C), Cothern Church (D), Trinity Church (E), Bowman Baptist Church (F), Dixie Baptist Church (G), Lunsford Baptist Church (H), Elm Grove Church (I). Display/hide their locations on the map
Cemeteries: Lake City Cemetery (1), Lower Cane Island Cemetery (2), Burrow Cemetery (3), Upper Cane Island Cemetery (4). Display/hide their locations on the map
In group quarters: 60 (-1 institutionalized population)
Size of family households: 475 2-persons, 232 3-persons, 123 4-persons, 107 5-persons, 31 6-persons, 4 7-or-more-persons
Size of nonfamily households: 457 1-person, 35 2-persons, 8 3-persons
367 married couples with children.
128 single-parent households (49 men, 79 women).
98.5% of residents of 72437 zip code speak English at home.
0.6% of residents speak Spanish at home (100% very well).
0.2% of residents speak other Indo-European language at home (100% very well).
0.2% of residents speak Asian or Pacific Island language at home (100% very well).
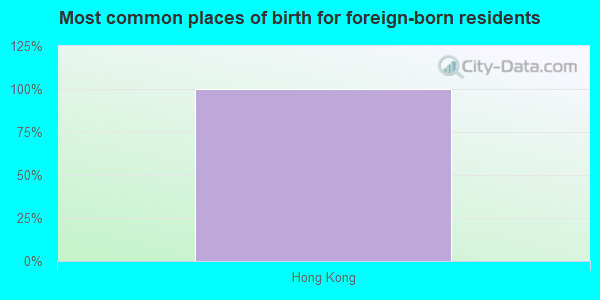
Foreign born population: 8 (0.2%) (100.0% of them are naturalized citizens)
This zip code:
0.2%
Whole state:
5.1%
100%Hong Kong
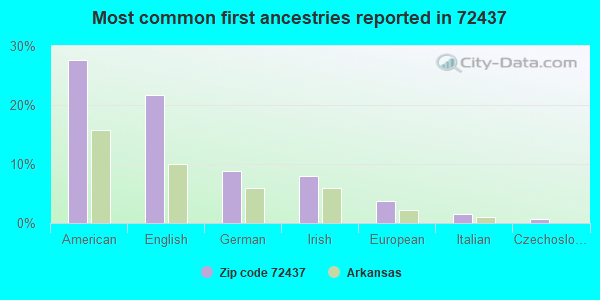
28%American
22%English
9%German
8%Irish
4%European
2%Italian
1%Czechoslovakian
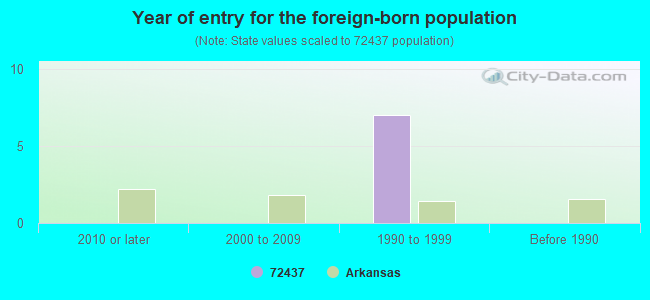
Year of entry for the foreign-born population
02010 or later
02000 to 2009
71990 to 1999
0Before 1990
Facilities with environmental interests located in this zip code:
LAKE CITY, CITY OF (EBONY ST in LAKE CITY, AR)
National Pollutant Discharge Elimination System NON-MAJOR (Tracking pollutant discharge elimination systems) - permit STATE MASTER (PDS) - WATER-AR0034134, National Pollutant Discharge Elimination System Permit Business SIC classification: SEWERAGE SYSTEMS
AHTD-BRDG 100153 ST FRANCIS & 18 (ST FRANCIS RIVER & HWY 18 in LAKE CITY, AR) . Federal Facility. DEPARTMENT OF TRANSPORTATION
(Resource Conservation and Recovery Act (tracking hazardous waste)) Organizations: ARK HWY & TRANS DEPT (CONTACT/OWNER)
Alternative names: AHTD-ST FRANCIS & 18 BRDG 100153
Housing units lacking complete plumbing facilities: 5.4% Housing units lacking complete kitchen facilities: 2.2%
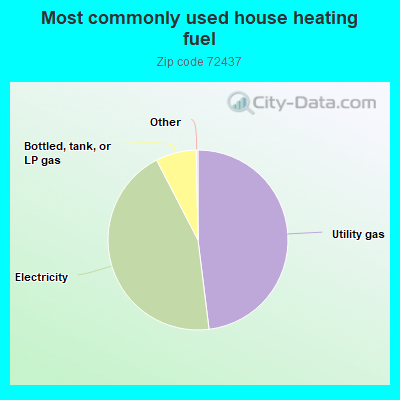
48.1%Utility gas
44.4%Electricity
7.3%Bottled, tank, or LP gas
Population in 1990: 2,056. Population change in the 1990s: +1,274 (+62.0%).
Place of birth for U.S.-born residents:
This state: 2,684
Northeast: 13
Midwest: 392
South: 304
West: 67
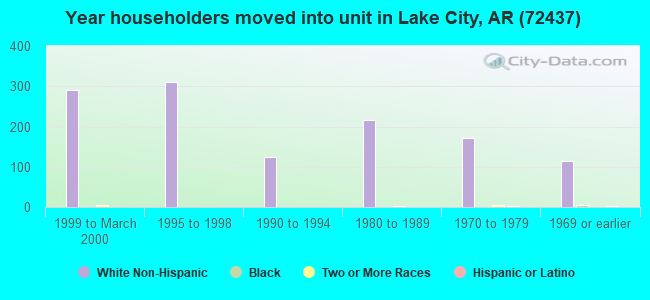
55% of the 72437 zip code residents lived in the same house 5 years ago. Out of people who lived in different houses, 61% lived in this county. Out of people who lived in different counties, 50% lived in Arkansas.
90% of the 72437 zip code residents lived in the same house 1 year ago. Out of people who lived in different houses, 56% moved from this county. Out of people who lived in different houses, 26% moved from different county within same state. Out of people who lived in different houses, 15% moved from different state.
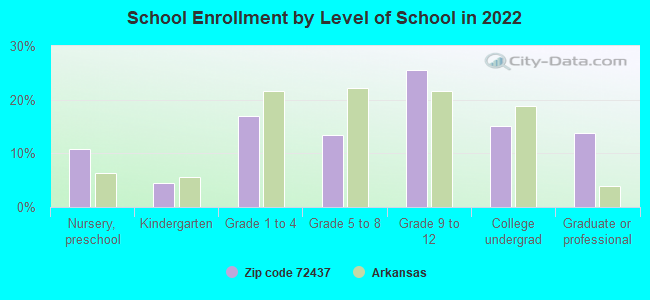
Private vs. public school enrollment:
Students in private schools in grades 1 to 8 (elementary and middle school):
Here:
0.0%
Arkansas:
10.5%
Students in private schools in grades 9 to 12 (high school):
Here:
0.0%
Arkansas:
8.7%
Students in private undergraduate colleges: 23
Here:
23.4%
Arkansas:
19.4%
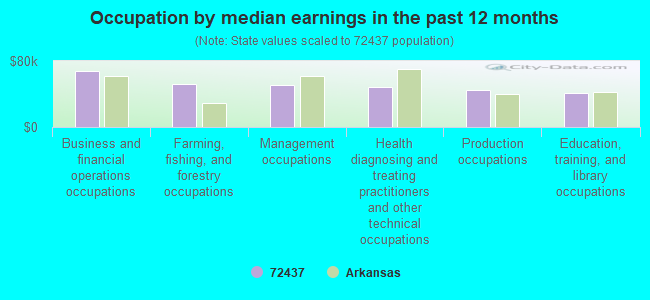
Occupation by median earnings in the past 12 months ($)
67,471Business and financial operations occupations
51,635Farming, fishing, and forestry occupations
50,905Management occupations
49,043Health diagnosing and treating practitioners and other technical occupations
44,654Production occupations
40,757Education, training, and library occupations
Companies with federal contracts located in this zip code:
LAKESIDE NURSING CENTER (1207 WILLOW RUN RD in LAKE CITY, AR) 230 employees, $6304124 revenue: $221,095 in 16 contractsfrom 2000 to 2003
Contracts for Nursing Home Care Contracts by Department of Veterans Affairs Signed by year:2000: $63,000; 2001: $70,000; 2002: $51,718; 2003: $36,377; 2004: $0; 2005: $0; 2006: $0.
Biggest contracts:
$27,000 with Department of Veterans Affairs for Nursing Home Care Contracts. Signed on 2000-10-15. Completion date: 2001-09-15.
$27,000, same as above.Signed on 2000-09-15. Completion date: 2000-10-15.
$22,000, same as above.Signed on 2001-07-15. Completion date: 2001-09-15.
$18,000, same as above.Signed on 2001-01-15. Completion date: 2001-03-15.
Top industries in this zip code by the number of employees in 2005:
Health Care and Social Assistance: Nursing Care Facilities (50-99 employees: 1 establishment)
Accommodation and Food Services: Limited-Service Restaurants (20-49: 1, 10-19: 1)
Professional, Scientific, and Technical Services: Offices of Lawyers (10-19: 1, 1-4: 1)
Other Services (except Public Administration): Industrial Launderers (10-19: 1)
Other Services (except Public Administration): Religious Organizations (1-4: 5)
People in group quarters in 2010:
62 people in nursing facilities/skilled-nursing facilities
People in group quarters in 2000:
80 people in nursing homes
Fatal accident statistics in 2014:
Fatal accident count: 2
Vehicles involved in fatal accidents: 3
Fatal accidents caused by drunken drivers: 1
Fatalities: 3
Persons involved in fatal accidents: 4
Pedestrians involved in fatal accidents: 0
Fatal accident statistics in 2013:
Fatal accident count: 1
Vehicles involved in fatal accidents: 2
Fatal accidents caused by drunken drivers: 0
Fatalities: 1
Persons involved in fatal accidents: 2
Pedestrians involved in fatal accidents: 0
Home Mortgage Disclosure Act Aggregated Statistics For Year 2009 (Based on 6 partial tracts)
A) FHA, FSA/RHS & VA Home Purchase Loans
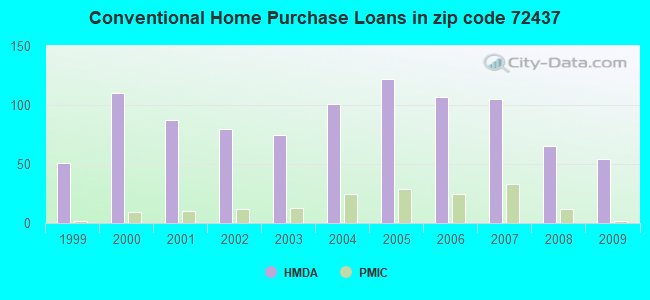
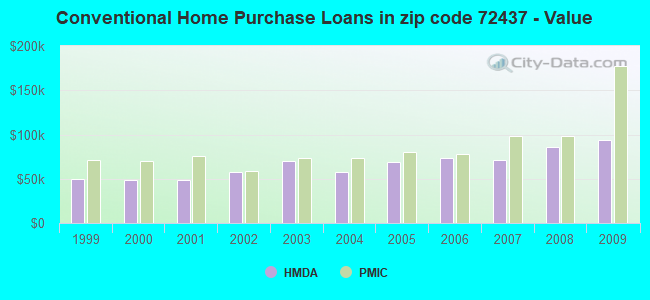
B) Conventional Home Purchase Loans
C) Refinancings
D) Home Improvement Loans
E) Loans on Dwellings For 5+ Families
F) Non-occupant Loans on < 5 Family Dwellings (A B C & D)
G) Loans On Manufactured Home Dwelling (A B C & D)
Number
Average Value
Number
Average Value
Number
Average Value
Number
Average Value
Number
Average Value
Number
Average Value
Number
Average Value
LOANS ORIGINATED
70
$100,282
54
$94,086
147
$108,716
25
$18,975
1
$25,460
39
$72,704
16
$37,031
APPLICATIONS APPROVED, NOT ACCEPTED
1
$16,970
1
$64,710
6
$80,057
1
$53,720
0
$0
0
$0
1
$36,600
APPLICATIONS DENIED
5
$84,134
12
$54,077
43
$93,039
9
$20,613
0
$0
4
$78,395
6
$33,165
APPLICATIONS WITHDRAWN
7
$72,676
9
$87,329
39
$112,759
1
$68,420
0
$0
2
$54,045
1
$36,070
FILES CLOSED FOR INCOMPLETENESS
1
$53,720
3
$106,547
3
$178,900
0
$0
0
$0
0
$0
1
$36,070
Aggregated Statistics For Year 2008 (Based on 6 partial tracts)
A) FHA, FSA/RHS & VA Home Purchase Loans
B) Conventional Home Purchase Loans
C) Refinancings
D) Home Improvement Loans
F) Non-occupant Loans on < 5 Family Dwellings (A B C & D)
G) Loans On Manufactured Home Dwelling (A B C & D)
Number
Average Value
Number
Average Value
Number
Average Value
Number
Average Value
Number
Average Value
Number
Average Value
LOANS ORIGINATED
66
$86,439
65
$86,078
123
$87,800
29
$22,647
47
$60,664
18
$32,284
APPLICATIONS APPROVED, NOT ACCEPTED
1
$61,530
5
$69,658
8
$70,180
1
$36,610
2
$71,170
3
$56,603
APPLICATIONS DENIED
11
$74,885
24
$56,987
58
$83,316
29
$11,882
6
$61,982
10
$34,545
APPLICATIONS WITHDRAWN
3
$68,883
13
$63,735
21
$109,748
1
$35,810
2
$17,905
1
$11,190
FILES CLOSED FOR INCOMPLETENESS
0
$0
0
$0
8
$92,722
1
$38,190
0
$0
0
$0
Aggregated Statistics For Year 2007 (Based on 6 partial tracts)
A) FHA, FSA/RHS & VA Home Purchase Loans
B) Conventional Home Purchase Loans
C) Refinancings
D) Home Improvement Loans
F) Non-occupant Loans on < 5 Family Dwellings (A B C & D)
G) Loans On Manufactured Home Dwelling (A B C & D)
Number
Average Value
Number
Average Value
Number
Average Value
Number
Average Value
Number
Average Value
Number
Average Value
LOANS ORIGINATED
30
$86,949
105
$71,190
128
$86,576
31
$39,431
42
$46,904
27
$37,737
APPLICATIONS APPROVED, NOT ACCEPTED
1
$43,490
13
$52,590
20
$80,380
5
$24,016
0
$0
6
$42,120
APPLICATIONS DENIED
4
$75,030
43
$63,876
66
$74,529
22
$20,559
4
$62,258
11
$44,283
APPLICATIONS WITHDRAWN
0
$0
9
$91,913
40
$73,752
3
$53,810
4
$65,285
4
$36,522
FILES CLOSED FOR INCOMPLETENESS
0
$0
4
$77,162
15
$86,099
3
$24,010
1
$21,220
0
$0
Aggregated Statistics For Year 2006 (Based on 6 partial tracts)
A) FHA, FSA/RHS & VA Home Purchase Loans
B) Conventional Home Purchase Loans
C) Refinancings
D) Home Improvement Loans
E) Loans on Dwellings For 5+ Families
F) Non-occupant Loans on < 5 Family Dwellings (A B C & D)
G) Loans On Manufactured Home Dwelling (A B C & D)
Number
Average Value
Number
Average Value
Number
Average Value
Number
Average Value
Number
Average Value
Number
Average Value
Number
Average Value
LOANS ORIGINATED
35
$82,082
107
$73,229
128
$65,553
35
$28,252
0
$0
45
$44,992
22
$22,394
APPLICATIONS APPROVED, NOT ACCEPTED
2
$52,035
13
$68,995
12
$110,630
3
$102,640
0
$0
1
$262,550
5
$43,344
APPLICATIONS DENIED
5
$80,036
51
$64,214
61
$77,774
20
$25,072
1
$72,130
7
$35,660
17
$42,269
APPLICATIONS WITHDRAWN
5
$55,908
27
$64,821
52
$96,001
1
$34,500
0
$0
10
$63,443
2
$35,880
FILES CLOSED FOR INCOMPLETENESS
0
$0
0
$0
11
$112,089
1
$79,460
0
$0
0
$0
1
$85,390
Aggregated Statistics For Year 2005 (Based on 6 partial tracts)
A) FHA, FSA/RHS & VA Home Purchase Loans
B) Conventional Home Purchase Loans
C) Refinancings
D) Home Improvement Loans
F) Non-occupant Loans on < 5 Family Dwellings (A B C & D)
G) Loans On Manufactured Home Dwelling (A B C & D)
Number
Average Value
Number
Average Value
Number
Average Value
Number
Average Value
Number
Average Value
Number
Average Value
LOANS ORIGINATED
28
$79,312
122
$69,061
139
$77,743
26
$54,087
50
$49,049
24
$30,245
APPLICATIONS APPROVED, NOT ACCEPTED
0
$0
7
$66,980
24
$68,205
0
$0
3
$73,097
4
$45,752
APPLICATIONS DENIED
7
$64,493
53
$52,735
80
$72,182
17
$31,543
12
$43,327
33
$38,814
APPLICATIONS WITHDRAWN
2
$53,735
23
$117,885
41
$97,751
5
$135,800
8
$85,741
2
$64,265
FILES CLOSED FOR INCOMPLETENESS
0
$0
1
$68,950
11
$114,485
0
$0
0
$0
0
$0
Aggregated Statistics For Year 2004 (Based on 6 partial tracts)
A) FHA, FSA/RHS & VA Home Purchase Loans
B) Conventional Home Purchase Loans
C) Refinancings
D) Home Improvement Loans
F) Non-occupant Loans on < 5 Family Dwellings (A B C & D)
G) Loans On Manufactured Home Dwelling (A B C & D)
Number
Average Value
Number
Average Value
Number
Average Value
Number
Average Value
Number
Average Value
Number
Average Value
LOANS ORIGINATED
44
$66,944
101
$57,822
179
$71,502
25
$23,044
50
$40,561
28
$29,528
APPLICATIONS APPROVED, NOT ACCEPTED
2
$54,280
15
$63,307
31
$79,290
1
$10,610
2
$74,110
8
$25,539
APPLICATIONS DENIED
9
$65,444
54
$46,374
85
$68,871
19
$27,658
12
$43,519
21
$33,860
APPLICATIONS WITHDRAWN
4
$57,700
9
$66,299
47
$83,632
3
$41,953
6
$54,098
1
$50,390
FILES CLOSED FOR INCOMPLETENESS
1
$52,600
3
$41,847
14
$84,304
1
$75,850
0
$0
2
$41,840
Aggregated Statistics For Year 2003 (Based on 6 partial tracts)
A) FHA, FSA/RHS & VA Home Purchase Loans
B) Conventional Home Purchase Loans
C) Refinancings
D) Home Improvement Loans
F) Non-occupant Loans on < 5 Family Dwellings (A B C & D)
Number
Average Value
Number
Average Value
Number
Average Value
Number
Average Value
Number
Average Value
LOANS ORIGINATED
37
$66,891
75
$69,933
282
$70,183
22
$15,658
59
$36,871
APPLICATIONS APPROVED, NOT ACCEPTED
0
$0
15
$58,972
22
$80,995
2
$25,560
4
$29,180
APPLICATIONS DENIED
19
$60,667
41
$61,090
116
$62,502
13
$27,358
10
$26,557
APPLICATIONS WITHDRAWN
6
$54,138
14
$86,042
58
$71,642
3
$30,190
7
$33,991
FILES CLOSED FOR INCOMPLETENESS
1
$62,680
1
$68,540
12
$75,501
0
$0
2
$38,520
Aggregated Statistics For Year 2002 (Based on 6 partial tracts)
A) FHA, FSA/RHS & VA Home Purchase Loans
B) Conventional Home Purchase Loans
C) Refinancings
D) Home Improvement Loans
F) Non-occupant Loans on < 5 Family Dwellings (A B C & D)
Number
Average Value
Number
Average Value
Number
Average Value
Number
Average Value
Number
Average Value
LOANS ORIGINATED
48
$66,180
80
$57,079
194
$69,767
30
$21,679
48
$37,030
APPLICATIONS APPROVED, NOT ACCEPTED
2
$50,905
9
$49,098
32
$57,964
1
$74,260
3
$32,717
APPLICATIONS DENIED
10
$58,910
45
$43,606
87
$64,661
10
$10,255
6
$34,253
APPLICATIONS WITHDRAWN
1
$61,000
7
$63,140
25
$65,710
0
$0
1
$26,520
FILES CLOSED FOR INCOMPLETENESS
0
$0
0
$0
7
$78,809
0
$0
1
$25,990
Aggregated Statistics For Year 2001 (Based on 6 partial tracts)
A) FHA, FSA/RHS & VA Home Purchase Loans
B) Conventional Home Purchase Loans
C) Refinancings
D) Home Improvement Loans
F) Non-occupant Loans on < 5 Family Dwellings (A B C & D)
Number
Average Value
Number
Average Value
Number
Average Value
Number
Average Value
Number
Average Value
LOANS ORIGINATED
60
$65,598
87
$49,114
223
$62,603
35
$22,018
30
$39,247
APPLICATIONS APPROVED, NOT ACCEPTED
2
$44,000
11
$45,459
17
$59,241
0
$0
2
$54,685
APPLICATIONS DENIED
4
$73,652
34
$40,864
98
$55,235
18
$17,616
6
$21,895
APPLICATIONS WITHDRAWN
3
$51,347
5
$65,168
51
$62,916
0
$0
1
$94,390
FILES CLOSED FOR INCOMPLETENESS
1
$63,790
2
$53,160
11
$55,085
1
$5,300
0
$0
Aggregated Statistics For Year 2000 (Based on 6 partial tracts)
A) FHA, FSA/RHS & VA Home Purchase Loans
B) Conventional Home Purchase Loans
C) Refinancings
D) Home Improvement Loans
E) Loans on Dwellings For 5+ Families
F) Non-occupant Loans on < 5 Family Dwellings (A B C & D)
Number
Average Value
Number
Average Value
Number
Average Value
Number
Average Value
Number
Average Value
Number
Average Value
LOANS ORIGINATED
34
$62,921
110
$48,054
117
$50,925
41
$15,134
1
$61,560
43
$31,960
APPLICATIONS APPROVED, NOT ACCEPTED
2
$47,920
18
$39,499
22
$58,466
5
$10,510
0
$0
2
$32,840
APPLICATIONS DENIED
4
$63,605
56
$37,359
83
$49,543
13
$18,676
0
$0
3
$44,137
APPLICATIONS WITHDRAWN
3
$52,680
7
$53,967
51
$47,352
4
$12,990
0
$0
2
$18,530
FILES CLOSED FOR INCOMPLETENESS
0
$0
5
$65,150
9
$40,723
0
$0
0
$0
0
$0
Aggregated Statistics For Year 1999 (Based on 3 partial tracts)
A) FHA, FSA/RHS & VA Home Purchase Loans
B) Conventional Home Purchase Loans
C) Refinancings
D) Home Improvement Loans
F) Non-occupant Loans on < 5 Family Dwellings (A B C & D)
2002 - 2018 National Fire Incident Reporting System (NFIRS) incidents
Based on the data from the years 2002 - 2018 the average number of fires per year is 29. The highest number of reported fire incidents - 54 took place in 2010, and the least - 3 in 2002. The data has a rising trend.
When looking into fire subcategories, the most reports belonged to: Outside Fires (65.8%), and Structure Fires (15.8%).
Fire incident types reported to NFIRS in Zip Code 72437
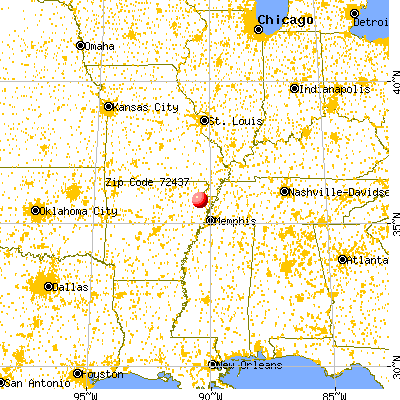


 Nearest zip codes: 72414, 72417, 72447, 72419, 72411, 72377.
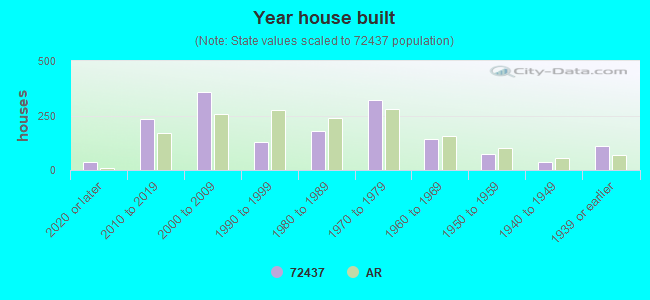


 Based on the data from the years 2002 - 2018 the average number of fires per year is 29. The highest number of reported fire incidents - 54 took place in 2010, and the least - 3 in 2002. The data has a rising trend.
 When looking into fire subcategories, the most reports belonged to: Outside Fires (65.8%), and Structure Fires (15.8%).