Estimated zip code population in 2022: 8,665 Zip code population in 2010: 7,322 Zip code population in 2000: 6,730
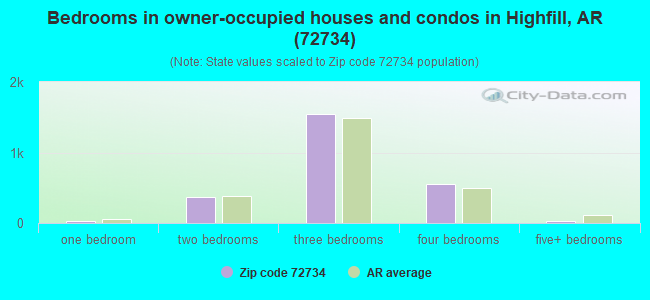
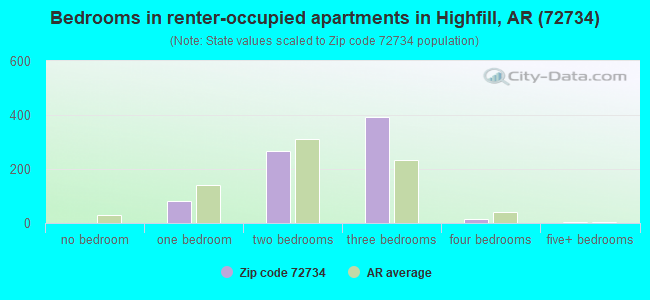
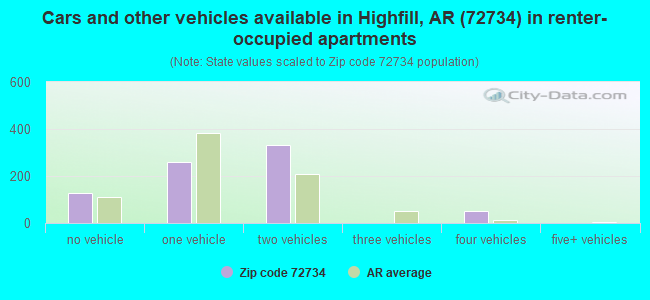
Houses and condos: 3,548 Renter-occupied apartments: 774
% of renters here:
23%
State:
34%
March 2022 cost of living index in zip code 72734: 79.9 (low, U.S. average is 100)
Land area: 81.6 sq. mi. Water area: 1.1 sq. mi.
Population density: 106 people per square mile
(very low).
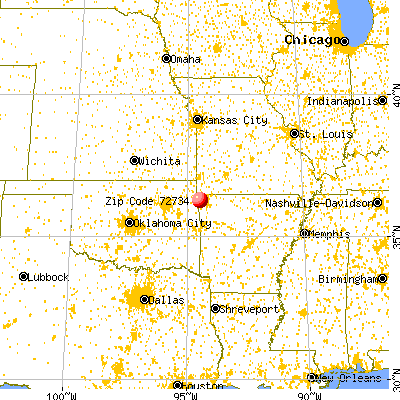
OSM Map
General Map
Google Map
MSN Map
OSM Map
General Map
Google Map
MSN Map
OSM Map
General Map
Google Map
MSN Map
OSM Map
General Map
Google Map
MSN Map
Please wait while loading the map...
Real estate property taxes paid for housing units in 2022:
This zip code:
0.6% ($1,135)
Arkansas:
0.5% ($977)
Median real estate property taxes paid for housing units with mortgages in 2022: $1,206 (0.7%) Median real estate property taxes paid for housing units with no mortgage in 2022: $1,039 (0.3%)
Business Search- 14 Million verified businesses
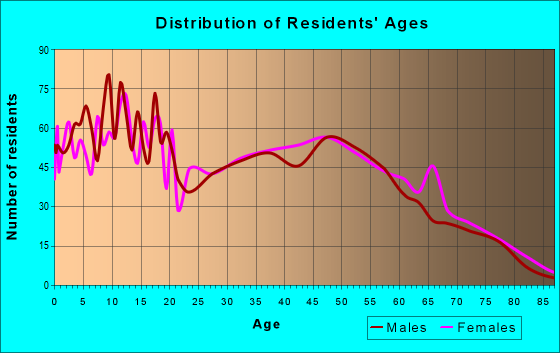
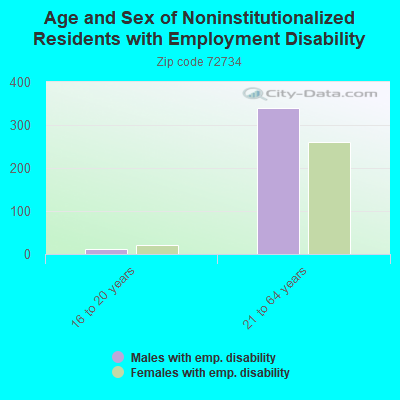
Males: 4,380
(50.5%)
Females: 4,285
(49.5%)
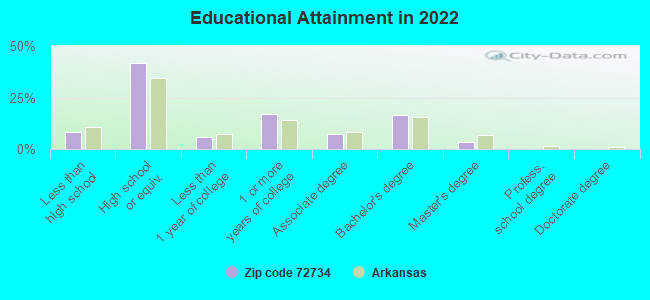
For population 25 years and over in 72734:
High school or higher: 91.0%
Bachelor's degree or higher: 19.8%
Graduate or professional degree: 3.4%
Unemployed: 0.6%
Mean travel time to work (commute): 25.3 minutes
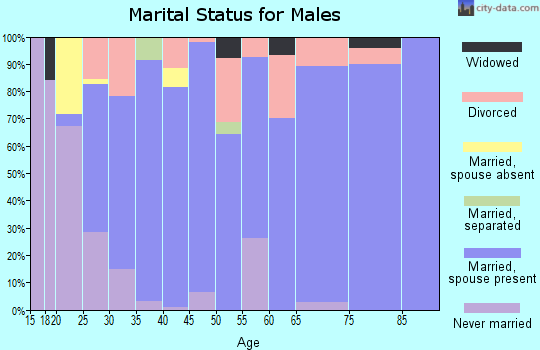
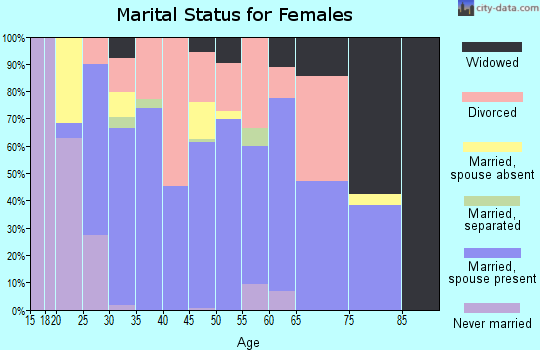
For population 15 years and over in 72734:
Never married: 19.7%
Now married: 62.2%
Separated: 1.4%
Widowed: 2.8%
Divorced: 13.9%
Zip code 72734 compared to state average:
Unemployed percentage significantly below state average.
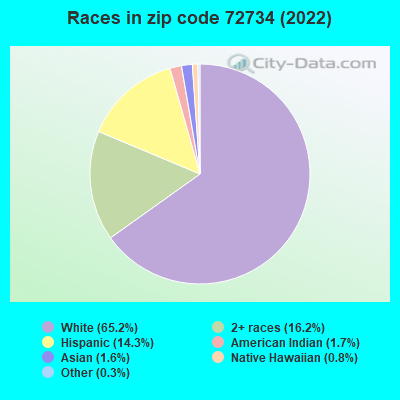
Black race population percentage significantly below state average.
Hispanic race population percentage above state average.
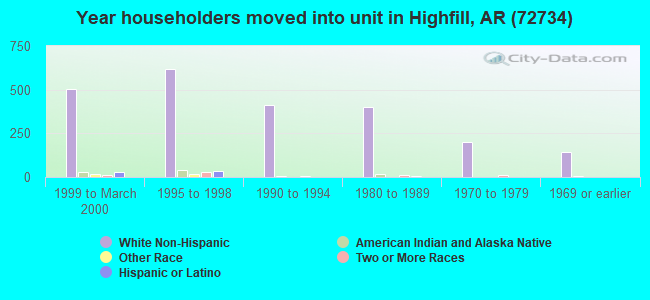
Length of stay since moving in significantly above state average.
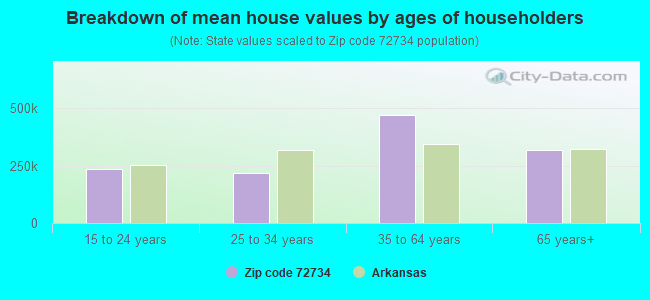
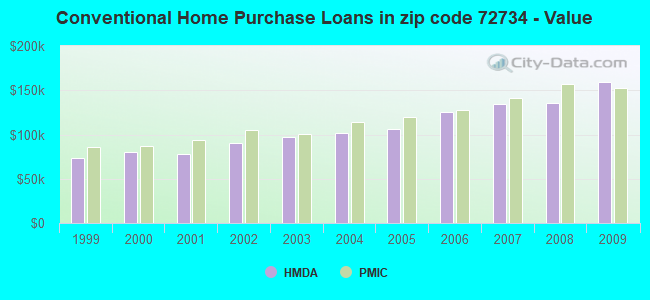
Estimated median house/condo value in 2022: $195,300
72734:
$195,300
Arkansas:
$179,800
According to our research of Arkansas and other state lists, there were 9 registered sex offenders living in 72734 zip code as of April 26, 2024. The ratio of all residents to sex offenders in zip code 72734 is 881 to 1. The ratio of registered sex offenders to all residents in this zip code is lower than the state average.
Median resident age:
This zip code:
38.6 years
Arkansas median age:
38.9 years
Average household size:
This zip code:
2.6 people
Arkansas:
2.4 people
Averages for the 2020 tax year for zip code 72734, filed in 2021:
Average Adjusted Gross Income (AGI) in 2020: $56,320 (Individual Income Tax Returns)
Here:
$56,320
State:
$64,872
Salary/wage: $50,141 (reported on 86.2% of returns)
Here:
$50,141
State:
$50,644
(% of AGI for various income ranges: 1276.7% for AGIs below $25k, 3965.0% for AGIs $25k-50k, 6613.5% for AGIs $50k-75k, 10321.3% for AGIs $75k-100k, 16220.0% for AGIs $100k-200k, 50842.5% for AGIs over 200k)
Taxable interest for individuals: $1,096 (reported on 21.5% of returns)
This zip code:
$1,096
Arkansas:
$1,857
(% of AGI for various income ranges: 9.8% for AGIs below $25k, 16.2% for AGIs $25k-50k, 28.1% for AGIs $50k-75k, 65.7% for AGIs $75k-100k, 97.2% for AGIs $100k-200k, 300.0% for AGIs over 200k)
Ordinary dividends: $1,789 (reported on 9.9% of returns)
Here:
$1,789
State:
$21,681
(% of AGI for various income ranges: 9.8% for AGIs below $25k, 14.9% for AGIs $25k-50k, 20.0% for AGIs $50k-75k, 38.7% for AGIs $75k-100k, 44.4% for AGIs $100k-200k, 372.5% for AGIs over 200k)
Net capital gain/loss in AGI: +$14,785 (reported on 11.0% of returns)
Here:
+$14,785
State:
+$22,815
(% of AGI for various income ranges: 16.9% for AGIs below $25k, 45.0% for AGIs $25k-50k, 117.0% for AGIs $50k-75k, 232.6% for AGIs $75k-100k, 595.2% for AGIs $100k-200k, 7172.5% for AGIs over 200k)
Profit/loss from business: +$9,807 (reported on 16.3% of returns)
Here:
+$9,807
State:
+$9,743
(% of AGI for various income ranges: 180.7% for AGIs below $25k, 150.2% for AGIs $25k-50k, 144.2% for AGIs $50k-75k, 247.4% for AGIs $75k-100k, 394.8% for AGIs $100k-200k, 1925.0% for AGIs over 200k)
Taxable individual retirement arrangement distribution: $15,320 (reported on 5.5% of returns)
72734:
$15,320
Arkansas:
$18,502
(% of AGI for various income ranges: 49.4% for AGIs below $25k, 52.9% for AGIs $25k-50k, 119.1% for AGIs $50k-75k, 167.8% for AGIs $75k-100k, 516.8% for AGIs $100k-200k)
Total itemized deductions: $37,524 (reported on 4.7% of returns)
Here:
$37,524
State:
$52,840
(% of AGI for various income ranges: 217.9% for AGIs $50k-75k, 227.4% for AGIs $75k-100k, 928.8% for AGIs $100k-200k, 6492.5% for AGIs over 200k)
Charity contributions: $18,545 (reported on 3.0% of returns)
Here:
$18,545
State:
$35,735
(% of AGI for various income ranges: 88.1% for AGIs $50k-75k, 290.0% for AGIs $100k-200k, 2340.0% for AGIs over 200k)
Taxes paid: $6,582 (reported on 4.7% of returns)
72734:
$6,582
State:
$7,196
(% of AGI for various income ranges: 29.8% for AGIs $50k-75k, 54.3% for AGIs $75k-100k, 170.8% for AGIs $100k-200k, 1097.5% for AGIs over 200k)
Earned income credit: $2,391 (reported on 20.4% of returns)
Here:
$2,391
State:
$2,546
(% of AGI for various income ranges: 117.6% for AGIs below $25k, 86.5% for AGIs $25k-50k, 3.0% for AGIs $50k-75k)
Percentage of individuals using paid preparers for their 2020 taxes: 95.3%
Here:
95%
State:
94%
(% for various income ranges: 95.0% for AGIs below $25k, 95.1% for AGIs $25k-50k, 96.4% for AGIs $50k-75k, 94.1% for AGIs $75k-100k, 97.6% for AGIs $100k-200k, 90.0% for AGIs over 200k)
Averages for the 2012 tax year for zip code 72734, filed in 2013:
Average Adjusted Gross Income (AGI) in 2012: $41,515 (Individual Income Tax Returns)
Here:
$41,515
State:
$52,148
Salary/wage: $38,355 (reported on 87.4% of returns)
Here:
$38,355
State:
$41,669
(% of AGI for various income ranges: 78.8% for AGIs below $25k, 85.9% for AGIs $25k-50k, 85.0% for AGIs $50k-75k, 79.7% for AGIs $75k-100k, 78.9% for AGIs $100k-200k, 57.1% for AGIs over 200k)
Taxable interest for individuals: $1,209 (reported on 23.9% of returns)
This zip code:
$1,209
Arkansas:
$1,648
(% of AGI for various income ranges: 0.8% for AGIs below $25k, 0.7% for AGIs $25k-50k, 0.6% for AGIs $50k-75k, 0.8% for AGIs $75k-100k, 0.9% for AGIs $100k-200k)
Ordinary dividends: $2,045 (reported on 10.9% of returns)
Here:
$2,045
State:
$20,675
(% of AGI for various income ranges: 0.7% for AGIs below $25k, 0.3% for AGIs $25k-50k, 0.2% for AGIs $50k-75k, 0.6% for AGIs $75k-100k, 1.2% for AGIs $100k-200k)
Net capital gain/loss in AGI: +$8,446 (reported on 9.1% of returns)
Here:
+$8,446
State:
+$15,222
(% of AGI for various income ranges: 0.4% for AGIs below $25k, 0.3% for AGIs $25k-50k, 0.9% for AGIs $50k-75k, 2.0% for AGIs $75k-100k, 7.0% for AGIs $100k-200k)
Profit/loss from business: +$8,393 (reported on 15.8% of returns)
Here:
+$8,393
State:
+$9,665
(% of AGI for various income ranges: 7.5% for AGIs below $25k, 3.1% for AGIs $25k-50k, 1.6% for AGIs $50k-75k, 1.8% for AGIs $75k-100k, 4.5% for AGIs $100k-200k)
Taxable individual retirement arrangement distribution: $10,506 (reported on 5.6% of returns)
72734:
$10,506
Arkansas:
$13,644
(% of AGI for various income ranges: 2.1% for AGIs below $25k, 1.3% for AGIs $25k-50k, 1.6% for AGIs $50k-75k, 2.8% for AGIs $75k-100k)
Total itemized deductions: $19,055 (25% of AGI, reported on 22.5% of returns)
Here:
$19,055
State:
$23,276
Here:
24.5% of AGI
State:
19.1% of AGI
(% of AGI for various income ranges: 5.0% for AGIs below $25k, 6.8% for AGIs $25k-50k, 10.3% for AGIs $50k-75k, 14.2% for AGIs $75k-100k, 14.8% for AGIs $100k-200k, 12.8% for AGIs over 200k)
Charity contributions: $5,634 (reported on 15.4% of returns)
Here:
$5,634
State:
$5,996
(% of AGI for various income ranges: 1.0% for AGIs below $25k, 1.1% for AGIs $25k-50k, 1.9% for AGIs $50k-75k, 2.7% for AGIs $75k-100k, 3.3% for AGIs $100k-200k, 4.3% for AGIs over 200k)
Taxes paid: $5,444 (reported on 22.1% of returns)
72734:
$5,444
State:
$7,941
(% of AGI for various income ranges: 0.7% for AGIs below $25k, 1.2% for AGIs $25k-50k, 2.6% for AGIs $50k-75k, 3.8% for AGIs $75k-100k, 5.6% for AGIs $100k-200k, 5.7% for AGIs over 200k)
Earned income credit: $2,519 (reported on 27.0% of returns)
Here:
$2,519
State:
$2,455
(% of AGI for various income ranges: 8.6% for AGIs below $25k, 1.9% for AGIs $25k-50k)
Percentage of individuals using paid preparers for their 2012 taxes: 71.6%
Here:
72%
State:
61%
(% for various income ranges: 70.0% for AGIs below $25k, 69.5% for AGIs $25k-50k, 76.2% for AGIs $50k-75k, 78.3% for AGIs $75k-100k, 68.8% for AGIs $100k-200k, 100.0% for AGIs over 200k)
Averages for the 2004 tax year for zip code 72734, filed in 2005:
Average Adjusted Gross Income (AGI) in 2004: $34,461 (Individual Income Tax Returns)
Here:
$34,461
State:
$39,270
Salary/wage: $33,195 (reported on 86.7% of returns)
Here:
$33,195
State:
$34,079
(% of AGI for various income ranges: 220.4% for AGIs below $10k, 80.9% for AGIs $10k-25k, 88.9% for AGIs $25k-50k, 86.6% for AGIs $50k-75k, 83.3% for AGIs $75k-100k, 62.2% for AGIs over 100k)
Taxable interest for individuals: $1,398 (reported on 33.5% of returns)
This zip code:
$1,398
Arkansas:
$1,904
(% of AGI for various income ranges: 9.9% for AGIs below $10k, 2.1% for AGIs $10k-25k, 1.0% for AGIs $25k-50k, 1.2% for AGIs $50k-75k, 1.0% for AGIs $75k-100k, 1.2% for AGIs over 100k)
Taxable dividends: $1,110 (reported on 12.6% of returns)
Here:
$1,110
State:
$5,995
(% of AGI for various income ranges: 2.6% for AGIs below $10k, 0.5% for AGIs $10k-25k, 0.2% for AGIs $25k-50k, 0.3% for AGIs $50k-75k, 0.1% for AGIs $75k-100k, 0.9% for AGIs over 100k)
Net capital gain/loss: +$12,914 (reported on 13.1% of returns)
Here:
+$12,914
State:
+$10,430
(% of AGI for various income ranges: 2.9% for AGIs below $10k, 2.3% for AGIs $10k-25k, 1.6% for AGIs $25k-50k, 2.2% for AGIs $50k-75k, 1.9% for AGIs $75k-100k, 18.4% for AGIs over 100k)
Profit/loss from business: +$5,625 (reported on 17.5% of returns)
Here:
+$5,625
State:
+$7,823
(% of AGI for various income ranges: 4.3% for AGIs below $10k, 8.8% for AGIs $10k-25k, 2.7% for AGIs $25k-50k, 1.6% for AGIs $50k-75k, 2.5% for AGIs $75k-100k, 0.5% for AGIs over 100k)
IRA payment deduction: $3,683 (reported on 1.5% of returns)
72734:
$3,683
Arkansas:
$3,204
Total itemized deductions: $15,940 (23% of AGI, reported on 20.7% of returns)
Here:
$15,940
State:
$18,389
Here:
23.2% of AGI
State:
21.0% of AGI
(% of AGI for various income ranges: 28.5% for AGIs below $10k, 5.8% for AGIs $10k-25k, 7.5% for AGIs $25k-50k, 9.9% for AGIs $50k-75k, 12.9% for AGIs $75k-100k, 11.9% for AGIs over 100k)
Charity contributions deductions: $5,084 (7% of AGI, reported on 16.1% of returns)
Here:
$5,084
State:
$4,725
Here:
6.9% of AGI
State:
5.1% of AGI
(% of AGI for various income ranges: 2.0% for AGIs below $10k, 1.5% for AGIs $10k-25k, 1.6% for AGIs $25k-50k, 2.3% for AGIs $50k-75k, 2.5% for AGIs $75k-100k, 4.4% for AGIs over 100k)
Total tax: $4,196 (reported on 70.4% of returns)
72734:
$4,196
State:
$6,047
(% of AGI for various income ranges: 9.1% for AGIs below $10k, 4.2% for AGIs $10k-25k, 5.5% for AGIs $25k-50k, 7.7% for AGIs $50k-75k, 9.8% for AGIs $75k-100k, 17.5% for AGIs over 100k)
Earned income credit: $1,824 (reported on 23.5% of returns)
Here:
$1,824
State:
$1,909
Percentage of individuals using paid preparers for their 2004 taxes: 74.3%
Here:
74%
State:
67%
(% for various income ranges: 63.6% for AGIs below $10k, 76.7% for AGIs $10k-25k, 77.7% for AGIs $25k-50k, 78.2% for AGIs $50k-75k, 73.9% for AGIs $75k-100k, 77.8% for AGIs over 100k)
Likely homosexual households (counted as self-reported same-sex unmarried-partner households)
Lesbian couples: 0.1% of all households
Gay men: 0.1% of all households
Household received Food Stamps/SNAP in the past 12 months: 362 Household did not receive Food Stamps/SNAP in the past 12 months: 2,951
Women who had a birth in the past 12 months: 129 (106 now married, 25 unmarried) Women who did not have a birth in the past 12 months: 1,774 (1,167 now married, 613 unmarried)
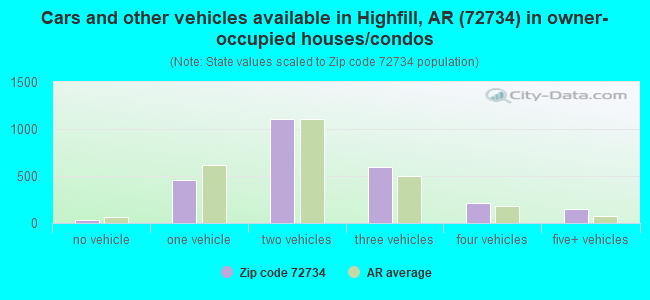
Housing units in zip code 72734 with a mortgage: 1,394 (31 second mortgage, 8 both second mortgage and home equity loan) Median monthly owner costs for units with a mortgage: $1,121 Median monthly owner costs for units without a mortgage: $416
Residents with income below the poverty level in 2022:
This zip code:
12.6%
Whole state:
16.8%
Residents with income below 50% of the poverty level in 2022:
This zip code:
2.0%
Whole state:
8.5%
Median number of rooms in houses and condos:
Here:
6.1
State:
6.1
Median number of rooms in apartments:
Here:
4.7
State:
4.3
Notable locations in this zip code not listed on our city pages
Notable locations in zip code 72734: Camp Ozark (A), Gentry Police Department (B), Gentry Fire Department (C), Highfill Fire Department (D). Display/hide their locations on the map
Churches in zip code 72734 include: Highfill Methodist Church (A), Highfill Baptist Church (B), Church of God in Christ (C), Rocky Comfort Church (D). Display/hide their locations on the map
Cemeteries: Armstrong Cemetery (1), Flint Creek Cemetery (2), Bloomfield Cemetery (3), Gentry Cemetery (4), Callum Cemetery (5), Highfill Cemetery (6), Dixon Cemetery (7). Display/hide their locations on the map
Size of family households: 1,275 2-persons, 545 3-persons, 284 4-persons, 360 5-persons, 92 6-persons, 50 7-or-more-persons
Size of nonfamily households: 626 1-person, 21 2-persons, 36 4-persons
1,190 married couples with children.
617 single-parent households (90 men, 527 women).
90.1% of residents of 72734 zip code speak English at home.
7.3% of residents speak Spanish at home (32% very well, 13% well, 7% not well, 48% not at all).
1.0% of residents speak other Indo-European language at home (52% very well, 18% well, 30% not well).
1.4% of residents speak Asian or Pacific Island language at home (33% very well, 29% well, 38% not well).
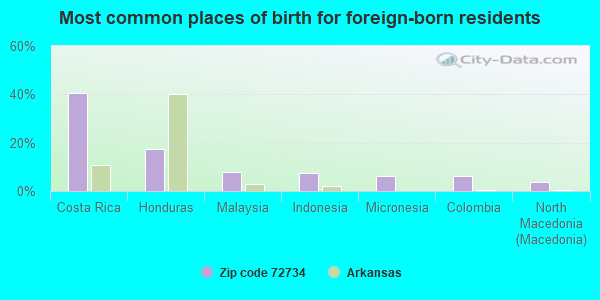
Foreign born population: 432 (5.0%) (37.2% of them are naturalized citizens)
This zip code:
5.0%
Whole state:
5.1%
41%Costa Rica
17%Honduras
8%Malaysia
7%Indonesia
6%Micronesia
6%Colombia
4%North Macedonia (Macedonia)
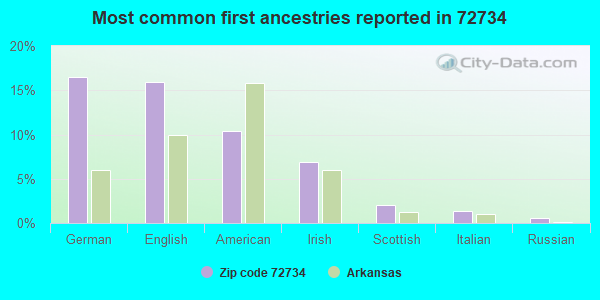
17%German
16%English
10%American
7%Irish
2%Scottish
1%Italian
1%Russian
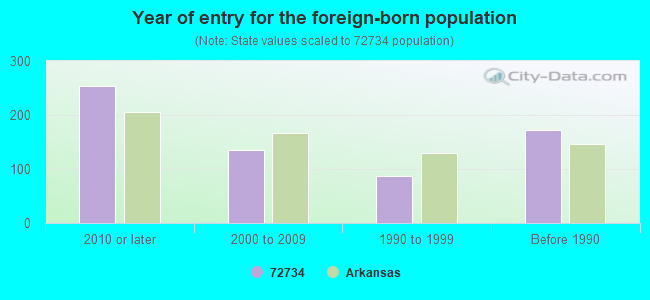
Year of entry for the foreign-born population
2542010 or later
1352000 to 2009
871990 to 1999
172Before 1990
Facilities with environmental interests located in this zip code:
FILMPRINT, INC. (12579 PIONEER LANE in GENTRY, AR)
AIR MINOR (AIRS/AFS) CRITERIA AND HAZARDOUS AIR POLLUTANT INVENTORY (Inventory of air pollution sources) STATE MASTER (PDS) - AIR-1097-A, AIR PROGRAM, AIR-1097-AOP-R0, AIR MAJOR, AIR-1097-AR-1, AIR PROGRAM, AIR-1097-AR-2, AIR MINOR, AIR-1097-AR-3, AIR-1097-AR-4, (Resource Conservation and Recovery Act (tracking hazardous waste)) Business SIC classification: PLASTICS, FOIL, AND COATED PAPER BAGS; UNSUPPORTED PLASTICS FILM AND SHEET Business NAICS classification: COMMERCIAL FLEXOGRAPHIC PRINTING. Organizations: LUIS MARTINEZ (CONTACT/OPERATOR)
, DONALD COX (CONTACT/OWNER)
Alternative names: ARKANSAS FILMS INC, FILM PRINT INCORPORATED
ADAMS TRUSS, INC (12420 COLLINS RD in GENTRY, AR)
AIR MINOR (AIRS/AFS) STATE MASTER (PDS) - AIR-1749-A, AIR MINOR, WATER-ARR00A148, NPDES STORMWATER PERMIT Business SIC classification: FABRICATED STRUCTURAL METAL
GENTRY HIGH SCHOOL (995 PIONEER LANE in GENTRY, AR)
(Geographic Names Information System) (National Center for Education Statistics) - STATE ID-0403014
GENTRY INTERMEDIATE SCHOOL (302 W. SECOND ST. in GENTRY, AR)
(Geographic Names Information System) (National Center for Education Statistics) - STATE ID-0403013, ICIS-, ENFORCEMENT/COMPLIANCE ACTIVITY
GENTRY MIDDLE SCHOOL (1055 PIONEER LANE in GENTRY, AR)
(Geographic Names Information System) (National Center for Education Statistics) - STATE ID-0403015
GENTRY PRIMARY SCHOOL (302 W. SECOND ST. in GENTRY, AR)
(Geographic Names Information System) (National Center for Education Statistics) - STATE ID-0403016
GENTRY WW TREATMENT PLANT (12351 OVERDALE ROAD in GENTRY, AR)
National Pollutant Discharge Elimination System NON-MAJOR (Tracking pollutant discharge elimination systems) - permit Business SIC classification: SEWERAGE SYSTEMS Alternative names: GENTRY, CITY OF, GENTRY, CITY OF-WWTP
BLOOMFIELD AUTO BODY (11664 S CRIPPS RD in GENTRY, AR)
Conditionally Exempt Small Quantity Generators, less than 100 kg/month of hazardous waste (Resource Conservation and Recovery Act (tracking hazardous waste)) - notification
JIMS AUTO SERVICE (HWY 59 S 2.5 S in GENTRY, AR)
Conditionally Exempt Small Quantity Generators, less than 100 kg/month of hazardous waste (Resource Conservation and Recovery Act (tracking hazardous waste)) - notification Organizations: JENSEN JIM (CONTACT/OWNER)
KENNY RUTHERFORD R & R FARM (.75M S HWY 12 RUTHERFORD RD in GENTRY, AR)
USED OIL PROGRAM (Resource Conservation and Recovery Act (tracking hazardous waste)) Organizations: RUTHERFORD KENNY (CONTACT/OWNER)
Housing units lacking complete plumbing facilities: 6.4% Housing units lacking complete kitchen facilities: 7.1%
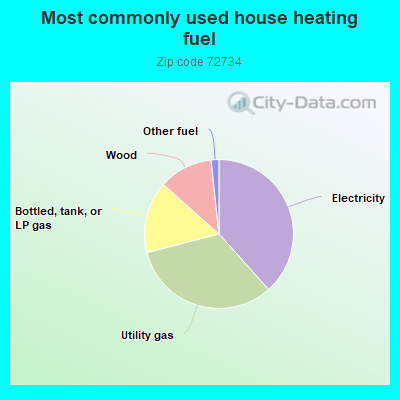
38.4%Electricity
32.6%Utility gas
15.6%Bottled, tank, or LP gas
11.7%Wood
1.7%Other fuel
Population in 1990: 5,145. Population change in the 1990s: +1,585 (+30.8%).
Place of birth for U.S.-born residents:
This state: 4,068
Northeast: 129
Midwest: 1,416
South: 1,649
West: 807
48% of the 72734 zip code residents lived in the same house 5 years ago. Out of people who lived in different houses, 60% lived in this county. Out of people who lived in different counties, 50% lived in Arkansas.
93% of the 72734 zip code residents lived in the same house 1 year ago. Out of people who lived in different houses, 44% moved from this county. Out of people who lived in different houses, 24% moved from different state. Out of people who lived in different houses, 35% moved from abroad.
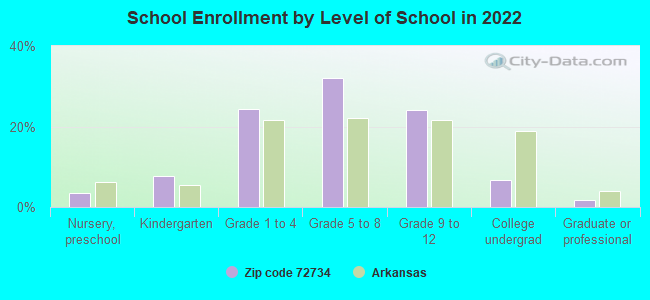
Private vs. public school enrollment:
Students in private schools in grades 1 to 8 (elementary and middle school): 114
Here:
12.7%
Arkansas:
10.5%
Students in private schools in grades 9 to 12 (high school): 82
Here:
21.2%
Arkansas:
8.7%
Students in private undergraduate colleges: 39
Here:
37.0%
Arkansas:
19.4%
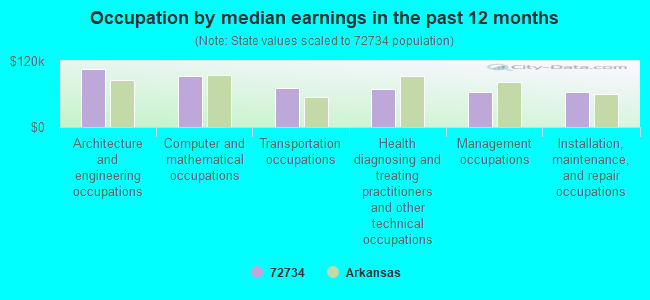
Occupation by median earnings in the past 12 months ($)
105,882Architecture and engineering occupations
93,593Computer and mathematical occupations
70,354Transportation occupations
69,541Health diagnosing and treating practitioners and other technical occupations
64,079Management occupations
63,898Installation, maintenance, and repair occupations
Top industries in this zip code by the number of employees in 2005:
2002 - 2018 National Fire Incident Reporting System (NFIRS) incidents
Based on the data from the years 2002 - 2018 the average number of fire incidents per year is 79. The highest number of reported fires - 135 took place in 2012, and the least - 43 in 2002. The data has a rising trend.
When looking into fire subcategories, the most incidents belonged to: Outside Fires (47.9%), and Structure Fires (38.8%).
Fire incident types reported to NFIRS in Zip Code 72734


 Nearest zip codes: 72722, 72761, 72736, 72747, 72719, 72739.


 Based on the data from the years 2002 - 2018 the average number of fire incidents per year is 79. The highest number of reported fires - 135 took place in 2012, and the least - 43 in 2002. The data has a rising trend.
 When looking into fire subcategories, the most incidents belonged to: Outside Fires (47.9%), and Structure Fires (38.8%).