Estimated zip code population in 2022: 23,011 Zip code population in 2010: 21,211 Zip code population in 2000: 16,132
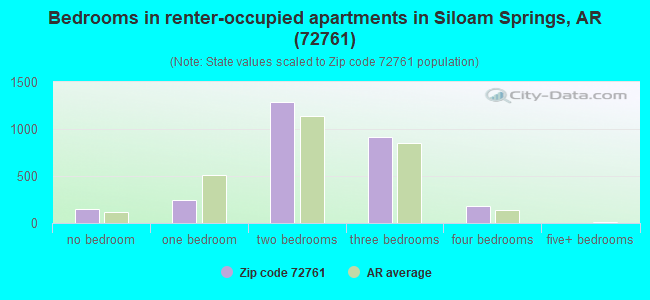
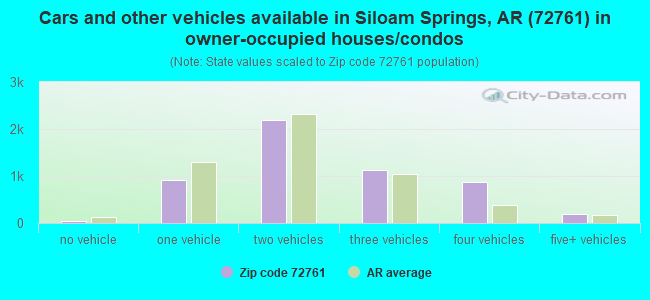
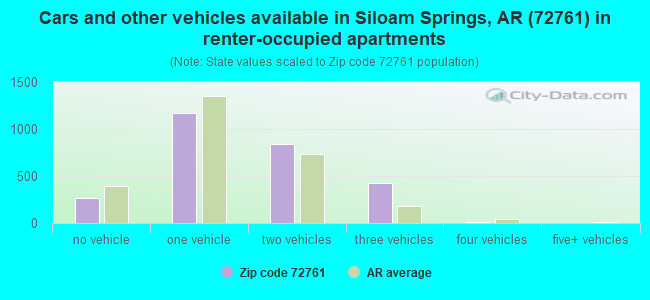
Houses and condos: 8,810 Renter-occupied apartments: 2,788
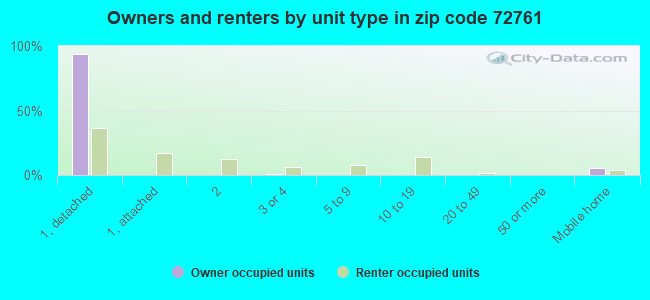
% of renters here:
34%
State:
34%
March 2022 cost of living index in zip code 72761: 82.5 (low, U.S. average is 100)
Land area: 114.0 sq. mi. Water area: 1.1 sq. mi.
Population density: 202 people per square mile
(very low).
OSM Map
General Map
Google Map
MSN Map
OSM Map
General Map
Google Map
MSN Map
OSM Map
General Map
Google Map
MSN Map
OSM Map
General Map
Google Map
MSN Map
Please wait while loading the map...
Real estate property taxes paid for housing units in 2022:
This zip code:
0.6% ($1,300)
Arkansas:
0.5% ($977)
Median real estate property taxes paid for housing units with mortgages in 2022: $1,470 (0.6%) Median real estate property taxes paid for housing units with no mortgage in 2022: $1,057 (0.5%)
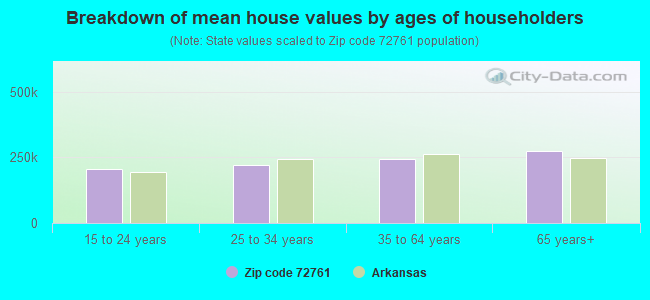
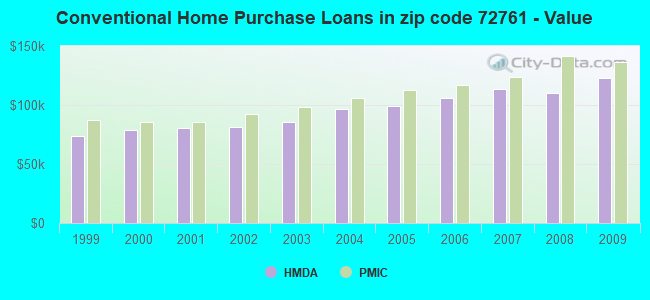
Estimated median house/condo value in 2022: $227,629
72761:
$227,629
Arkansas:
$179,800
According to our research of Arkansas and other state lists, there were 23 registered sex offenders living in 72761 zip code as of April 27, 2024. The ratio of all residents to sex offenders in zip code 72761 is 983 to 1. The ratio of registered sex offenders to all residents in this zip code is lower than the state average.
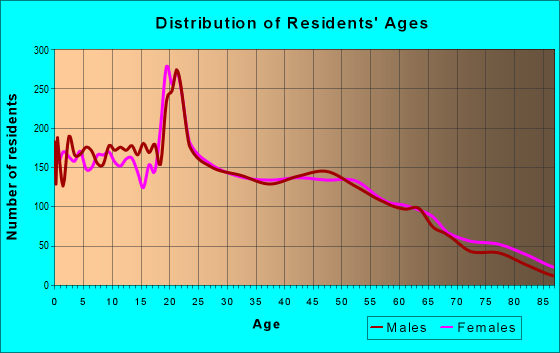
Median resident age:
This zip code:
32.7 years
Arkansas median age:
38.9 years
Average household size:
This zip code:
2.7 people
Arkansas:
2.4 people
Averages for the 2020 tax year for zip code 72761, filed in 2021:
Average Adjusted Gross Income (AGI) in 2020: $55,745 (Individual Income Tax Returns)
Here:
$55,745
State:
$64,872
Salary/wage: $49,062 (reported on 85.5% of returns)
Here:
$49,062
State:
$50,644
(% of AGI for various income ranges: 1269.9% for AGIs below $25k, 3816.6% for AGIs $25k-50k, 7042.7% for AGIs $50k-75k, 9987.6% for AGIs $75k-100k, 17897.2% for AGIs $100k-200k, 68602.5% for AGIs over 200k)
Taxable interest for individuals: $1,180 (reported on 23.1% of returns)
This zip code:
$1,180
Arkansas:
$1,857
(% of AGI for various income ranges: 10.7% for AGIs below $25k, 13.0% for AGIs $25k-50k, 28.7% for AGIs $50k-75k, 45.1% for AGIs $75k-100k, 111.6% for AGIs $100k-200k, 1123.8% for AGIs over 200k)
Ordinary dividends: $3,309 (reported on 12.2% of returns)
Here:
$3,309
State:
$21,681
(% of AGI for various income ranges: 14.5% for AGIs below $25k, 17.9% for AGIs $25k-50k, 41.1% for AGIs $50k-75k, 69.8% for AGIs $75k-100k, 160.0% for AGIs $100k-200k, 1776.2% for AGIs over 200k)
Net capital gain/loss in AGI: +$19,746 (reported on 11.7% of returns)
Here:
+$19,746
State:
+$22,815
(% of AGI for various income ranges: 9.2% for AGIs below $25k, 26.8% for AGIs $25k-50k, 66.4% for AGIs $50k-75k, 153.5% for AGIs $75k-100k, 451.2% for AGIs $100k-200k, 22613.8% for AGIs over 200k)
Profit/loss from business: +$9,865 (reported on 16.8% of returns)
Here:
+$9,865
State:
+$9,743
(% of AGI for various income ranges: 169.6% for AGIs below $25k, 159.3% for AGIs $25k-50k, 200.8% for AGIs $50k-75k, 328.1% for AGIs $75k-100k, 519.4% for AGIs $100k-200k, 1662.5% for AGIs over 200k)
Taxable individual retirement arrangement distribution: $18,288 (reported on 6.6% of returns)
72761:
$18,288
Arkansas:
$18,502
(% of AGI for various income ranges: 49.3% for AGIs below $25k, 69.0% for AGIs $25k-50k, 169.0% for AGIs $50k-75k, 257.8% for AGIs $75k-100k, 623.4% for AGIs $100k-200k, 2507.5% for AGIs over 200k)
Total itemized deductions: $41,356 (reported on 5.8% of returns)
Here:
$41,356
State:
$52,840
(% of AGI for various income ranges: 28.3% for AGIs below $25k, 60.8% for AGIs $25k-50k, 130.0% for AGIs $50k-75k, 310.6% for AGIs $75k-100k, 1234.1% for AGIs $100k-200k, 13812.5% for AGIs over 200k)
Charity contributions: $15,545 (reported on 4.8% of returns)
Here:
$15,545
State:
$35,735
(% of AGI for various income ranges: 5.4% for AGIs below $25k, 14.9% for AGIs $25k-50k, 42.2% for AGIs $50k-75k, 85.6% for AGIs $75k-100k, 464.1% for AGIs $100k-200k, 3980.0% for AGIs over 200k)
Taxes paid: $6,725 (reported on 5.8% of returns)
72761:
$6,725
State:
$7,196
(% of AGI for various income ranges: 2.4% for AGIs below $25k, 8.1% for AGIs $25k-50k, 21.9% for AGIs $50k-75k, 56.3% for AGIs $75k-100k, 288.8% for AGIs $100k-200k, 1606.2% for AGIs over 200k)
Earned income credit: $2,558 (reported on 20.4% of returns)
Here:
$2,558
State:
$2,546
(% of AGI for various income ranges: 123.5% for AGIs below $25k, 90.5% for AGIs $25k-50k, 2.5% for AGIs $50k-75k)
Percentage of individuals using paid preparers for their 2020 taxes: 95.0%
Here:
95%
State:
94%
(% for various income ranges: 93.7% for AGIs below $25k, 94.8% for AGIs $25k-50k, 95.9% for AGIs $50k-75k, 95.7% for AGIs $75k-100k, 96.5% for AGIs $100k-200k, 100.0% for AGIs over 200k)
Averages for the 2012 tax year for zip code 72761, filed in 2013:
Average Adjusted Gross Income (AGI) in 2012: $43,030 (Individual Income Tax Returns)
Here:
$43,030
State:
$52,148
Salary/wage: $37,968 (reported on 87.0% of returns)
Here:
$37,968
State:
$41,669
(% of AGI for various income ranges: 79.3% for AGIs below $25k, 85.0% for AGIs $25k-50k, 81.7% for AGIs $50k-75k, 80.7% for AGIs $75k-100k, 77.0% for AGIs $100k-200k, 44.7% for AGIs over 200k)
Taxable interest for individuals: $1,032 (reported on 24.9% of returns)
This zip code:
$1,032
Arkansas:
$1,648
(% of AGI for various income ranges: 1.2% for AGIs below $25k, 0.5% for AGIs $25k-50k, 0.4% for AGIs $50k-75k, 0.5% for AGIs $75k-100k, 0.7% for AGIs $100k-200k, 0.4% for AGIs over 200k)
Ordinary dividends: $2,999 (reported on 12.9% of returns)
Here:
$2,999
State:
$20,675
(% of AGI for various income ranges: 0.8% for AGIs below $25k, 0.6% for AGIs $25k-50k, 0.4% for AGIs $50k-75k, 0.5% for AGIs $75k-100k, 0.9% for AGIs $100k-200k, 2.8% for AGIs over 200k)
Net capital gain/loss in AGI: +$5,351 (reported on 10.4% of returns)
Here:
+$5,351
State:
+$15,222
(% of AGI for various income ranges: 0.6% for AGIs below $25k, 0.3% for AGIs $25k-50k, 0.3% for AGIs $50k-75k, 1.1% for AGIs $75k-100k, 2.1% for AGIs $100k-200k, 4.5% for AGIs over 200k)
Profit/loss from business: +$8,202 (reported on 16.5% of returns)
Here:
+$8,202
State:
+$9,665
(% of AGI for various income ranges: 7.8% for AGIs below $25k, 3.1% for AGIs $25k-50k, 2.2% for AGIs $50k-75k, 1.6% for AGIs $75k-100k, 3.3% for AGIs $100k-200k, 1.0% for AGIs over 200k)
Taxable individual retirement arrangement distribution: $14,303 (reported on 7.7% of returns)
72761:
$14,303
Arkansas:
$13,644
(% of AGI for various income ranges: 2.4% for AGIs below $25k, 2.0% for AGIs $25k-50k, 2.5% for AGIs $50k-75k, 3.4% for AGIs $75k-100k, 3.0% for AGIs $100k-200k, 2.2% for AGIs over 200k)
Total itemized deductions: $21,448 (24% of AGI, reported on 23.6% of returns)
Here:
$21,448
State:
$23,276
Here:
23.7% of AGI
State:
19.1% of AGI
(% of AGI for various income ranges: 6.2% for AGIs below $25k, 7.4% for AGIs $25k-50k, 11.5% for AGIs $50k-75k, 14.1% for AGIs $75k-100k, 16.2% for AGIs $100k-200k, 16.7% for AGIs over 200k)
Charity contributions: $5,796 (reported on 18.5% of returns)
Here:
$5,796
State:
$5,996
(% of AGI for various income ranges: 0.9% for AGIs below $25k, 1.2% for AGIs $25k-50k, 2.5% for AGIs $50k-75k, 3.5% for AGIs $75k-100k, 3.8% for AGIs $100k-200k, 3.3% for AGIs over 200k)
Taxes paid: $5,862 (reported on 23.4% of returns)
72761:
$5,862
State:
$7,941
(% of AGI for various income ranges: 0.8% for AGIs below $25k, 1.3% for AGIs $25k-50k, 2.7% for AGIs $50k-75k, 4.0% for AGIs $75k-100k, 5.9% for AGIs $100k-200k, 4.8% for AGIs over 200k)
Earned income credit: $2,449 (reported on 25.6% of returns)
Here:
$2,449
State:
$2,455
(% of AGI for various income ranges: 8.0% for AGIs below $25k, 1.7% for AGIs $25k-50k)
Percentage of individuals using paid preparers for their 2012 taxes: 72.2%
Here:
72%
State:
61%
(% for various income ranges: 70.9% for AGIs below $25k, 74.3% for AGIs $25k-50k, 72.5% for AGIs $50k-75k, 69.8% for AGIs $75k-100k, 69.6% for AGIs $100k-200k, 100.0% for AGIs over 200k)
Averages for the 2004 tax year for zip code 72761, filed in 2005:
Average Adjusted Gross Income (AGI) in 2004: $37,655 (Individual Income Tax Returns)
Here:
$37,655
State:
$39,270
Salary/wage: $33,163 (reported on 87.3% of returns)
Here:
$33,163
State:
$34,079
(% of AGI for various income ranges: 103.3% for AGIs below $10k, 81.5% for AGIs $10k-25k, 87.1% for AGIs $25k-50k, 84.9% for AGIs $50k-75k, 80.2% for AGIs $75k-100k, 53.3% for AGIs over 100k)
Taxable interest for individuals: $1,576 (reported on 34.3% of returns)
This zip code:
$1,576
Arkansas:
$1,904
(% of AGI for various income ranges: 4.4% for AGIs below $10k, 2.0% for AGIs $10k-25k, 1.1% for AGIs $25k-50k, 1.3% for AGIs $50k-75k, 0.9% for AGIs $75k-100k, 1.6% for AGIs over 100k)
Taxable dividends: $1,885 (reported on 15.7% of returns)
Here:
$1,885
State:
$5,995
(% of AGI for various income ranges: 2.0% for AGIs below $10k, 0.8% for AGIs $10k-25k, 0.5% for AGIs $25k-50k, 0.4% for AGIs $50k-75k, 0.7% for AGIs $75k-100k, 1.4% for AGIs over 100k)
Net capital gain/loss: +$20,928 (reported on 14.2% of returns)
Here:
+$20,928
State:
+$10,430
(% of AGI for various income ranges: 0.5% for AGIs below $10k, 0.7% for AGIs $10k-25k, 1.2% for AGIs $25k-50k, 1.3% for AGIs $50k-75k, 3.9% for AGIs $75k-100k, 26.8% for AGIs over 100k)
Profit/loss from business: +$6,979 (reported on 16.1% of returns)
Here:
+$6,979
State:
+$7,823
(% of AGI for various income ranges: 7.1% for AGIs below $10k, 5.3% for AGIs $10k-25k, 2.9% for AGIs $25k-50k, 1.6% for AGIs $50k-75k, 2.9% for AGIs $75k-100k, 2.7% for AGIs over 100k)
IRA payment deduction: $3,192 (reported on 2.0% of returns)
72761:
$3,192
Arkansas:
$3,204
(% of AGI for various income ranges: 0.1% for AGIs $10k-25k, 0.1% for AGIs $25k-50k, 0.2% for AGIs $50k-75k, 0.2% for AGIs $75k-100k, 0.2% for AGIs over 100k)
Self-employed pension: $9,200 (reported on 0.1% of returns)
Here:
$9,200
Arkansas:
$14,742
Total itemized deductions: $18,027 (24% of AGI, reported on 25.8% of returns)
Here:
$18,027
State:
$18,389
Here:
23.5% of AGI
State:
21.0% of AGI
(% of AGI for various income ranges: 9.2% for AGIs below $10k, 6.8% for AGIs $10k-25k, 9.2% for AGIs $25k-50k, 12.6% for AGIs $50k-75k, 15.8% for AGIs $75k-100k, 16.9% for AGIs over 100k)
Charity contributions deductions: $5,702 (7% of AGI, reported on 21.1% of returns)
Here:
$5,702
State:
$4,725
Here:
6.9% of AGI
State:
5.1% of AGI
(% of AGI for various income ranges: 0.6% for AGIs below $10k, 1.3% for AGIs $10k-25k, 2.0% for AGIs $25k-50k, 3.1% for AGIs $50k-75k, 3.8% for AGIs $75k-100k, 5.5% for AGIs over 100k)
Total tax: $4,734 (reported on 70.2% of returns)
72761:
$4,734
State:
$6,047
(% of AGI for various income ranges: 3.5% for AGIs below $10k, 3.8% for AGIs $10k-25k, 5.7% for AGIs $25k-50k, 7.6% for AGIs $50k-75k, 9.9% for AGIs $75k-100k, 15.6% for AGIs over 100k)
Earned income credit: $1,828 (reported on 21.2% of returns)
Here:
$1,828
State:
$1,909
Percentage of individuals using paid preparers for their 2004 taxes: 72.8%
Here:
73%
State:
67%
(% for various income ranges: 61.0% for AGIs below $10k, 79.2% for AGIs $10k-25k, 74.6% for AGIs $25k-50k, 71.8% for AGIs $50k-75k, 70.2% for AGIs $75k-100k, 81.2% for AGIs over 100k)
Likely homosexual households (counted as self-reported same-sex unmarried-partner households)
Lesbian couples: 0.4% of all households
Gay men: 0.1% of all households
Household received Food Stamps/SNAP in the past 12 months: 428 Household did not receive Food Stamps/SNAP in the past 12 months: 7,751
Women who had a birth in the past 12 months: 346 (279 now married, 70 unmarried) Women who did not have a birth in the past 12 months: 4,961 (2,205 now married, 2,754 unmarried)
Housing units in zip code 72761 with a mortgage: 3,258 (212 second mortgage, 114 both second mortgage and home equity loan) Houses without a mortgage: 12
Median monthly owner costs for units with a mortgage: $1,326 Median monthly owner costs for units without a mortgage: $446
Residents with income below the poverty level in 2022:
This zip code:
14.9%
Whole state:
16.8%
Residents with income below 50% of the poverty level in 2022:
This zip code:
6.9%
Whole state:
8.5%
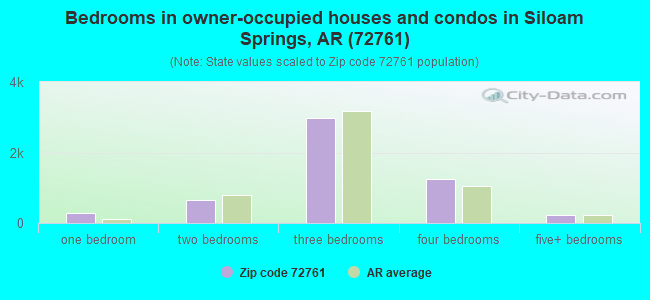
Median number of rooms in houses and condos:
Here:
6.3
State:
6.1
Median number of rooms in apartments:
Here:
4.2
State:
4.3
Notable locations in this zip code not listed on our city pages
Notable locations in zip code 72761: Fairmount Community Hall (A), Spring Harbor Landing (B), Arkansas Baptist Camp (C), Dawn Hill Country Club (D), Siloam Springs Golf Course (E), Martin Community Hall (F), Siloam Springs Fire Department Station 1 Headquarters (G), Siloam Springs Fire Department Station 3 (H), Siloam Springs Advanced Life Support / Fire Station 2 (I), Siloam Springs Police Department (J), Norwood Community Hall (K), Siloam Springs Advanced Life Support / Rescue Station 2 (L), Pulse Emergency Medical Services (M), Gallatin Fire Station (N). Display/hide their locations on the map
Churches in zip code 72761 include: Pleasant Hill Church (A), Landmark Church (B), Nicodemus Community Church (C), Shady Grove Baptist Church (D), Gum Springs Baptist Church (E), Baptist Assembly Church (F), Norwood Prairie Presbyterian Church (G), Norwood Church (H). Display/hide their locations on the map
Cemeteries: Martin Cemetery (1), Lone Elm Cemetery (2), Oak Hill Cemetery (3), Fairmount Cemetery (4), Gunter Cemetery (5), Old Baptist Cemetery (6), Yell Cemetery (7). Display/hide their locations on the map
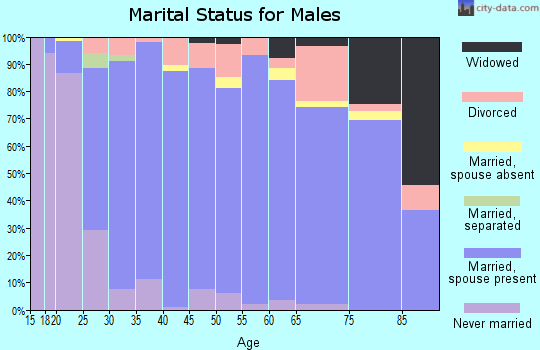
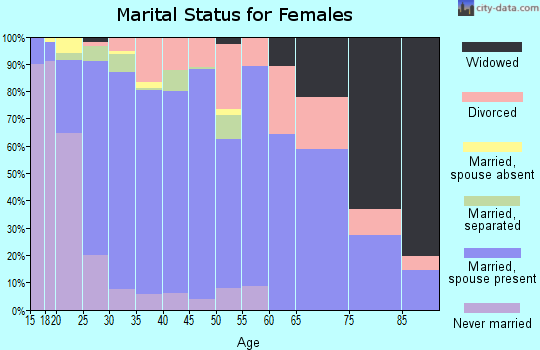
3,925 married couples with children.
1,362 single-parent households (164 men, 1,198 women).
82.4% of residents of 72761 zip code speak English at home.
15.7% of residents speak Spanish at home (54% very well, 22% well, 13% not well, 11% not at all).
1.3% of residents speak other Indo-European language at home (48% very well, 5% well, 47% not at all).
0.9% of residents speak Asian or Pacific Island language at home (75% very well, 4% well, 21% not well).
0.1% of residents speak other language at home (100% very well).
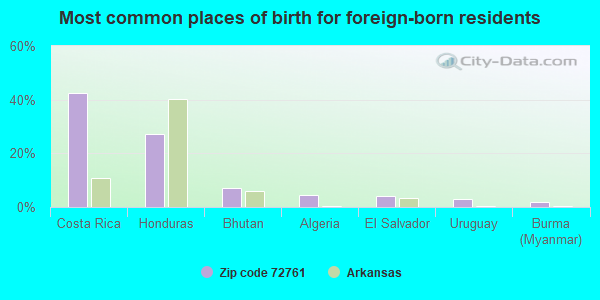
Foreign born population: 2,489 (10.8%) (20.7% of them are naturalized citizens)
This zip code:
10.8%
Whole state:
5.1%
43%Costa Rica
27%Honduras
7%Bhutan
4%Algeria
4%El Salvador
3%Uruguay
2%Burma (Myanmar)
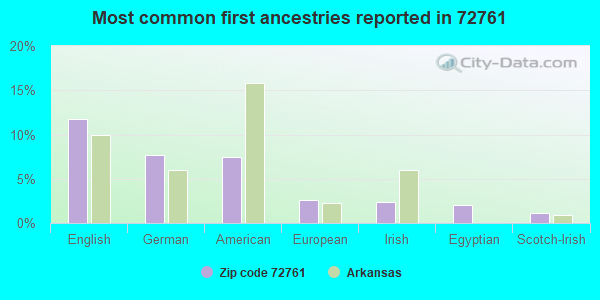
12%English
8%German
8%American
3%European
2%Irish
2%Egyptian
1%Scotch-Irish
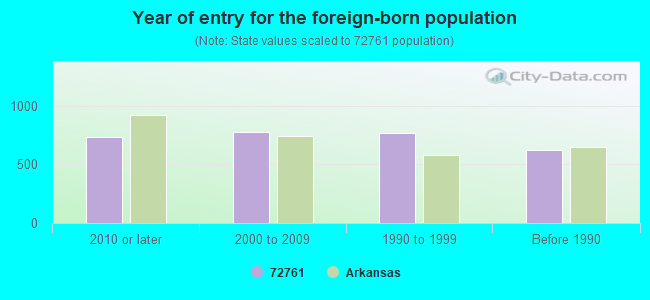
Year of entry for the foreign-born population
7322010 or later
7792000 to 2009
7631990 to 1999
622Before 1990
Major facilities with environmental interests located in this zip code:
GATES CORP. (1801 N. LINCOLN in SILOAM SPRINGS, AR)
AIR MAJOR (AIRS/AFS) (Integrated Compliance Information System) - ICIS-HQ-2004-5112, FORMAL ENFORCEMENT ACTION CRITERIA AND HAZARDOUS AIR POLLUTANT INVENTORY (Inventory of air pollution sources) STATE MASTER (PDS) - AIR-0378-AOP-R0, AIR MAJOR, AIR-0378-AOP-R1, AIR-0378-AOP-R2, AIR-0378-AOP-R3, AIR-0378-AOP-R4, AIR-0378-AOP-R5, AIR-0378-AR-10, AIR MINOR, AIR-0378-AR-7, AIR PROGRAM, AIR-0378-AR-8, AIR-0378-AR-9, WATER-AR0039641, National Pollutant Discharge Elimination System Permit, WATER-ARR00B715, NPDES STORMWATER PERMIT Conditionally Exempt Small Quantity Generators, less than 100 kg/month of hazardous waste (Resource Conservation and Recovery Act (tracking hazardous waste)) HAZARDOUS WASTE BIENNIAL REPORTER (Resource Conservation and Recovery Act (tracking hazardous waste)) TRI REPORTER (Tracking of toxic chemicals releasing facilities) Business SIC classification: RUBBER AND PLASTICS HOSE AND BELTING Business NAICS classification: RUBBER AND PLASTICS HOSES AND BELTING MANUFACTURING. Organizations: THE GATES CORPORATION (CONTACT/OPERATOR)
Alternative names: GATES RUBBER CO., GATES RUBBER COMPANY, THE GATES RUBBER COMPANY
FRANKLIN ELECTRIC (650 U.S. HWY. 412 W. in SILOAM SPRINGS, AR)
CRITERIA AND HAZARDOUS AIR POLLUTANT INVENTORY (Inventory of air pollution sources) STATE MASTER (PDS) - AIR-0154-I, INCINERATOR, WATER-ARR00A763, NPDES STORMWATER PERMIT HAZARDOUS WASTE BIENNIAL REPORTER (Resource Conservation and Recovery Act (tracking hazardous waste)) Large Quantity Generators, more that 1000 kg of hazardous waste/month (Resource Conservation and Recovery Act (tracking hazardous waste)) - notification TRI REPORTER (Tracking of toxic chemicals releasing facilities) Business SIC classification: MOTORS AND GENERATORS Business NAICS classification: PUMP AND PUMPING EQUIPMENT MANUFACTURING.; MOTOR AND GENERATOR MANUFACTURING.; MOTOR AND GENERATOR MANUFACTURING. Organizations: FRANKLIN ELECTRIC MANUFACTURING INC. (CONTACT/OPERATOR)
, JIM HEIFNER (CONTACT/OPERATOR)
, FRANKLIN ELECTRIC CO INC (CONTACT/OWNER)
Alternative names: FRANKLIN ELECTRIC CO INC
SIMMONS FOODS INCORPORATED PLANT 2 (MAIN STREET & HICO STREET in SILOAM SPRINGS, AR)
(Integrated Compliance Information System) - ICIS-06-2005-3597, ENFORCEMENT/COMPLIANCE ACTIVITY FORMAL ENFORCEMENT ACTION (Integrated Compliance Information System) - ICIS-06-2005-3597, ENFORCEMENT/COMPLIANCE ACTIVITY TRI REPORTER (Tracking of toxic chemicals releasing facilities) Business SIC classification: POULTRY SLAUGHTERING AND PROCESSING Alternative names: SIMMONS FOODS INC.
ASIAN AMERICAN GROCERY & DELI (2190 S LINCOLN in SILOAM SPRINGS, AR)
STATE MASTER (PDS) - RST-04001685, UNDERGROUND STORAGE TANK PROGRAM (Resource Conservation and Recovery Act (tracking hazardous waste)) Organizations: XIONG,MAO,XIONG,YER,YANG,LOU (CONTACT/GENERAL)
, LOU YANG (CONTACT/OPERATOR)
LA-Z-BOY CHAIR COMPANY (1445 E. TAHLEQUAH in SILOAM SPRINGS, AR)
STATE MASTER (PDS) - WATER-ARR00B598, National Pollutant Discharge Elimination System Permit, WATER-ARR10A400, NPDES STORMWATER PERMIT, RST-04000221, FACILITY (Resource Conservation and Recovery Act (tracking hazardous waste)) Business NAICS classification: UPHOLSTERED HOUSEHOLD FURNITURE MANUFACTURING. Organizations: LA-Z-BOY CHAIR COMPANY MONROE MICHIGAN (CONTACT/OWNER)
Alternative names: LA Z BOY
HICKMAN, DARYL CHEV-OLDS (490 HWY 412 E in SILOAM SPRINGS, AR)
STATE MASTER (PDS) - RST-04000050, FACILITY Conditionally Exempt Small Quantity Generators, less than 100 kg/month of hazardous waste (Resource Conservation and Recovery Act (tracking hazardous waste)) - notification Organizations: HICKMAN, DARYL CHEVROLET-OLDS-IN (CONTACT/GENERAL)
, HICKMAN DARYL (CONTACT/OWNER)
Alternative names: DARYL HICKMAN CHEVROLET OLDS INC
KECK FARMS RED DIRT MINING (20767 KECK ROAD in SILOAM SPRINGS, AR)
National Pollutant Discharge Elimination System NON-MAJOR (Tracking pollutant discharge elimination systems) - permit STATE MASTER (PDS) - MINING-0580-MN, MINE OPERATING PERMIT, WATER-ARR150293, NPDES STORMWATER PERMIT Business SIC classification: MANAGEMENT SERVICES
SILOAM SPRINGS, CITY OF (975 ANDERSON AVE. in SILOAM SPRINGS, AR)
National Pollutant Discharge Elimination System MAJOR (Tracking pollutant discharge elimination systems) - permit National Pollutant Discharge Elimination System MAJOR (Tracking pollutant discharge elimination systems) - permit STATE MASTER (PDS) - AIR-0216-I, INCINERATOR, WATER-0199-W, NPDES STORMWATER PERMIT, WATER-0347-W, RST-04000169, FACILITY Business SIC classification: SEWERAGE SYSTEMS Alternative names: SILOAM SPRINGS POLLUTION CONTROL PLANT
SILOAM SPRINGS MIDDLE SCHOOL (1500 NORTH MT OLIVE in SILOAM SPRINGS, AR)
(Geographic Names Information System) (National Center for Education Statistics) - STATE ID-0406049
SILOAM SPRINGS HIGH SCHOOL (1500 WEST JEFFERSON in SILOAM SPRINGS, AR)
(Geographic Names Information System) (National Center for Education Statistics) - STATE ID-0406050
SOUTHSIDE WEST ELEM. SCHOOL (MAPLE STREET in SILOAM SPRINGS, AR)
(National Center for Education Statistics) - STATE ID-0406051 Organizations: SILOAM SPRINGS (SCHOOL DISTRICT)
SILOAM SPRINGS WATERWORKS (20610 SMITH FIELD DR in SILOAM SPRINGS, AR)
ENFORCEMENT/COMPLIANCE ACTIVITY (Integrated Compliance Information System) COMMUNITY WATER SYSTEM (SDWIS) - SDWIS-AR0000056 1, WATER TREATMENT PLANT Business SIC classification: SEWERAGE SYSTEMS Alternative names: SILOAM SPRINGS, CITY OF - WASTE WATER TREATMENT PLANT
SOUTHSIDE EAST ELEM. SCHOOL (WRIGHT STREET in SILOAM SPRINGS, AR)
(National Center for Education Statistics) - STATE ID-0406047, ICIS-, ENFORCEMENT/COMPLIANCE ACTIVITY Organizations: SILOAM SPRINGS (SCHOOL DISTRICT)
Housing units lacking complete plumbing facilities: 4.5% Housing units lacking complete kitchen facilities: 5.6%
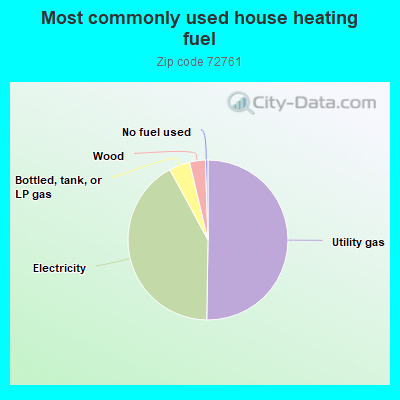
50.2%Utility gas
41.8%Electricity
4.2%Bottled, tank, or LP gas
3.2%Wood
0.5%No fuel used
Population in 1990: 11,677. Population change in the 1990s: +4,455 (+38.2%).
Place of birth for U.S.-born residents:
This state: 9,836
Northeast: 431
Midwest: 3,226
South: 4,145
West: 2,644
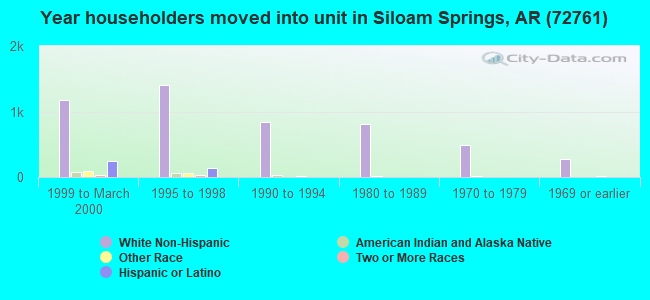
47% of the 72761 zip code residents lived in the same house 5 years ago. Out of people who lived in different houses, 43% lived in this county. Out of people who lived in different counties, 50% lived in Arkansas.
91% of the 72761 zip code residents lived in the same house 1 year ago. Out of people who lived in different houses, 63% moved from this county. Out of people who lived in different houses, 11% moved from different county within same state. Out of people who lived in different houses, 20% moved from different state. Out of people who lived in different houses, 2% moved from abroad.
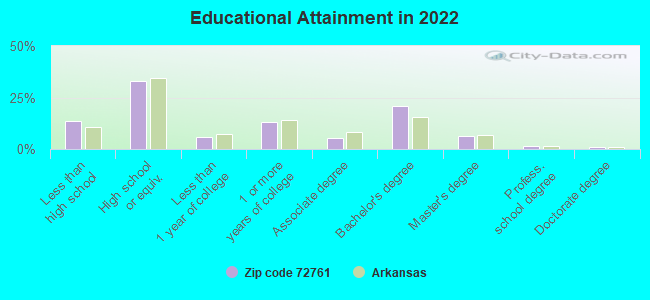
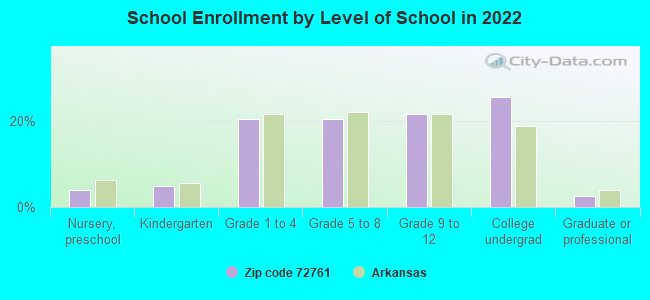
Private vs. public school enrollment:
Students in private schools in grades 1 to 8 (elementary and middle school): 224
Here:
9.0%
Arkansas:
10.5%
Students in private schools in grades 9 to 12 (high school): 84
Here:
6.3%
Arkansas:
8.7%
Students in private undergraduate colleges: 1,154
Here:
68.1%
Arkansas:
19.4%
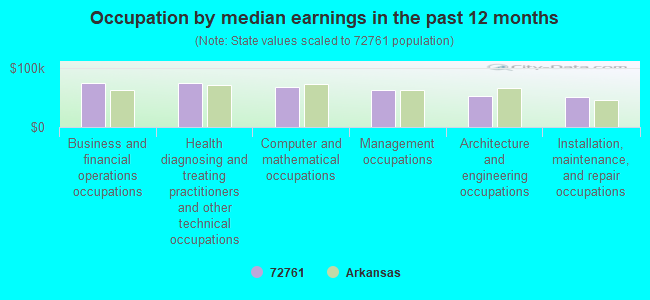
Occupation by median earnings in the past 12 months ($)
74,130Business and financial operations occupations
73,725Health diagnosing and treating practitioners and other technical occupations
67,608Computer and mathematical occupations
62,856Management occupations
53,053Architecture and engineering occupations
49,755Installation, maintenance, and repair occupations
Companies with federal contracts located in this zip code:
JOHN BROWN UNIVERSITY (2000 WEST UNIVERSITY STREE in SILOAM SPRINGS, AR) : $202,887 in 6 contractsfrom 2003 to 2005
Contracts for Tuition, Registration, and Membership Fees by Air Force Signed by year:2000: $0; 2001: $0; 2002: $0; 2003: $26,088; 2004: $64,584; 2005: $112,215; 2006: $0.
Biggest contracts:
$40,585 with Air Force for Tuition, Registration, and Membership Fees. Signed on 2005-03-18. Completion date: 2005-09-30.
$36,990, same as above.Signed on 2005-04-04. Completion date: 2005-09-30.
$34,640, same as above.Signed on 2005-10-17. Completion date: 2005-10-17.
$32,652, same as above.Signed on 2004-09-01. Completion date: 2004-09-30.
BOBBY YOUNKIN AIRSHOWS, INC (4504 SMITH FIELD DR in SILOAM SPRINGS, AR; small business) : $35,718 in 9 contractsfrom 2002 to 2006
Contracts for Recreational Services, Other Professional Services, Lease or Rental of Equipment -- Aircraft and Airframe Structural Components by Air Force, Army Signed by year:2000: $0; 2001: $0; 2002: $5,000; 2003: $13,500; 2004: $12,500; 2005: $500; 2006: $4,218.
Biggest contracts:
$13,000 with Air Force for Recreational Services. Taking place in GA. Signed on 2005-01-06. Completion date: 2005-04-09.
$12,500 with Air Force for Other Professional Services. Taking place in MO. Signed on 2004-12-08. Completion date: 2004-12-19.
$12,500 with Air Force for Lease or Rental of Equipment -- Aircraft and Airframe Structural Components. Taking place in NE. Signed on 2005-04-29. Completion date: 2005-08-28.
$9,000 with Army for Other Professional Services. Signed on 2003-03-10. Completion date: 2003-05-10.
A & A EQUIPMENT INC (4298 HIGHWAY 412 E in SILOAM SPRINGS, AR; small business)
$22,833 with Army for Miscellaneous Maintenance and Repair Shop Specialized Equipment. Signed on 2005-08-12. Completion date: 2005-09-09.
Top industries in this zip code by the number of employees in 2005:
Administrative and Support and Waste Management and Remediation Services: Temporary Help Services (250-499 employees: 2 establishments, 100-249 employees: 1 establishment)
Educational Services: Colleges, Universities, and Professional Schools (500-999: 1)
2002 - 2018 National Fire Incident Reporting System (NFIRS) incidents
Based on the data from the years 2002 - 2018 the average number of fire incidents per year is 99. The highest number of reported fires - 167 took place in 2006, and the least - 66 in 2002. The data has a rising trend.
When looking into fire subcategories, the most incidents belonged to: Outside Fires (48.6%), and Structure Fires (35.6%).
Fire incident types reported to NFIRS in Zip Code 72761


 Nearest zip codes: 72734, 72769, 72704, 72722, 72744, 74964.
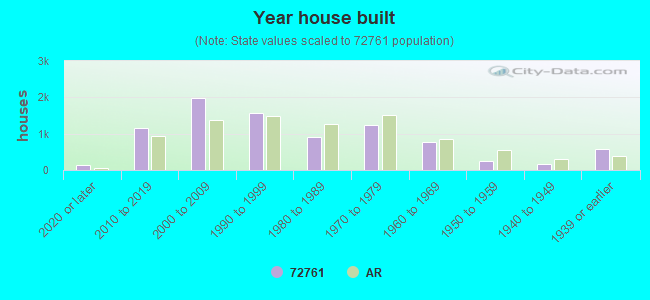


 Based on the data from the years 2002 - 2018 the average number of fire incidents per year is 99. The highest number of reported fires - 167 took place in 2006, and the least - 66 in 2002. The data has a rising trend.
 When looking into fire subcategories, the most incidents belonged to: Outside Fires (48.6%), and Structure Fires (35.6%).