Estimated zip code population in 2022: 2,988 Zip code population in 2010: 2,786 Zip code population in 2000: 2,714
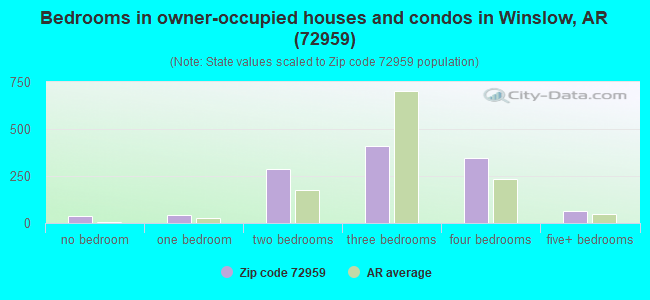
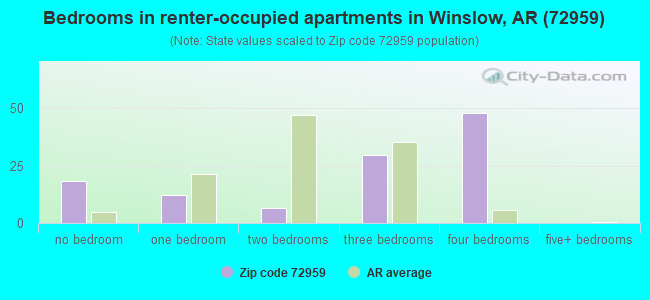
Houses and condos: 1,619 Renter-occupied apartments: 116
% of renters here:
9%
State:
34%
March 2022 cost of living index in zip code 72959: 80.0 (low, U.S. average is 100)
Land area: 178.8 sq. mi. Water area: 0.4 sq. mi.
Population density: 17 people per square mile
(very low).
OSM Map
General Map
Google Map
MSN Map
OSM Map
General Map
Google Map
MSN Map
OSM Map
General Map
Google Map
MSN Map
OSM Map
General Map
Google Map
MSN Map
Please wait while loading the map...
Real estate property taxes paid for housing units in 2022:
This zip code:
0.3% ($565)
Arkansas:
0.5% ($977)
Median real estate property taxes paid for housing units with mortgages in 2022: $566 (0.3%) Median real estate property taxes paid for housing units with no mortgage in 2022: $566 (0.3%)
Averages for the 2020 tax year for zip code 72959, filed in 2021:
Average Adjusted Gross Income (AGI) in 2020: $48,980 (Individual Income Tax Returns)
Here:
$48,980
State:
$64,872
Salary/wage: $49,397 (reported on 76.1% of returns)
Here:
$49,397
State:
$50,644
(% of AGI for various income ranges: 1092.0% for AGIs below $25k, 3647.7% for AGIs $25k-50k, 5990.7% for AGIs $50k-75k, 10010.0% for AGIs $75k-100k, 15751.4% for AGIs $100k-200k)
Taxable interest for individuals: $697 (reported on 26.5% of returns)
This zip code:
$697
Arkansas:
$1,857
(% of AGI for various income ranges: 16.7% for AGIs below $25k, 31.8% for AGIs $25k-50k, 20.0% for AGIs $50k-75k, 48.6% for AGIs $75k-100k, 38.6% for AGIs $100k-200k)
Ordinary dividends: $3,283 (reported on 10.6% of returns)
Here:
$3,283
State:
$21,681
(% of AGI for various income ranges: 7.7% for AGIs below $25k, 35.9% for AGIs $25k-50k, 60.0% for AGIs $50k-75k, 297.1% for AGIs $100k-200k)
Net capital gain/loss in AGI: +$5,354 (reported on 11.5% of returns)
Here:
+$5,354
State:
+$22,815
(% of AGI for various income ranges: 11.7% for AGIs below $25k, 63.2% for AGIs $25k-50k, 108.6% for AGIs $50k-75k, 528.6% for AGIs $100k-200k)
Profit/loss from business: +$8,120 (reported on 17.7% of returns)
Here:
+$8,120
State:
+$9,743
(% of AGI for various income ranges: 208.3% for AGIs below $25k, 208.2% for AGIs $25k-50k, 318.6% for AGIs $50k-75k, 135.7% for AGIs $75k-100k)
Taxable individual retirement arrangement distribution: $12,750 (reported on 7.1% of returns)
72959:
$12,750
Arkansas:
$18,502
(% of AGI for various income ranges: 73.3% for AGIs below $25k, 103.2% for AGIs $25k-50k, 409.3% for AGIs $50k-75k)
Total itemized deductions: $24,700 (reported on 2.7% of returns)
Here:
$24,700
State:
$52,840
(% of AGI for various income ranges: 1058.6% for AGIs $75k-100k)
Taxes paid: $5,567 (reported on 2.7% of returns)
72959:
$5,567
State:
$7,196
(% of AGI for various income ranges: 238.6% for AGIs $75k-100k)
Earned income credit: $2,400 (reported on 20.4% of returns)
Here:
$2,400
State:
$2,546
(% of AGI for various income ranges: 106.3% for AGIs below $25k, 105.9% for AGIs $25k-50k)
Percentage of individuals using paid preparers for their 2020 taxes: 92.0%
Here:
92%
State:
94%
(% for various income ranges: 88.6% for AGIs below $25k, 93.1% for AGIs $25k-50k, 88.9% for AGIs $50k-75k, 100.0% for AGIs $75k-100k, 100.0% for AGIs $100k-200k, 100.0% for AGIs over 200k)
Averages for the 2012 tax year for zip code 72959, filed in 2013:
Average Adjusted Gross Income (AGI) in 2012: $37,746 (Individual Income Tax Returns)
Here:
$37,746
State:
$52,148
Salary/wage: $35,911 (reported on 82.5% of returns)
Here:
$35,911
State:
$41,669
(% of AGI for various income ranges: 63.4% for AGIs below $25k, 82.0% for AGIs $25k-50k, 83.6% for AGIs $50k-75k, 84.4% for AGIs $75k-100k, 73.6% for AGIs $100k-200k)
Taxable interest for individuals: $671 (reported on 24.7% of returns)
This zip code:
$671
Arkansas:
$1,648
(% of AGI for various income ranges: 0.9% for AGIs below $25k, 0.5% for AGIs $25k-50k, 0.4% for AGIs $50k-75k, 0.2% for AGIs $75k-100k, 0.3% for AGIs $100k-200k)
Ordinary dividends: $958 (reported on 12.4% of returns)
Here:
$958
State:
$20,675
(% of AGI for various income ranges: 0.3% for AGIs below $25k, 0.6% for AGIs $25k-50k, 0.3% for AGIs $50k-75k, 0.2% for AGIs $75k-100k)
Net capital gain/loss in AGI: +$1,762 (reported on 8.2% of returns)
Here:
+$1,762
State:
+$15,222
(% of AGI for various income ranges: 0.7% for AGIs $25k-50k, 0.4% for AGIs $50k-75k, 0.7% for AGIs $75k-100k)
Profit/loss from business: +$8,116 (reported on 25.8% of returns)
Here:
+$8,116
State:
+$9,665
(% of AGI for various income ranges: 19.3% for AGIs below $25k, 4.9% for AGIs $25k-50k, 1.3% for AGIs $50k-75k, 6.6% for AGIs $75k-100k)
Taxable individual retirement arrangement distribution: $10,417 (reported on 6.2% of returns)
72959:
$10,417
Arkansas:
$13,644
Total itemized deductions: $17,106 (25% of AGI, reported on 17.5% of returns)
Here:
$17,106
State:
$23,276
Here:
25.1% of AGI
State:
19.1% of AGI
(% of AGI for various income ranges: 4.8% for AGIs below $25k, 5.0% for AGIs $25k-50k, 7.3% for AGIs $50k-75k, 8.4% for AGIs $75k-100k, 14.8% for AGIs $100k-200k)
Charity contributions: $3,673 (reported on 11.3% of returns)
Here:
$3,673
State:
$5,996
(% of AGI for various income ranges: 1.4% for AGIs below $25k, 1.3% for AGIs $50k-75k, 1.3% for AGIs $75k-100k, 2.0% for AGIs $100k-200k)
Taxes paid: $4,844 (reported on 16.5% of returns)
72959:
$4,844
State:
$7,941
(% of AGI for various income ranges: 1.1% for AGIs $25k-50k, 1.7% for AGIs $50k-75k, 2.1% for AGIs $75k-100k, 5.7% for AGIs $100k-200k)
Earned income credit: $2,386 (reported on 28.9% of returns)
Here:
$2,386
State:
$2,455
(% of AGI for various income ranges: 9.7% for AGIs below $25k, 1.5% for AGIs $25k-50k)
Percentage of individuals using paid preparers for their 2012 taxes: 59.8%
Here:
60%
State:
61%
(% for various income ranges: 55.6% for AGIs below $25k, 63.0% for AGIs $25k-50k, 61.5% for AGIs $50k-75k, 71.4% for AGIs $75k-100k, 60.0% for AGIs $100k-200k)
Averages for the 2004 tax year for zip code 72959, filed in 2005:
Average Adjusted Gross Income (AGI) in 2004: $29,142 (Individual Income Tax Returns)
Here:
$29,142
State:
$39,270
Salary/wage: $29,294 (reported on 80.3% of returns)
Here:
$29,294
State:
$34,079
(% of AGI for various income ranges: 87.8% for AGIs below $10k, 70.8% for AGIs $10k-25k, 86.4% for AGIs $25k-50k, 88.0% for AGIs $50k-75k, 76.1% for AGIs $75k-100k, 52.1% for AGIs over 100k)
Taxable interest for individuals: $1,072 (reported on 31.3% of returns)
This zip code:
$1,072
Arkansas:
$1,904
(% of AGI for various income ranges: 3.8% for AGIs below $10k, 2.1% for AGIs $10k-25k, 0.9% for AGIs $25k-50k, 0.9% for AGIs $50k-75k, 0.9% for AGIs $75k-100k, 0.3% for AGIs over 100k)
Taxable dividends: $969 (reported on 14.9% of returns)
Here:
$969
State:
$5,995
(% of AGI for various income ranges: 4.6% for AGIs below $10k, 0.7% for AGIs $10k-25k, 0.3% for AGIs $25k-50k, 0.4% for AGIs $50k-75k, 0.2% for AGIs $75k-100k)
Net capital gain/loss: +$6,283 (reported on 13.6% of returns)
Here:
+$6,283
State:
+$10,430
(% of AGI for various income ranges: 3.8% for AGIs below $10k, 0.3% for AGIs $10k-25k, 1.3% for AGIs $25k-50k, 2.0% for AGIs $50k-75k, 18.5% for AGIs $75k-100k)
Profit/loss from business: +$6,496 (reported on 23.5% of returns)
Here:
+$6,496
State:
+$7,823
(% of AGI for various income ranges: 25.5% for AGIs below $10k, 15.1% for AGIs $10k-25k, 2.9% for AGIs $25k-50k, 3.1% for AGIs $50k-75k)
IRA payment deduction: $3,167 (reported on 1.1% of returns)
72959:
$3,167
Arkansas:
$3,204
Total itemized deductions: $14,393 (27% of AGI, reported on 15.8% of returns)
Here:
$14,393
State:
$18,389
Here:
27.3% of AGI
State:
21.0% of AGI
(% of AGI for various income ranges: 7.8% for AGIs $10k-25k, 6.5% for AGIs $25k-50k, 9.3% for AGIs $50k-75k, 9.3% for AGIs $75k-100k, 9.5% for AGIs over 100k)
Charity contributions deductions: $3,103 (6% of AGI, reported on 11.8% of returns)
Here:
$3,103
State:
$4,725
Here:
5.7% of AGI
State:
5.1% of AGI
(% of AGI for various income ranges: 1.4% for AGIs $10k-25k, 1.0% for AGIs $25k-50k, 1.6% for AGIs $50k-75k, 1.4% for AGIs $75k-100k, 1.3% for AGIs over 100k)
Total tax: $2,896 (reported on 73.0% of returns)
72959:
$2,896
State:
$6,047
(% of AGI for various income ranges: 6.5% for AGIs below $10k, 4.9% for AGIs $10k-25k, 5.8% for AGIs $25k-50k, 8.3% for AGIs $50k-75k, 10.7% for AGIs $75k-100k, 11.0% for AGIs over 100k)
Earned income credit: $1,882 (reported on 23.8% of returns)
Here:
$1,882
State:
$1,909
Percentage of individuals using paid preparers for their 2004 taxes: 67.5%
Here:
68%
State:
67%
(% for various income ranges: 60.9% for AGIs below $10k, 70.3% for AGIs $10k-25k, 69.4% for AGIs $25k-50k, 66.2% for AGIs $50k-75k, 73.5% for AGIs $75k-100k, 81.2% for AGIs over 100k)
Household received Food Stamps/SNAP in the past 12 months: 31 Household did not receive Food Stamps/SNAP in the past 12 months: 1,284
Women who had a birth in the past 12 months: 51 (38 now married, 13 unmarried) Women who did not have a birth in the past 12 months: 418 (245 now married, 173 unmarried)
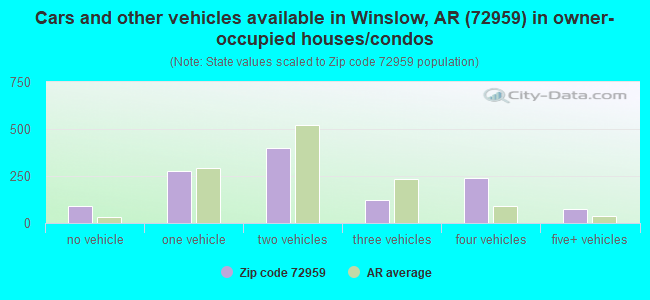
Housing units in zip code 72959 with a mortgage: 388 (26 second mortgage, 25 both second mortgage and home equity loan) Houses without a mortgage: 16
Median monthly owner costs for units with a mortgage: $1,110 Median monthly owner costs for units without a mortgage: $408
Residents with income below the poverty level in 2022:
This zip code:
16.6%
Whole state:
16.8%
Residents with income below 50% of the poverty level in 2022:
This zip code:
10.8%
Whole state:
8.5%
Median number of rooms in houses and condos:
Here:
6.1
State:
6.1
Median number of rooms in apartments:
Here:
5.7
State:
4.3
Notable locations in this zip code not listed on our city pages
Notable locations in zip code 72959: Summit (A), Temple Hill (B), Low Gap (C), Rural District 8 Station 4 (D), Sunset Volunteer Fire Department (E), Boston Mountain Fire Department Station 2 (F), Boston Mountain Fire Department Station 3 (G). Display/hide their locations on the map
Churches in zip code 72959 include: Woolsey Church (A), Oak Grove Church (B), Millers Chapel (C), Blackburn Church (D), Black Oak Church (E), Bethlehem Church (F), Seventh Day Adventist Church (G), Temple Hill Church (H). Display/hide their locations on the map
Cemeteries: Phillips Cemetery (1), Parks Cemetery (2), Koyle Cemetery (3), Kelton Cemetery (4), Temple Hill Cemetery (5), Collier Cemetery (6), Bidville Cemetery (7). Display/hide their locations on the map
Streams, rivers, and creeks: Bee Branch (A), Sinclair Creek (B), Riley Creek (C), London Creek (D), Shrader Branch (E), Jones Branch (F), Hutchins Creek (G), Hess Creek (H), Winn Creek (I). Display/hide their locations on the map
Size of family households: 330 2-persons, 82 3-persons, 78 4-persons, 93 5-persons, 37 6-persons, 23 7-or-more-persons
Size of nonfamily households: 489 1-person, 167 2-persons, 8 4-persons
541 married couples with children.
92 single-parent households (12 men, 80 women).
98.5% of residents of 72959 zip code speak English at home.
0.2% of residents speak Spanish at home (100% well).
1.0% of residents speak other Indo-European language at home (97% very well, 3% well).
0.4% of residents speak Asian or Pacific Island language at home (50% very well, 50% well).
0.1% of residents speak other language at home (100% well).
Foreign born population: 90 (3.0%) (100.0% of them are naturalized citizens)
This zip code:
3.0%
Whole state:
5.1%
36%Malaysia
25%France
15%Taiwan
9%Bhutan
7%Honduras
1%Sweden
1%United Kingdom, excluding England and Scotland
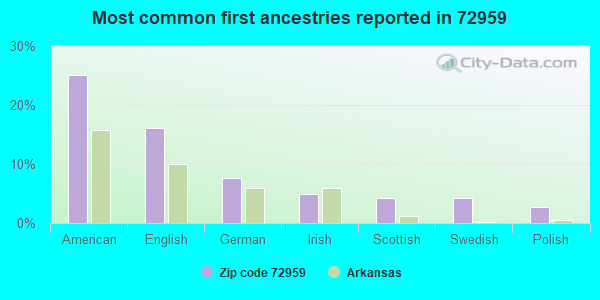
25%American
16%English
8%German
5%Irish
4%Scottish
4%Swedish
3%Polish
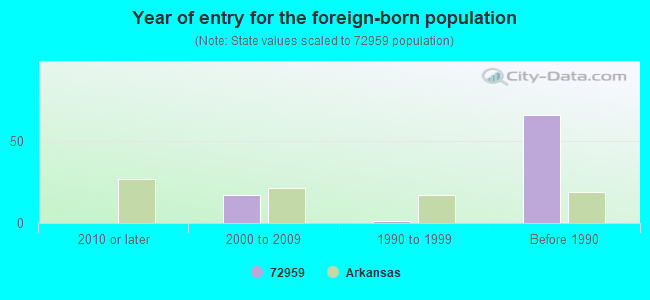
Year of entry for the foreign-born population
02010 or later
172000 to 2009
11990 to 1999
66Before 1990
Housing units lacking complete plumbing facilities: 11.0% Housing units lacking complete kitchen facilities: 9.9%
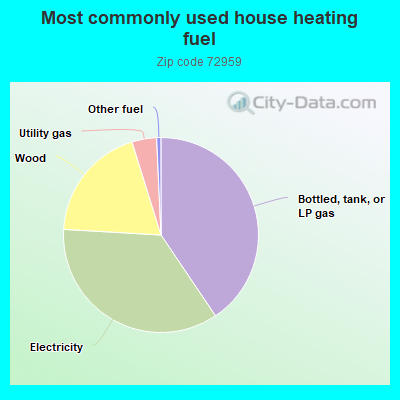
40.6%Bottled, tank, or LP gas
35.4%Electricity
19.3%Wood
4.1%Utility gas
0.7%Other fuel
Population in 1990: 2,566. Population change in the 1990s: +148 (+5.8%).
Place of birth for U.S.-born residents:
This state: 1,717
Northeast: 135
Midwest: 206
South: 543
West: 304
66% of the 72959 zip code residents lived in the same house 5 years ago. Out of people who lived in different houses, 55% lived in this county. Out of people who lived in different counties, 50% lived in Arkansas.
95% of the 72959 zip code residents lived in the same house 1 year ago. Out of people who lived in different houses, 21% moved from this county. Out of people who lived in different houses, 77% moved from different county within same state. Out of people who lived in different houses, 10% moved from abroad.
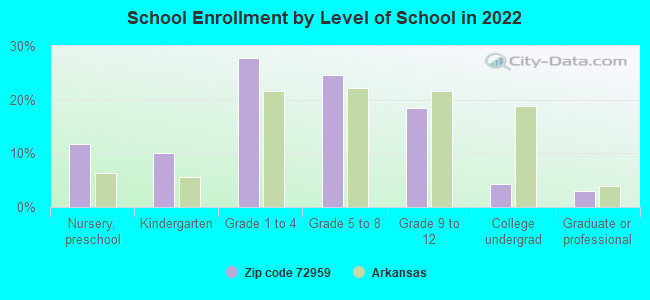
Private vs. public school enrollment:
Students in private schools in grades 1 to 8 (elementary and middle school): 15
Here:
5.0%
Arkansas:
10.5%
Students in private schools in grades 9 to 12 (high school): 6
Here:
5.8%
Arkansas:
8.7%
Students in private undergraduate colleges:
Here:
0.0%
Arkansas:
19.4%
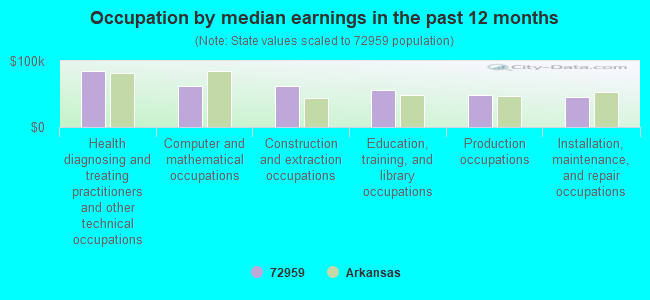
Occupation by median earnings in the past 12 months ($)
84,132Health diagnosing and treating practitioners and other technical occupations
62,770Computer and mathematical occupations
62,347Construction and extraction occupations
56,737Education, training, and library occupations
49,069Production occupations
45,196Installation, maintenance, and repair occupations
Top industries in this zip code by the number of employees in 2005:
Health Care and Social Assistance: Home Health Care Services (10-19 employees: 1 establishment)
Accommodation and Food Services: Bed-and-Breakfast Inns (5-9: 1)
Wholesale Trade: Fresh Fruit and Vegetable Merchant Wholesalers (5-9: 1)
Construction: Siding Contractors (5-9: 1)
Construction: Electrical Contractors (1-4: 1)
Other Services (except Public Administration): General Automotive Repair (1-4: 1)
Health Care and Social Assistance: Other Individual and Family Services (1-4: 1)
Health Care and Social Assistance: Community Food Services (1-4: 1)
Other Services (except Public Administration): Religious Organizations (1-4: 1)
Construction: New Single-Family Housing Construction (except Operative Builders) (1-4: 1)
Fatal accident statistics in 2013:
Fatal accident count: 1
Vehicles involved in fatal accidents: 1
Fatal accidents caused by drunken drivers: 0
Fatalities: 1
Persons involved in fatal accidents: 5
Pedestrians involved in fatal accidents: 0
Fatal accident statistics in 2011:
Fatal accident count: 2
Vehicles involved in fatal accidents: 3
Fatal accidents caused by drunken drivers: 0
Fatalities: 2
Persons involved in fatal accidents: 3
Pedestrians involved in fatal accidents: 0
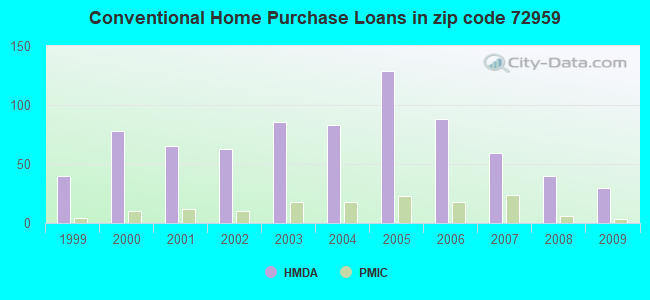
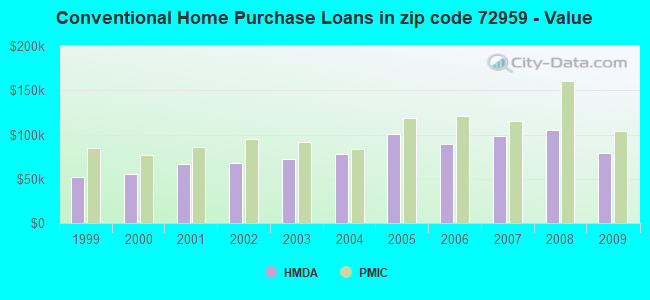
Home Mortgage Disclosure Act Aggregated Statistics For Year 2009 (Based on 6 partial tracts)
A) FHA, FSA/RHS & VA Home Purchase Loans
B) Conventional Home Purchase Loans
C) Refinancings
D) Home Improvement Loans
F) Non-occupant Loans on < 5 Family Dwellings (A B C & D)
G) Loans On Manufactured Home Dwelling (A B C & D)
Number
Average Value
Number
Average Value
Number
Average Value
Number
Average Value
Number
Average Value
Number
Average Value
LOANS ORIGINATED
25
$119,467
30
$78,823
151
$114,626
24
$28,760
17
$62,501
15
$45,499
APPLICATIONS APPROVED, NOT ACCEPTED
2
$58,480
1
$144,720
9
$114,514
2
$14,645
0
$0
2
$58,385
APPLICATIONS DENIED
7
$104,951
18
$64,668
54
$124,833
12
$30,487
4
$45,555
10
$55,586
APPLICATIONS WITHDRAWN
5
$78,070
4
$106,250
31
$127,087
3
$49,570
2
$72,675
0
$0
FILES CLOSED FOR INCOMPLETENESS
0
$0
4
$132,680
3
$114,073
1
$117,510
0
$0
1
$72,550
Aggregated Statistics For Year 2008 (Based on 6 partial tracts)
A) FHA, FSA/RHS & VA Home Purchase Loans
B) Conventional Home Purchase Loans
C) Refinancings
D) Home Improvement Loans
E) Loans on Dwellings For 5+ Families
F) Non-occupant Loans on < 5 Family Dwellings (A B C & D)
G) Loans On Manufactured Home Dwelling (A B C & D)
Number
Average Value
Number
Average Value
Number
Average Value
Number
Average Value
Number
Average Value
Number
Average Value
Number
Average Value
LOANS ORIGINATED
19
$113,303
40
$104,660
139
$96,143
37
$41,855
1
$297,190
23
$65,106
27
$48,995
APPLICATIONS APPROVED, NOT ACCEPTED
2
$80,020
6
$114,397
10
$168,335
6
$23,537
0
$0
1
$112,730
5
$58,380
APPLICATIONS DENIED
10
$110,808
21
$88,578
71
$110,922
15
$63,598
0
$0
7
$88,313
15
$58,265
APPLICATIONS WITHDRAWN
3
$120,623
5
$128,222
27
$107,987
1
$51,430
0
$0
2
$81,255
5
$110,492
FILES CLOSED FOR INCOMPLETENESS
2
$109,110
2
$60,915
8
$112,876
0
$0
0
$0
0
$0
1
$41,140
Aggregated Statistics For Year 2007 (Based on 6 partial tracts)
A) FHA, FSA/RHS & VA Home Purchase Loans
B) Conventional Home Purchase Loans
C) Refinancings
D) Home Improvement Loans
F) Non-occupant Loans on < 5 Family Dwellings (A B C & D)
G) Loans On Manufactured Home Dwelling (A B C & D)
Number
Average Value
Number
Average Value
Number
Average Value
Number
Average Value
Number
Average Value
Number
Average Value
LOANS ORIGINATED
13
$107,442
59
$98,581
156
$100,749
47
$44,010
26
$62,295
29
$56,087
APPLICATIONS APPROVED, NOT ACCEPTED
0
$0
8
$92,125
16
$132,767
2
$104,510
1
$166,700
8
$74,655
APPLICATIONS DENIED
4
$77,708
41
$84,482
75
$139,430
18
$63,172
5
$98,832
24
$62,258
APPLICATIONS WITHDRAWN
0
$0
8
$82,938
27
$114,846
3
$65,433
3
$71,953
2
$47,460
FILES CLOSED FOR INCOMPLETENESS
0
$0
1
$79,930
10
$115,605
1
$85,710
0
$0
0
$0
Aggregated Statistics For Year 2006 (Based on 6 partial tracts)
A) FHA, FSA/RHS & VA Home Purchase Loans
B) Conventional Home Purchase Loans
C) Refinancings
D) Home Improvement Loans
E) Loans on Dwellings For 5+ Families
F) Non-occupant Loans on < 5 Family Dwellings (A B C & D)
G) Loans On Manufactured Home Dwelling (A B C & D)
Number
Average Value
Number
Average Value
Number
Average Value
Number
Average Value
Number
Average Value
Number
Average Value
Number
Average Value
LOANS ORIGINATED
16
$107,040
88
$89,527
174
$111,621
48
$40,096
1
$105,210
23
$83,735
29
$54,465
APPLICATIONS APPROVED, NOT ACCEPTED
1
$134,240
15
$89,409
19
$120,518
4
$88,168
0
$0
1
$187,020
7
$45,349
APPLICATIONS DENIED
5
$87,960
41
$84,021
59
$116,333
19
$28,670
0
$0
3
$84,370
21
$68,238
APPLICATIONS WITHDRAWN
3
$97,407
17
$96,299
38
$101,940
5
$64,530
0
$0
3
$63,653
1
$100,340
FILES CLOSED FOR INCOMPLETENESS
0
$0
4
$134,370
5
$125,078
1
$101,700
0
$0
1
$147,630
0
$0
Aggregated Statistics For Year 2005 (Based on 6 partial tracts)
A) FHA, FSA/RHS & VA Home Purchase Loans
B) Conventional Home Purchase Loans
C) Refinancings
D) Home Improvement Loans
E) Loans on Dwellings For 5+ Families
F) Non-occupant Loans on < 5 Family Dwellings (A B C & D)
G) Loans On Manufactured Home Dwelling (A B C & D)
Number
Average Value
Number
Average Value
Number
Average Value
Number
Average Value
Number
Average Value
Number
Average Value
Number
Average Value
LOANS ORIGINATED
12
$108,914
129
$100,834
184
$99,453
61
$37,393
1
$341,600
39
$70,324
38
$76,604
APPLICATIONS APPROVED, NOT ACCEPTED
0
$0
9
$74,074
20
$90,710
2
$44,925
0
$0
3
$94,377
6
$72,630
APPLICATIONS DENIED
8
$84,289
46
$78,085
83
$95,838
24
$25,979
0
$0
5
$81,128
22
$55,071
APPLICATIONS WITHDRAWN
2
$101,795
11
$75,995
39
$97,487
9
$115,759
0
$0
1
$71,870
6
$71,568
FILES CLOSED FOR INCOMPLETENESS
2
$123,420
8
$151,994
11
$106,987
1
$59,760
0
$0
0
$0
0
$0
Aggregated Statistics For Year 2004 (Based on 6 partial tracts)
A) FHA, FSA/RHS & VA Home Purchase Loans
B) Conventional Home Purchase Loans
C) Refinancings
D) Home Improvement Loans
F) Non-occupant Loans on < 5 Family Dwellings (A B C & D)
G) Loans On Manufactured Home Dwelling (A B C & D)
Number
Average Value
Number
Average Value
Number
Average Value
Number
Average Value
Number
Average Value
Number
Average Value
LOANS ORIGINATED
15
$86,440
83
$77,562
189
$77,443
56
$35,021
28
$57,138
34
$49,838
APPLICATIONS APPROVED, NOT ACCEPTED
2
$79,025
14
$83,288
24
$86,547
0
$0
1
$42,360
8
$56,341
APPLICATIONS DENIED
5
$73,858
33
$61,864
74
$82,744
17
$22,170
4
$52,052
26
$49,198
APPLICATIONS WITHDRAWN
2
$120,975
12
$75,192
51
$89,053
3
$50,350
3
$59,443
5
$67,240
FILES CLOSED FOR INCOMPLETENESS
0
$0
2
$113,105
15
$96,901
0
$0
1
$30,510
1
$128,900
Aggregated Statistics For Year 2003 (Based on 6 partial tracts)
A) FHA, FSA/RHS & VA Home Purchase Loans
B) Conventional Home Purchase Loans
C) Refinancings
D) Home Improvement Loans
F) Non-occupant Loans on < 5 Family Dwellings (A B C & D)
Number
Average Value
Number
Average Value
Number
Average Value
Number
Average Value
Number
Average Value
LOANS ORIGINATED
26
$82,037
86
$72,206
247
$81,432
34
$25,910
31
$44,959
APPLICATIONS APPROVED, NOT ACCEPTED
0
$0
6
$61,308
25
$79,562
0
$0
0
$0
APPLICATIONS DENIED
6
$79,827
45
$62,553
98
$78,295
17
$17,139
3
$49,423
APPLICATIONS WITHDRAWN
0
$0
7
$73,879
48
$83,422
3
$18,050
2
$38,775
FILES CLOSED FOR INCOMPLETENESS
2
$69,525
0
$0
13
$94,482
1
$122,540
0
$0
Aggregated Statistics For Year 2002 (Based on 6 partial tracts)
A) FHA, FSA/RHS & VA Home Purchase Loans
B) Conventional Home Purchase Loans
C) Refinancings
D) Home Improvement Loans
F) Non-occupant Loans on < 5 Family Dwellings (A B C & D)
Number
Average Value
Number
Average Value
Number
Average Value
Number
Average Value
Number
Average Value
LOANS ORIGINATED
20
$82,426
63
$68,341
208
$70,594
44
$21,998
27
$44,387
APPLICATIONS APPROVED, NOT ACCEPTED
1
$63,180
13
$52,164
31
$73,138
5
$18,134
0
$0
APPLICATIONS DENIED
4
$72,498
33
$50,921
71
$74,390
13
$16,927
1
$64,060
APPLICATIONS WITHDRAWN
1
$70,370
10
$87,817
24
$70,429
1
$5,160
1
$35,270
FILES CLOSED FOR INCOMPLETENESS
1
$32,790
2
$65,620
9
$88,822
1
$37,450
0
$0
Aggregated Statistics For Year 2001 (Based on 6 partial tracts)
A) FHA, FSA/RHS & VA Home Purchase Loans
B) Conventional Home Purchase Loans
C) Refinancings
D) Home Improvement Loans
F) Non-occupant Loans on < 5 Family Dwellings (A B C & D)
Number
Average Value
Number
Average Value
Number
Average Value
Number
Average Value
Number
Average Value
LOANS ORIGINATED
17
$80,844
65
$66,697
168
$75,153
40
$21,325
25
$49,932
APPLICATIONS APPROVED, NOT ACCEPTED
0
$0
10
$38,610
17
$69,711
5
$21,896
3
$45,383
APPLICATIONS DENIED
4
$73,945
34
$41,352
93
$66,671
15
$14,145
3
$35,087
APPLICATIONS WITHDRAWN
0
$0
10
$78,117
29
$74,056
4
$35,842
4
$42,118
FILES CLOSED FOR INCOMPLETENESS
0
$0
0
$0
9
$78,033
0
$0
0
$0
Aggregated Statistics For Year 2000 (Based on 6 partial tracts)
A) FHA, FSA/RHS & VA Home Purchase Loans
B) Conventional Home Purchase Loans
C) Refinancings
D) Home Improvement Loans
E) Loans on Dwellings For 5+ Families
F) Non-occupant Loans on < 5 Family Dwellings (A B C & D)
Number
Average Value
Number
Average Value
Number
Average Value
Number
Average Value
Number
Average Value
Number
Average Value
LOANS ORIGINATED
14
$73,039
78
$54,943
98
$63,041
40
$16,965
1
$11,526,000
14
$49,818
APPLICATIONS APPROVED, NOT ACCEPTED
3
$39,490
18
$43,244
15
$53,983
5
$13,510
0
$0
3
$32,537
APPLICATIONS DENIED
6
$47,697
75
$43,712
89
$48,688
20
$13,609
0
$0
6
$39,353
APPLICATIONS WITHDRAWN
4
$76,680
9
$67,327
38
$50,811
4
$16,890
0
$0
3
$42,967
FILES CLOSED FOR INCOMPLETENESS
0
$0
0
$0
8
$55,132
0
$0
0
$0
0
$0
Aggregated Statistics For Year 1999 (Based on 3 partial tracts)
A) FHA, FSA/RHS & VA Home Purchase Loans
B) Conventional Home Purchase Loans
C) Refinancings
D) Home Improvement Loans
E) Loans on Dwellings For 5+ Families
F) Non-occupant Loans on < 5 Family Dwellings (A B C & D)
2002 - 2018 National Fire Incident Reporting System (NFIRS) incidents
Based on the data from the years 2002 - 2018 the average number of fire incidents per year is 19. The highest number of fire incidents - 58 took place in 2016, and the least - 0 in 2004. The data has a growing trend.
When looking into fire subcategories, the most incidents belonged to: Outside Fires (49.2%), and Structure Fires (30.2%).
Fire incident types reported to NFIRS in Zip Code 72959


 Nearest zip codes: 72946, 72774, 72727, 72701, 72947, 72721.
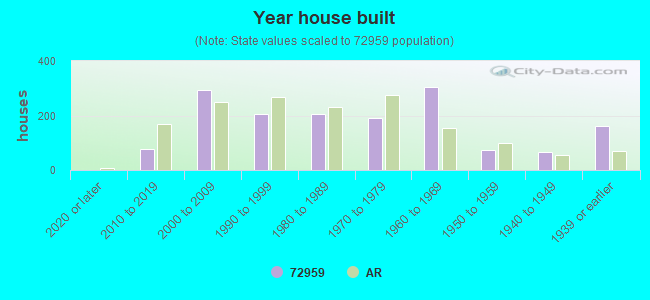


 Based on the data from the years 2002 - 2018 the average number of fire incidents per year is 19. The highest number of fire incidents - 58 took place in 2016, and the least - 0 in 2004. The data has a growing trend.
 When looking into fire subcategories, the most incidents belonged to: Outside Fires (49.2%), and Structure Fires (30.2%).