Estimated zip code population in 2022: 32,673 Zip code population in 2010: 25,448 Zip code population in 2000: 23,031
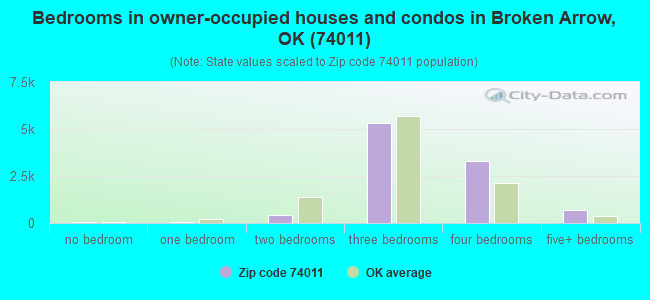
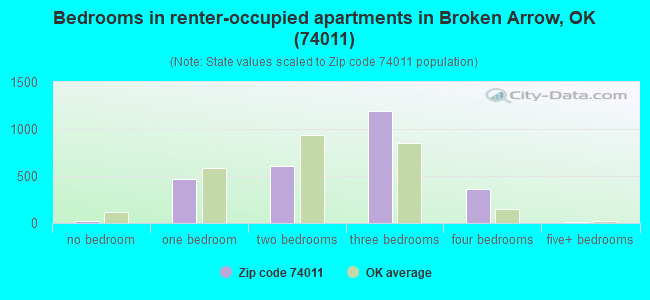
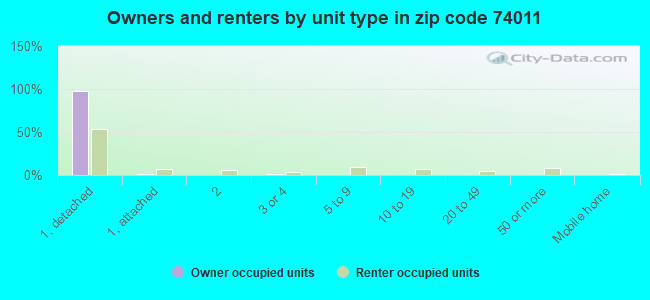
Houses and condos: 12,747 Renter-occupied apartments: 2,686
% of renters here:
22%
State:
35%
March 2022 cost of living index in zip code 74011: 87.6 (less than average, U.S. average is 100)
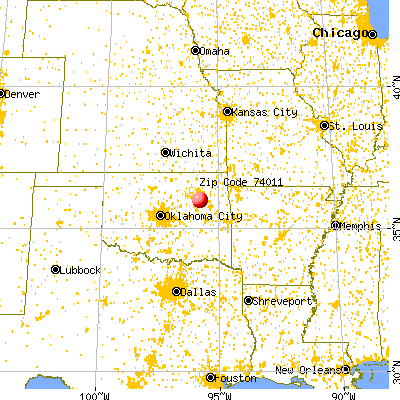
Land area: 23.7 sq. mi. Water area: 2.0 sq. mi.
Population density: 1,381 people per square mile
(low).
OSM Map
General Map
Google Map
MSN Map
OSM Map
General Map
Google Map
MSN Map
OSM Map
General Map
Google Map
MSN Map
OSM Map
General Map
Google Map
MSN Map
Please wait while loading the map...
Real estate property taxes paid for housing units in 2022:
This zip code:
1.0% ($2,608)
Oklahoma:
0.8% ($1,501)
Median real estate property taxes paid for housing units with mortgages in 2022: $2,585 (1.0%) Median real estate property taxes paid for housing units with no mortgage in 2022: $2,596 (1.0%)
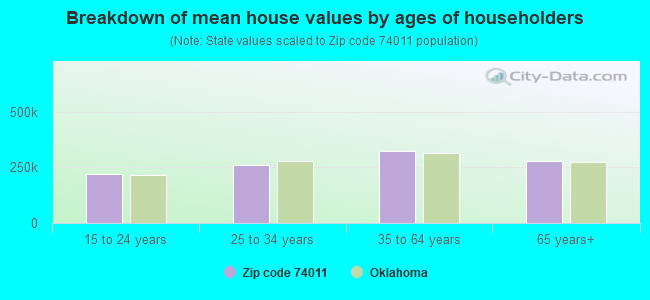
Estimated median house/condo value in 2022: $252,190
74011:
$252,190
Oklahoma:
$191,700
According to our research of Oklahoma and other state lists, there were 15 registered sex offenders living in 74011 zip code as of April 26, 2024. The ratio of all residents to sex offenders in zip code 74011 is 1,790 to 1. The ratio of registered sex offenders to all residents in this zip code is much lower than the state average.
Median resident age:
This zip code:
37.6 years
Oklahoma median age:
37.1 years
Average household size:
This zip code:
2.6 people
Oklahoma:
2.5 people
Averages for the 2020 tax year for zip code 74011, filed in 2021:
Average Adjusted Gross Income (AGI) in 2020: $85,360 (Individual Income Tax Returns)
Here:
$85,360
State:
$63,060
Salary/wage: $69,950 (reported on 82.6% of returns)
Here:
$69,950
State:
$52,427
(% of AGI for various income ranges: 1086.1% for AGIs below $25k, 3485.4% for AGIs $25k-50k, 6453.1% for AGIs $50k-75k, 9234.2% for AGIs $75k-100k, 17385.0% for AGIs $100k-200k, 66253.8% for AGIs over 200k)
Taxable interest for individuals: $2,062 (reported on 35.4% of returns)
This zip code:
$2,062
Oklahoma:
$1,603
(% of AGI for various income ranges: 19.4% for AGIs below $25k, 22.8% for AGIs $25k-50k, 41.3% for AGIs $50k-75k, 57.4% for AGIs $75k-100k, 163.6% for AGIs $100k-200k, 1623.5% for AGIs over 200k)
Ordinary dividends: $8,032 (reported on 20.7% of returns)
Here:
$8,032
State:
$7,001
(% of AGI for various income ranges: 31.9% for AGIs below $25k, 44.8% for AGIs $25k-50k, 106.3% for AGIs $50k-75k, 114.1% for AGIs $75k-100k, 352.8% for AGIs $100k-200k, 3959.4% for AGIs over 200k)
Net capital gain/loss in AGI: +$20,246 (reported on 19.5% of returns)
Here:
+$20,246
State:
+$19,855
(% of AGI for various income ranges: 10.8% for AGIs below $25k, 35.4% for AGIs $25k-50k, 111.4% for AGIs $50k-75k, 142.8% for AGIs $75k-100k, 460.8% for AGIs $100k-200k, 13451.5% for AGIs over 200k)
Profit/loss from business: +$13,498 (reported on 17.8% of returns)
Here:
+$13,498
State:
+$9,904
(% of AGI for various income ranges: 138.2% for AGIs below $25k, 161.2% for AGIs $25k-50k, 225.6% for AGIs $50k-75k, 246.4% for AGIs $75k-100k, 504.4% for AGIs $100k-200k, 3562.6% for AGIs over 200k)
Taxable individual retirement arrangement distribution: $24,830 (reported on 10.7% of returns)
74011:
$24,830
Oklahoma:
$20,476
(% of AGI for various income ranges: 64.8% for AGIs below $25k, 140.0% for AGIs $25k-50k, 207.5% for AGIs $50k-75k, 369.7% for AGIs $75k-100k, 899.0% for AGIs $100k-200k, 3251.8% for AGIs over 200k)
Self-employed (Keogh) retirement plans: $23,829 (reported on 0.5% of returns)
74011:
$23,829
Oklahoma:
$23,482
(% of AGI for various income ranges: 26.5% for AGIs $100k-200k, 362.1% for AGIs over 200k)
Total itemized deductions: $41,354 (reported on 11.8% of returns)
Here:
$41,354
State:
$39,736
(% of AGI for various income ranges: 43.8% for AGIs below $25k, 123.3% for AGIs $25k-50k, 315.3% for AGIs $50k-75k, 526.7% for AGIs $75k-100k, 1166.5% for AGIs $100k-200k, 10702.9% for AGIs over 200k)
Charity contributions: $18,833 (reported on 10.2% of returns)
Here:
$18,833
State:
$17,288
(% of AGI for various income ranges: 4.5% for AGIs below $25k, 27.1% for AGIs $25k-50k, 68.7% for AGIs $50k-75k, 143.6% for AGIs $75k-100k, 408.7% for AGIs $100k-200k, 5248.8% for AGIs over 200k)
Taxes paid: $7,764 (reported on 11.8% of returns)
74011:
$7,764
State:
$7,046
(% of AGI for various income ranges: 7.9% for AGIs below $25k, 20.5% for AGIs $25k-50k, 66.2% for AGIs $50k-75k, 117.9% for AGIs $75k-100k, 302.4% for AGIs $100k-200k, 1529.4% for AGIs over 200k)
Earned income credit: $2,260 (reported on 12.3% of returns)
Here:
$2,260
State:
$2,435
(% of AGI for various income ranges: 82.8% for AGIs below $25k, 62.1% for AGIs $25k-50k, 1.4% for AGIs $50k-75k)
Percentage of individuals using paid preparers for their 2020 taxes: 92.8%
Here:
93%
State:
94%
(% for various income ranges: 91.8% for AGIs below $25k, 93.5% for AGIs $25k-50k, 92.5% for AGIs $50k-75k, 93.8% for AGIs $75k-100k, 92.9% for AGIs $100k-200k, 93.0% for AGIs over 200k)
Averages for the 2012 tax year for zip code 74011, filed in 2013:
Average Adjusted Gross Income (AGI) in 2012: $83,566 (Individual Income Tax Returns)
Here:
$83,566
State:
$58,581
Salary/wage: $62,154 (reported on 85.9% of returns)
Here:
$62,154
State:
$45,973
(% of AGI for various income ranges: 75.9% for AGIs below $25k, 79.7% for AGIs $25k-50k, 78.8% for AGIs $50k-75k, 79.1% for AGIs $75k-100k, 77.0% for AGIs $100k-200k, 40.9% for AGIs over 200k)
Taxable interest for individuals: $1,987 (reported on 38.8% of returns)
This zip code:
$1,987
Oklahoma:
$1,625
(% of AGI for various income ranges: 1.4% for AGIs below $25k, 0.8% for AGIs $25k-50k, 0.6% for AGIs $50k-75k, 0.6% for AGIs $75k-100k, 0.7% for AGIs $100k-200k, 1.2% for AGIs over 200k)
Ordinary dividends: $7,370 (reported on 20.4% of returns)
Here:
$7,370
State:
$6,374
(% of AGI for various income ranges: 1.7% for AGIs below $25k, 0.8% for AGIs $25k-50k, 0.9% for AGIs $50k-75k, 0.9% for AGIs $75k-100k, 1.4% for AGIs $100k-200k, 2.9% for AGIs over 200k)
Net capital gain/loss in AGI: +$46,738 (reported on 16.9% of returns)
Here:
+$46,738
State:
+$24,023
(% of AGI for various income ranges: 0.4% for AGIs $50k-75k, 0.7% for AGIs $75k-100k, 1.4% for AGIs $100k-200k, 23.5% for AGIs over 200k)
Profit/loss from business: +$13,935 (reported on 18.3% of returns)
Here:
+$13,935
State:
+$11,913
(% of AGI for various income ranges: 7.4% for AGIs below $25k, 3.7% for AGIs $25k-50k, 2.9% for AGIs $50k-75k, 2.6% for AGIs $75k-100k, 3.2% for AGIs $100k-200k, 2.5% for AGIs over 200k)
Taxable individual retirement arrangement distribution: $18,690 (reported on 11.7% of returns)
74011:
$18,690
Oklahoma:
$15,242
(% of AGI for various income ranges: 3.9% for AGIs below $25k, 2.8% for AGIs $25k-50k, 3.1% for AGIs $50k-75k, 3.0% for AGIs $75k-100k, 3.5% for AGIs $100k-200k, 1.6% for AGIs over 200k)
Self-employment retirement plans: $18,671 (reported on 0.6% of returns)
74011:
$18,671
Oklahoma:
$20,266
Total itemized deductions: $25,440 (17% of AGI, reported on 42.4% of returns)
Here:
$25,440
State:
$24,882
Here:
17.1% of AGI
State:
18.8% of AGI
(% of AGI for various income ranges: 12.1% for AGIs below $25k, 11.8% for AGIs $25k-50k, 13.6% for AGIs $50k-75k, 14.3% for AGIs $75k-100k, 15.0% for AGIs $100k-200k, 11.3% for AGIs over 200k)
Charity contributions: $6,916 (reported on 36.6% of returns)
Here:
$6,916
State:
$6,591
(% of AGI for various income ranges: 1.5% for AGIs below $25k, 2.0% for AGIs $25k-50k, 2.5% for AGIs $50k-75k, 3.2% for AGIs $75k-100k, 3.4% for AGIs $100k-200k, 3.3% for AGIs over 200k)
Taxes paid: $8,459 (reported on 42.2% of returns)
74011:
$8,459
State:
$7,196
(% of AGI for various income ranges: 2.0% for AGIs below $25k, 2.5% for AGIs $25k-50k, 3.4% for AGIs $50k-75k, 4.1% for AGIs $75k-100k, 5.1% for AGIs $100k-200k, 4.7% for AGIs over 200k)
Earned income credit: $2,190 (reported on 13.1% of returns)
Here:
$2,190
State:
$2,354
(% of AGI for various income ranges: 5.5% for AGIs below $25k, 1.1% for AGIs $25k-50k)
Percentage of individuals using paid preparers for their 2012 taxes: 47.4%
Here:
47%
State:
56%
(% for various income ranges: 38.8% for AGIs below $25k, 43.8% for AGIs $25k-50k, 48.1% for AGIs $50k-75k, 51.4% for AGIs $75k-100k, 54.7% for AGIs $100k-200k, 78.5% for AGIs over 200k)
Averages for the 2004 tax year for zip code 74011, filed in 2005:
Average Adjusted Gross Income (AGI) in 2004: $58,714 (Individual Income Tax Returns)
Here:
$58,714
State:
$41,245
Salary/wage: $48,609 (reported on 87.8% of returns)
Here:
$48,609
State:
$35,318
(% of AGI for various income ranges: 149.6% for AGIs below $10k, 76.4% for AGIs $10k-25k, 80.6% for AGIs $25k-50k, 84.4% for AGIs $50k-75k, 84.8% for AGIs $75k-100k, 58.8% for AGIs over 100k)
Taxable interest for individuals: $1,583 (reported on 49.1% of returns)
This zip code:
$1,583
Oklahoma:
$1,745
(% of AGI for various income ranges: 5.8% for AGIs below $10k, 2.3% for AGIs $10k-25k, 1.4% for AGIs $25k-50k, 0.9% for AGIs $50k-75k, 0.7% for AGIs $75k-100k, 1.5% for AGIs over 100k)
Taxable dividends: $2,233 (reported on 23.9% of returns)
Here:
$2,233
State:
$2,920
(% of AGI for various income ranges: 3.1% for AGIs below $10k, 1.5% for AGIs $10k-25k, 0.8% for AGIs $25k-50k, 0.7% for AGIs $50k-75k, 0.7% for AGIs $75k-100k, 1.0% for AGIs over 100k)
Net capital gain/loss: +$7,266 (reported on 20.6% of returns)
Here:
+$7,266
State:
+$10,653
(% of AGI for various income ranges: 0.2% for AGIs below $10k, 0.4% for AGIs $10k-25k, 0.4% for AGIs $25k-50k, 0.3% for AGIs $50k-75k, 0.7% for AGIs $75k-100k, 5.1% for AGIs over 100k)
Profit/loss from business: +$10,258 (reported on 18.5% of returns)
Here:
+$10,258
State:
+$8,532
(% of AGI for various income ranges: 4.4% for AGIs below $10k, 5.3% for AGIs $10k-25k, 4.2% for AGIs $25k-50k, 2.4% for AGIs $50k-75k, 1.4% for AGIs $75k-100k, 3.7% for AGIs over 100k)
IRA payment deduction: $3,278 (reported on 2.6% of returns)
74011:
$3,278
Oklahoma:
$3,127
(% of AGI for various income ranges: 0.2% for AGIs $10k-25k, 0.2% for AGIs $25k-50k, 0.2% for AGIs $50k-75k, 0.2% for AGIs $75k-100k, 0.1% for AGIs over 100k)
Self-employed pension: $14,808 (reported on 0.8% of returns)
Here:
$14,808
Oklahoma:
$14,276
(% of AGI for various income ranges: 0.1% for AGIs $50k-75k, 0.1% for AGIs $75k-100k, 0.3% for AGIs over 100k)
Total itemized deductions: $18,491 (20% of AGI, reported on 52.3% of returns)
Here:
$18,491
State:
$17,093
Here:
19.9% of AGI
State:
20.5% of AGI
(% of AGI for various income ranges: 21.8% for AGIs below $10k, 15.3% for AGIs $10k-25k, 18.4% for AGIs $25k-50k, 18.7% for AGIs $50k-75k, 18.8% for AGIs $75k-100k, 14.1% for AGIs over 100k)
Charity contributions deductions: $4,389 (5% of AGI, reported on 47.2% of returns)
Here:
$4,389
State:
$4,240
Here:
4.5% of AGI
State:
4.8% of AGI
(% of AGI for various income ranges: 1.4% for AGIs below $10k, 2.7% for AGIs $10k-25k, 3.3% for AGIs $25k-50k, 3.4% for AGIs $50k-75k, 3.7% for AGIs $75k-100k, 3.8% for AGIs over 100k)
Total tax: $9,907 (reported on 78.2% of returns)
74011:
$9,907
State:
$6,542
(% of AGI for various income ranges: 3.9% for AGIs below $10k, 4.1% for AGIs $10k-25k, 6.3% for AGIs $25k-50k, 7.8% for AGIs $50k-75k, 9.7% for AGIs $75k-100k, 20.1% for AGIs over 100k)
Earned income credit: $1,645 (reported on 11.1% of returns)
Here:
$1,645
State:
$1,830
Percentage of individuals using paid preparers for their 2004 taxes: 51.4%
Here:
51%
State:
63%
(% for various income ranges: 39.3% for AGIs below $10k, 53.1% for AGIs $10k-25k, 53.1% for AGIs $25k-50k, 51.9% for AGIs $50k-75k, 53.4% for AGIs $75k-100k, 62.3% for AGIs over 100k)
Household received Food Stamps/SNAP in the past 12 months: 704 Household did not receive Food Stamps/SNAP in the past 12 months: 11,590
Women who had a birth in the past 12 months: 476 (385 now married, 95 unmarried) Women who did not have a birth in the past 12 months: 7,036 (3,771 now married, 3,264 unmarried)
Housing units in zip code 74011 with a mortgage: 6,369 (449 second mortgage, 16 home equity loan, 366 both second mortgage and home equity loan) Houses without a mortgage: 83
Median monthly owner costs for units with a mortgage: $1,624 Median monthly owner costs for units without a mortgage: $671
Residents with income below the poverty level in 2022:
This zip code:
6.2%
Whole state:
15.7%
Residents with income below 50% of the poverty level in 2022:
This zip code:
3.2%
Whole state:
8.3%
Median number of rooms in houses and condos:
Here:
6.7
State:
6.1
Median number of rooms in apartments:
Here:
5.0
State:
4.5
Notable locations in this zip code not listed on our city pages
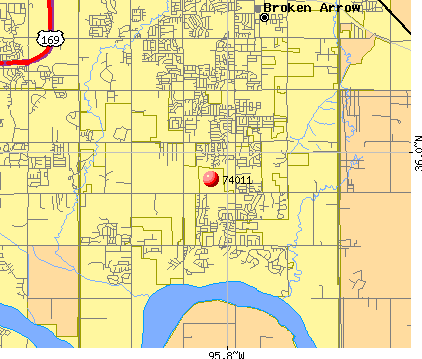
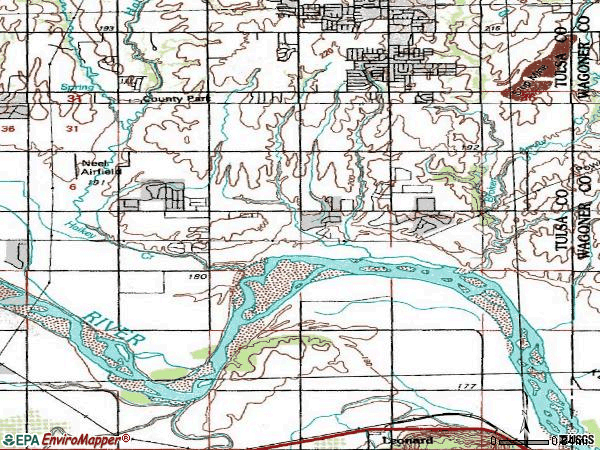
Notable locations in zip code 74011: Broken Arrow Waterworks (A), Indian Springs Plaza (B), Town Center-2 (C), Broken Arrow Fire Department Station 3 (D). Display/hide their locations on the map
Churches in zip code 74011 include: Walnut Grove Church (A), Trinity Lutheran Church (B), Indian Springs Baptist Church (C), Grace Free Will Baptist Church (D), Florence Street Baptist Church (E), Aspen Park Baptist Church (F), White Church (G). Display/hide their locations on the map
5,806 married couples with children.
1,982 single-parent households (705 men, 1,277 women).
93.5% of residents of 74011 zip code speak English at home.
3.8% of residents speak Spanish at home (78% very well, 13% well, 9% not well).
1.1% of residents speak other Indo-European language at home (77% very well, 8% well, 9% not well, 6% not at all).
1.1% of residents speak Asian or Pacific Island language at home (53% very well, 39% well, 8% not well).
0.3% of residents speak other language at home (65% very well, 16% well, 7% not well, 12% not at all).
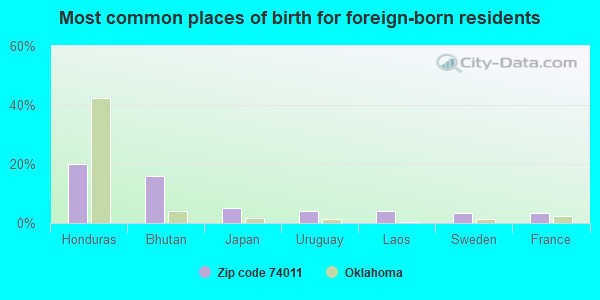
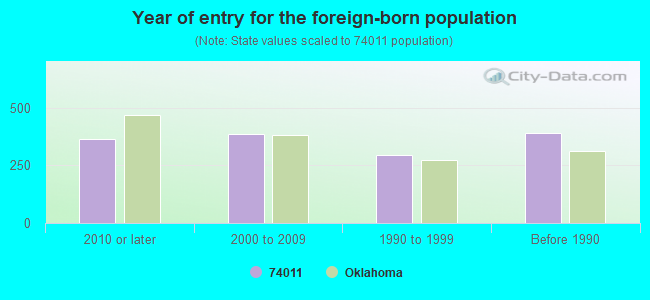
Foreign born population: 1,196 (3.7%) (60.2% of them are naturalized citizens)
Facilities with environmental interests located in this zip code:
ARROW SPRINGS ES (101 W. TWIN OAKS in BROKEN ARROW, OK)
(National Center for Education Statistics) - STATE ID-72-I003-145 Organizations: BROKEN ARROW (SCHOOL DISTRICT)
BROKEN ARROW SOUTH IHS (301 W. NEW ORLEANS in BROKEN ARROW, OK)
(National Center for Education Statistics) - STATE ID-72-I003-710
CHILDERS MS (301 E. TUCSON in BROKEN ARROW, OK)
(National Center for Education Statistics) - STATE ID-72-I003-520 Organizations: BROKEN ARROW (SCHOOL DISTRICT)
BOB BRUSSO (1708 W YUMA COURT in BROKEN ARROW, OK)
(Integrated Compliance Information System) - ICIS-06-1988-0323, FORMAL ENFORCEMENT ACTION
ELECTRONIC LABEL TECHNOLOGY (708 W KENOSHA in BROKEN ARROW, OK)
AIR MINOR (AIRS/AFS) Small Quantity Generators, between 100 kg and 1000 kg of hazardous waste/month (Resource Conservation and Recovery Act (tracking hazardous waste)) - notification Business SIC classification: COMMERCIAL PRINTING, LITHOGRAPHIC Organizations: TIM WRIGHT (CONTACT/OWNER)
Alternative names: ELECTRONIC LABEL TE/ELECTRONIC LABEL TEC
FARMERS COOP ASSOC/BROKEN ARROW (413 S ASH in BROKEN ARROW, OK)
AIR MINOR (AIRS/AFS) Business SIC classification: GRAIN AND FIELD BEANS Alternative names: FARMERS COOP AS/BROKEN AR
Housing units lacking complete plumbing facilities: 0.9% Housing units lacking complete kitchen facilities: 1.3%
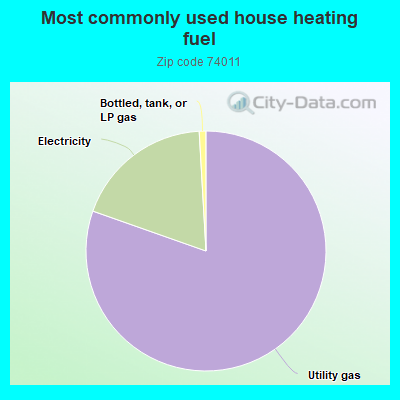
80.0%Utility gas
18.6%Electricity
0.9%Bottled, tank, or LP gas
Population in 1990: 23,493.
Place of birth for U.S.-born residents:
This state: 18,479
Northeast: 1,113
Midwest: 4,794
South: 3,996
West: 2,883
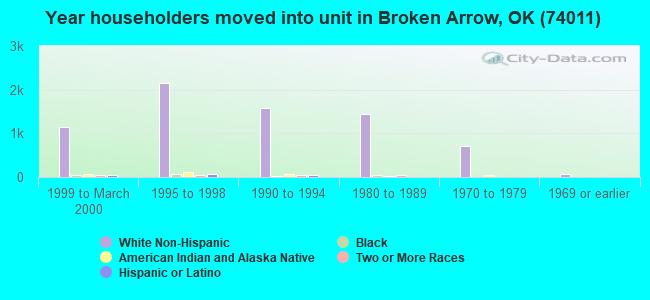
53% of the 74011 zip code residents lived in the same house 5 years ago. Out of people who lived in different houses, 60% lived in this county. Out of people who lived in different counties, 50% lived in Oklahoma.
89% of the 74011 zip code residents lived in the same house 1 year ago. Out of people who lived in different houses, 55% moved from this county. Out of people who lived in different houses, 15% moved from different county within same state. Out of people who lived in different houses, 27% moved from different state. Out of people who lived in different houses, 4% moved from abroad.
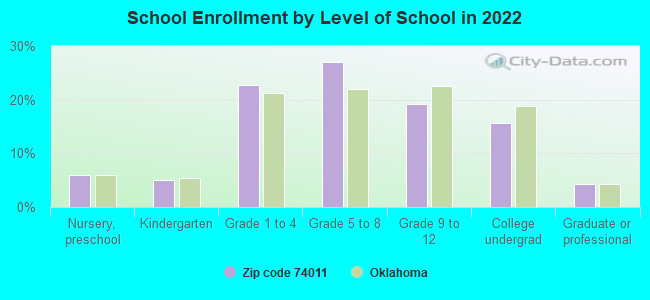
Private vs. public school enrollment:
Students in private schools in grades 1 to 8 (elementary and middle school): 914
Here:
21.7%
Oklahoma:
11.7%
Students in private schools in grades 9 to 12 (high school): 309
Here:
18.9%
Oklahoma:
11.7%
Students in private undergraduate colleges: 285
Here:
21.4%
Oklahoma:
19.3%
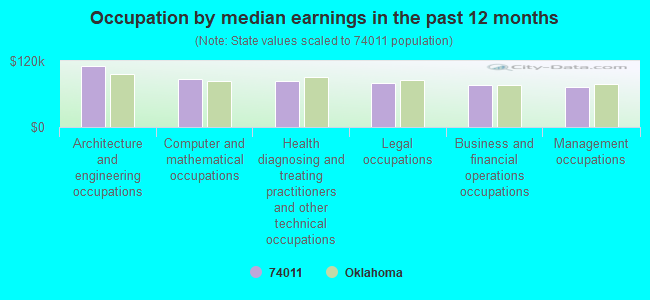
Occupation by median earnings in the past 12 months ($)
110,831Architecture and engineering occupations
86,470Computer and mathematical occupations
84,263Health diagnosing and treating practitioners and other technical occupations
80,471Legal occupations
76,261Business and financial operations occupations
72,574Management occupations
Companies with federal contracts located in this zip code (BROKEN ARROW, OK):
SMITH ASSOCIATES-CONSULTANTS (6203 W UTICA COURT; small business) : $239,140 in 30 contractsfrom 2002 to 2006
Contracts for Other Social Services, Communications Services, Other Professional Services by Army, U.S. Army Corps of Engineers - civil program financing only Signed by year:2000: $0; 2001: $0; 2002: $34,760; 2003: $48,826; 2004: $88,314; 2005: $40,244; 2006: $26,996.
Biggest contracts:
$37,811 with Army for Other Social Services. Signed on 2004-04-06. Completion date: 2004-04-30.
$37,811 with U.S. Army Corps of Engineers - civil program financing only for Other Social Services. Signed on 2004-04-06. Completion date: 2004-04-30.
$34,760, same as above.Signed on 2002-04-30. Completion date: 2003-04-30.
$26,996 with Army for Communications Services. Taking place in UT. Signed on 2006-04-05. Completion date: 2006-09-30.
AFFORDABLE JANITORIAL & CLEANI (7408 SOUTH IRONWOOD AVE; small business) : $89,805 in 5 contractsfrom 2002 to 2005
Contracts for Custodial Janitorial Services by Navy Signed by year:2000: $0; 2001: $0; 2002: $17,997; 2003: $17,997; 2004: $17,997; 2005: $35,814; 2006: $0.
Biggest contracts:
$35,814 with Navy for Custodial Janitorial Services. Signed on 2005-09-20. Completion date: 2005-09-27.
$17,997, same as above.Signed on 2004-09-15. Completion date: 2005-09-27.
$17,997, same as above.Signed on 2003-09-16. Completion date: 2004-09-27.
$17,997, same as above.Signed on 2002-09-10. Completion date: 2002-09-27.
MOSS LANDSCAPE/LARRY L MOSS (4608 SOUTH DATE AVE; small business) : $62,693 in 4 contractsfrom 2003 to 2004
$44,100 with Army for Landscaping/Groundskeeping Services. Signed on 2003-04-10. Completion date: 2006-05-06.
$15,435, same as above.Signed on 2004-05-11. Completion date: 2006-05-06.
$3,158, same as above.Signed on 2004-09-27. Completion date: 2006-05-06.
$0, same as above.Signed on 2003-04-10. Completion date: 2006-05-06.
JACK M HAYES SR (8014 S BIRCH AVE; small business) : $37,245 in 6 contractsfrom 2003 to 2006
Contracts for Recreation Site Maintenance Services (non-construction) by Army, U.S. Army Corps of Engineers - civil program financing only Signed by year:2000: $0; 2001: $0; 2002: $0; 2003: $4,800; 2004: $9,900; 2005: $16,020; 2006: $6,525.
Biggest contracts:
$8,010 with Army for Recreation Site Maintenance Services (non-construction). Signed on 2005-03-17. Completion date: 2005-09-15.
$8,010 with U.S. Army Corps of Engineers - civil program financing only for Recreation Site Maintenance Services (non-construction). Signed on 2005-03-17. Completion date: 2005-09-15.
$6,525 with Army for Recreation Site Maintenance Services (non-construction). Signed on 2006-03-21. Completion date: 2006-09-10.
$4,950 with U.S. Army Corps of Engineers - civil program financing only for Recreation Site Maintenance Services (non-construction). Signed on 2004-04-13. Completion date: 2004-09-06.
Top industries in this zip code by the number of employees in 2005:
Information: Data Processing, Hosting, and Related Services (250-499 employees: 1 establishment, 1-4 employees: 2 establishments)
Arts, Entertainment, and Recreation: Golf Courses and Country Clubs (100-249: 1, 50-99: 1)
2002 - 2018 National Fire Incident Reporting System (NFIRS) incidents
According to the data from the years 2002 - 2018 the average number of fires per year is 23. The highest number of reported fire incidents - 61 took place in 2014, and the least - 0 in 2004. The data has a rising trend.
When looking into fire subcategories, the most incidents belonged to: Outside Fires (55.4%), and Structure Fires (31.9%).
Fire incident types reported to NFIRS in Zip Code 74011


 Nearest zip codes: 74012, 74133, 74008, 74146, 74137, 74134.


 According to the data from the years 2002 - 2018 the average number of fires per year is 23. The highest number of reported fire incidents - 61 took place in 2014, and the least - 0 in 2004. The data has a rising trend.
 When looking into fire subcategories, the most incidents belonged to: Outside Fires (55.4%), and Structure Fires (31.9%).