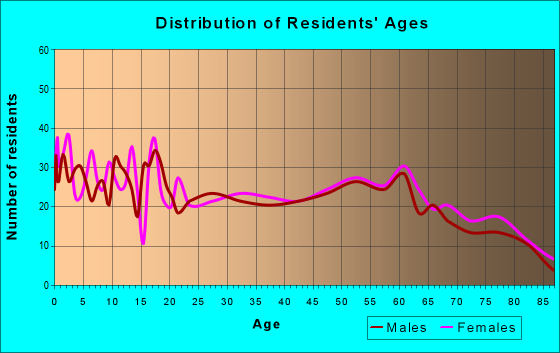
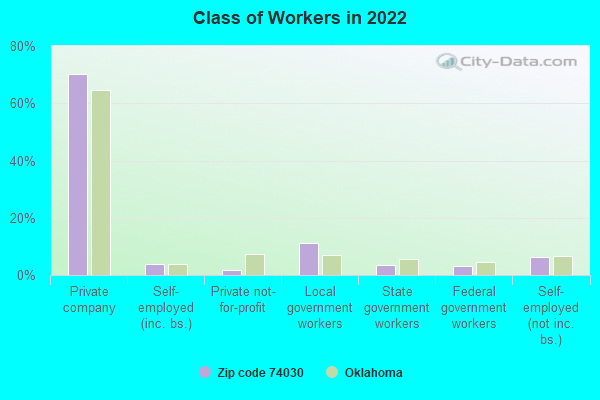
Estimated zip code population in 2022: 3,002 Zip code population in 2010: 3,864 Zip code population in 2000: 3,830
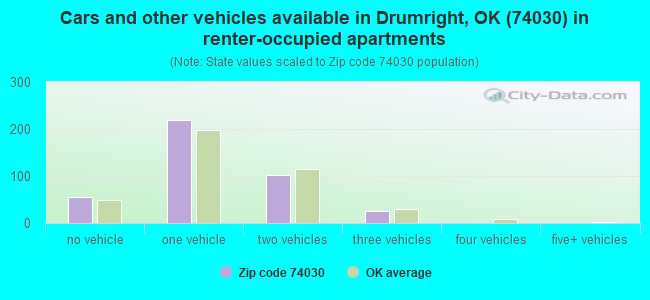
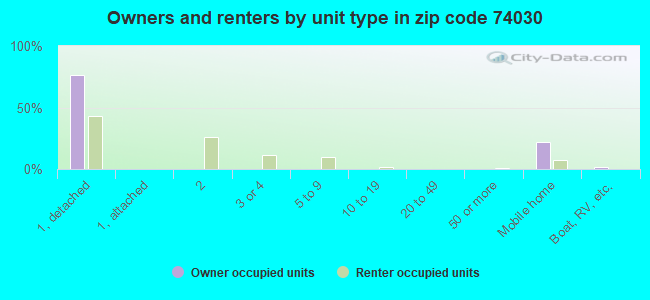
Houses and condos: 1,666 Renter-occupied apartments: 401
% of renters here:
29%
State:
35%
March 2022 cost of living index in zip code 74030: 77.4 (low, U.S. average is 100)
Land area: 69.0 sq. mi. Water area: 0.3 sq. mi.
Population density: 44 people per square mile
(very low).
OSM Map
General Map
Google Map
MSN Map
OSM Map
General Map
Google Map
MSN Map
OSM Map
General Map
Google Map
MSN Map
OSM Map
General Map
Google Map
MSN Map
Please wait while loading the map...
Real estate property taxes paid for housing units in 2022:
This zip code:
0.7% ($587)
Oklahoma:
0.8% ($1,501)
Median real estate property taxes paid for housing units with mortgages in 2022: $820 (0.7%) Median real estate property taxes paid for housing units with no mortgage in 2022: $416 (0.6%)
Averages for the 2020 tax year for zip code 74030, filed in 2021:
Average Adjusted Gross Income (AGI) in 2020: $47,937 (Individual Income Tax Returns)
Here:
$47,937
State:
$63,060
Salary/wage: $42,229 (reported on 84.3% of returns)
Here:
$42,229
State:
$52,427
(% of AGI for various income ranges: 1164.0% for AGIs below $25k, 3575.6% for AGIs $25k-50k, 6308.7% for AGIs $50k-75k, 9912.9% for AGIs $75k-100k, 14047.8% for AGIs $100k-200k)
Taxable interest for individuals: $745 (reported on 20.7% of returns)
This zip code:
$745
Oklahoma:
$1,603
(% of AGI for various income ranges: 4.9% for AGIs below $25k, 13.8% for AGIs $25k-50k, 15.3% for AGIs $50k-75k, 38.6% for AGIs $75k-100k, 111.1% for AGIs $100k-200k)
Ordinary dividends: $3,021 (reported on 10.0% of returns)
Here:
$3,021
State:
$7,001
(% of AGI for various income ranges: 10.0% for AGIs below $25k, 24.4% for AGIs $25k-50k, 67.3% for AGIs $50k-75k, 221.1% for AGIs $100k-200k)
Net capital gain/loss in AGI: +$5,757 (reported on 10.0% of returns)
Here:
+$5,757
State:
+$19,855
(% of AGI for various income ranges: 1.3% for AGIs below $25k, 22.8% for AGIs $25k-50k, 265.7% for AGIs $75k-100k, 601.1% for AGIs $100k-200k)
Profit/loss from business: +$5,838 (reported on 15.0% of returns)
Here:
+$5,838
State:
+$9,904
(% of AGI for various income ranges: 89.3% for AGIs below $25k, 139.1% for AGIs $25k-50k, 54.7% for AGIs $50k-75k, 40.0% for AGIs $75k-100k, 298.9% for AGIs $100k-200k)
Taxable individual retirement arrangement distribution: $19,864 (reported on 7.9% of returns)
74030:
$19,864
Oklahoma:
$20,476
(% of AGI for various income ranges: 57.3% for AGIs below $25k, 75.3% for AGIs $25k-50k, 468.0% for AGIs $50k-75k, 1093.3% for AGIs $100k-200k)
Total itemized deductions: $29,200 (reported on 3.6% of returns)
Here:
$29,200
State:
$39,736
(% of AGI for various income ranges: 169.4% for AGIs $25k-50k, 1020.0% for AGIs $100k-200k)
Charity contributions: $10,733 (reported on 2.1% of returns)
Here:
$10,733
State:
$17,288
(% of AGI for various income ranges: 460.0% for AGIs $75k-100k)
Taxes paid: $5,560 (reported on 3.6% of returns)
74030:
$5,560
State:
$7,046
(% of AGI for various income ranges: 16.2% for AGIs below $25k, 227.8% for AGIs $100k-200k)
Earned income credit: $2,488 (reported on 24.3% of returns)
Here:
$2,488
State:
$2,435
(% of AGI for various income ranges: 128.4% for AGIs below $25k, 83.8% for AGIs $25k-50k)
Percentage of individuals using paid preparers for their 2020 taxes: 95.7%
Here:
96%
State:
94%
(% for various income ranges: 94.7% for AGIs below $25k, 94.9% for AGIs $25k-50k, 94.7% for AGIs $50k-75k, 100.0% for AGIs $75k-100k, 100.0% for AGIs $100k-200k, 100.0% for AGIs over 200k)
Averages for the 2012 tax year for zip code 74030, filed in 2013:
Average Adjusted Gross Income (AGI) in 2012: $50,221 (Individual Income Tax Returns)
Here:
$50,221
State:
$58,581
Salary/wage: $41,356 (reported on 84.8% of returns)
Here:
$41,356
State:
$45,973
(% of AGI for various income ranges: 74.7% for AGIs below $25k, 81.3% for AGIs $25k-50k, 85.4% for AGIs $50k-75k, 85.7% for AGIs $75k-100k, 72.7% for AGIs $100k-200k, 33.1% for AGIs over 200k)
Taxable interest for individuals: $1,218 (reported on 22.5% of returns)
This zip code:
$1,218
Oklahoma:
$1,625
(% of AGI for various income ranges: 1.0% for AGIs below $25k, 0.9% for AGIs $25k-50k, 0.2% for AGIs $50k-75k, 0.7% for AGIs $75k-100k, 0.4% for AGIs $100k-200k, 0.3% for AGIs over 200k)
Ordinary dividends: $9,588 (reported on 11.3% of returns)
Here:
$9,588
State:
$6,374
(% of AGI for various income ranges: 0.9% for AGIs below $25k, 1.0% for AGIs $25k-50k, 0.8% for AGIs $50k-75k, 8.7% for AGIs $100k-200k)
Net capital gain/loss in AGI: +$6,971 (reported on 11.3% of returns)
Here:
+$6,971
State:
+$24,023
(% of AGI for various income ranges: 0.3% for AGIs below $25k, 0.4% for AGIs $75k-100k, 4.1% for AGIs $100k-200k, 3.0% for AGIs over 200k)
Profit/loss from business: +$7,607 (reported on 17.9% of returns)
Here:
+$7,607
State:
+$11,913
(% of AGI for various income ranges: 7.5% for AGIs below $25k, 3.2% for AGIs $25k-50k, 0.6% for AGIs $50k-75k, 1.9% for AGIs $75k-100k, 5.1% for AGIs $100k-200k)
Taxable individual retirement arrangement distribution: $9,433 (reported on 7.9% of returns)
74030:
$9,433
Oklahoma:
$15,242
(% of AGI for various income ranges: 2.4% for AGIs below $25k, 1.6% for AGIs $25k-50k, 2.5% for AGIs $50k-75k, 2.7% for AGIs $100k-200k)
Total itemized deductions: $26,785 (22% of AGI, reported on 17.9% of returns)
Here:
$26,785
State:
$24,882
Here:
22.2% of AGI
State:
18.8% of AGI
(% of AGI for various income ranges: 6.4% for AGIs below $25k, 6.3% for AGIs $25k-50k, 6.3% for AGIs $50k-75k, 7.6% for AGIs $75k-100k, 9.7% for AGIs $100k-200k, 17.3% for AGIs over 200k)
Charity contributions: $5,710 (reported on 13.2% of returns)
Here:
$5,710
State:
$6,591
(% of AGI for various income ranges: 1.2% for AGIs $25k-50k, 0.8% for AGIs $50k-75k, 1.3% for AGIs $75k-100k, 1.7% for AGIs $100k-200k, 2.9% for AGIs over 200k)
Taxes paid: $5,667 (reported on 17.9% of returns)
74030:
$5,667
State:
$7,196
(% of AGI for various income ranges: 0.6% for AGIs below $25k, 0.8% for AGIs $25k-50k, 1.2% for AGIs $50k-75k, 1.7% for AGIs $75k-100k, 3.1% for AGIs $100k-200k, 3.5% for AGIs over 200k)
Earned income credit: $2,223 (reported on 23.2% of returns)
Here:
$2,223
State:
$2,354
(% of AGI for various income ranges: 7.7% for AGIs below $25k, 1.3% for AGIs $25k-50k)
Percentage of individuals using paid preparers for their 2012 taxes: 65.6%
Here:
66%
State:
56%
(% for various income ranges: 61.9% for AGIs below $25k, 65.0% for AGIs $25k-50k, 70.0% for AGIs $50k-75k, 66.7% for AGIs $75k-100k, 75.0% for AGIs $100k-200k, 75.0% for AGIs over 200k)
Averages for the 2004 tax year for zip code 74030, filed in 2005:
Average Adjusted Gross Income (AGI) in 2004: $31,984 (Individual Income Tax Returns)
Here:
$31,984
State:
$41,245
Salary/wage: $28,951 (reported on 84.1% of returns)
Here:
$28,951
State:
$35,318
(% of AGI for various income ranges: 95.8% for AGIs below $10k, 77.5% for AGIs $10k-25k, 83.7% for AGIs $25k-50k, 83.4% for AGIs $50k-75k, 74.6% for AGIs $75k-100k, 51.8% for AGIs over 100k)
Taxable interest for individuals: $1,800 (reported on 30.6% of returns)
This zip code:
$1,800
Oklahoma:
$1,745
(% of AGI for various income ranges: 3.2% for AGIs below $10k, 2.4% for AGIs $10k-25k, 1.3% for AGIs $25k-50k, 0.7% for AGIs $50k-75k, 3.5% for AGIs $75k-100k, 1.7% for AGIs over 100k)
Taxable dividends: $3,233 (reported on 14.6% of returns)
Here:
$3,233
State:
$2,920
(% of AGI for various income ranges: 1.2% for AGIs below $10k, 0.8% for AGIs $10k-25k, 0.9% for AGIs $25k-50k, 0.3% for AGIs $50k-75k, 1.2% for AGIs $75k-100k, 4.6% for AGIs over 100k)
Net capital gain/loss: +$1,455 (reported on 13.0% of returns)
Here:
+$1,455
State:
+$10,653
(% of AGI for various income ranges: -1.6% for AGIs below $10k, 0.3% for AGIs $10k-25k, 0.1% for AGIs $25k-50k, -0.0% for AGIs $50k-75k, 2.4% for AGIs $75k-100k, 1.6% for AGIs over 100k)
Profit/loss from business: +$7,654 (reported on 20.5% of returns)
Here:
+$7,654
State:
+$8,532
(% of AGI for various income ranges: 2.3% for AGIs below $10k, 5.2% for AGIs $10k-25k, 1.7% for AGIs $25k-50k, 2.8% for AGIs $50k-75k, 2.9% for AGIs $75k-100k, 13.8% for AGIs over 100k)
IRA payment deduction: $3,192 (reported on 1.8% of returns)
74030:
$3,192
Oklahoma:
$3,127
Total itemized deductions: $15,483 (24% of AGI, reported on 20.1% of returns)
Here:
$15,483
State:
$17,093
Here:
24.1% of AGI
State:
20.5% of AGI
(% of AGI for various income ranges: 7.8% for AGIs $10k-25k, 8.3% for AGIs $25k-50k, 9.6% for AGIs $50k-75k, 9.8% for AGIs $75k-100k, 15.6% for AGIs over 100k)
Charity contributions deductions: $4,166 (6% of AGI, reported on 16.0% of returns)
Here:
$4,166
State:
$4,240
Here:
6.2% of AGI
State:
4.8% of AGI
(% of AGI for various income ranges: 1.1% for AGIs $10k-25k, 1.0% for AGIs $25k-50k, 1.4% for AGIs $50k-75k, 1.9% for AGIs $75k-100k, 5.8% for AGIs over 100k)
Total tax: $4,091 (reported on 67.3% of returns)
74030:
$4,091
State:
$6,542
(% of AGI for various income ranges: 3.1% for AGIs below $10k, 3.6% for AGIs $10k-25k, 5.4% for AGIs $25k-50k, 8.4% for AGIs $50k-75k, 11.7% for AGIs $75k-100k, 17.5% for AGIs over 100k)
Earned income credit: $1,756 (reported on 25.6% of returns)
Here:
$1,756
State:
$1,830
Percentage of individuals using paid preparers for their 2004 taxes: 70.5%
Here:
71%
State:
63%
(% for various income ranges: 63.7% for AGIs below $10k, 69.0% for AGIs $10k-25k, 72.7% for AGIs $25k-50k, 75.6% for AGIs $50k-75k, 81.0% for AGIs $75k-100k, 85.5% for AGIs over 100k)
Likely homosexual households (counted as self-reported same-sex unmarried-partner households)
Lesbian couples: 0.7% of all households
Gay men: 0.0% of all households
Household received Food Stamps/SNAP in the past 12 months: 358 Household did not receive Food Stamps/SNAP in the past 12 months: 1,049
Women who had a birth in the past 12 months: 10 (5 now married, 4 unmarried) Women who did not have a birth in the past 12 months: 590 (244 now married, 346 unmarried)
Housing units in zip code 74030 with a mortgage: 367 Median monthly owner costs for units with a mortgage: $894 Median monthly owner costs for units without a mortgage: $369
Residents with income below the poverty level in 2022:
This zip code:
22.9%
Whole state:
15.7%
Residents with income below 50% of the poverty level in 2022:
This zip code:
11.5%
Whole state:
8.3%
Median number of rooms in houses and condos:
Here:
5.2
State:
6.1
Median number of rooms in apartments:
Here:
4.4
State:
4.5
Notable locations in this zip code not listed on our city pages
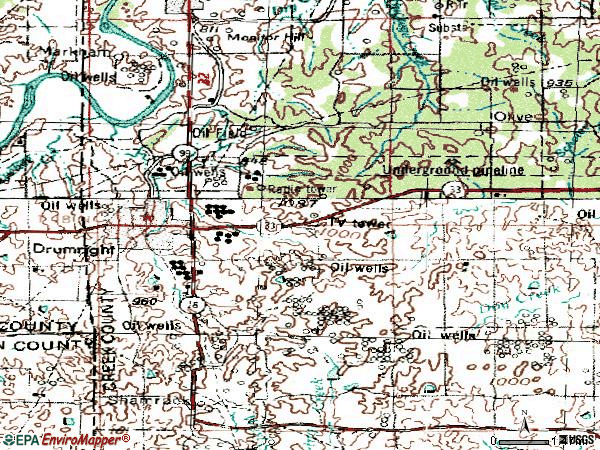
Notable locations in zip code 74030: Olive Volunteer Fire Department (A), Drumright Fire and Rescue (B), Creek County Emergency Ambulance Service District Station 3 (C). Display/hide their locations on the map
Reservoirs: Little Deep Fork Creek Site 6 Reservoir (A), Little Deep Fork Creek Site 5 Reservoir (B), Little Deep Fork Creek Site 7 Reservoir (C), Tydol Lake (D), Oknoname 037011 Reservoir (E), Oknoname 037015 Reservoir (F), Oknoname 037077 Reservoir (G). Display/hide their locations on the map
In group quarters: 68 (-1 institutionalized population)
Size of family households: 400 2-persons, 133 3-persons, 165 4-persons, 22 5-persons, 31 6-persons, 4 7-or-more-persons
Size of nonfamily households: 559 1-person, 66 2-persons
329 married couples with children.
189 single-parent households (49 men, 140 women).
99.1% of residents of 74030 zip code speak English at home.
1.0% of residents speak Spanish at home (100% very well).
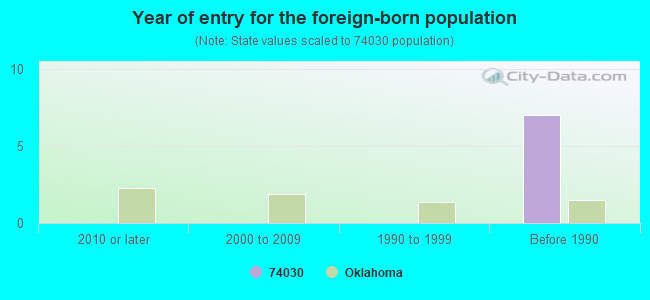
Foreign born population: 5 (0.2%) (100.0% of them are naturalized citizens)
This zip code:
0.2%
Whole state:
6.0%
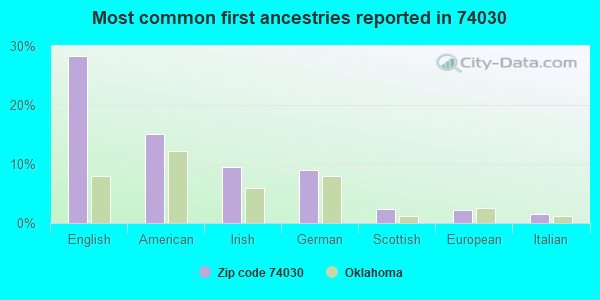
28%English
15%American
10%Irish
9%German
2%Scottish
2%European
2%Italian
Year of entry for the foreign-born population
02010 or later
02000 to 2009
01990 to 1999
7Before 1990
Major facilities with environmental interests located in this zip code:
3J OIL COMPANY (SEC. 06-17N-7E in DRUMRIGHT, OK)
ENFORCEMENT/COMPLIANCE ACTIVITY (Integrated Compliance Information System) - ICIS-06-2002-1816, FORMAL ENFORCEMENT ACTION (Integrated Compliance Information System) - ICIS-06-2002-1816, FORMAL ENFORCEMENT ACTION National Pollutant Discharge Elimination System NON-MAJOR (Tracking pollutant discharge elimination systems) - permit Business SIC classification: CRUDE PETROLEUM AND NATURAL GAS
CITY OF DRUMRIGHT WTR TRT PLNT (1700 WEST BROADWAY in DRUMRIGHT, OK)
National Pollutant Discharge Elimination System NON-MAJOR (Tracking pollutant discharge elimination systems) - permit COMMUNITY WATER SYSTEM (SDWIS) - SDWIS-OK2001902 11025, WATER TREATMENT PLANT Business SIC classification: WATER SUPPLY Alternative names: CITY OF DRUMRIGHT-WATER PLANT, DRUMRIGHT, CITY OF, DRUMRIGHT UTILITY TRUST AUTH, WATER PLANT
BRADLEY ES (508 SOUTH SKINNER in DRUMRIGHT, OK)
(National Center for Education Statistics) - STATE ID-19-I039-115 Organizations: DRUMRIGHT (SCHOOL DISTRICT)
DRUMRIGHT HS (301 S. PENN in DRUMRIGHT, OK)
(National Center for Education Statistics) - STATE ID-19-I039-705
EDISON ES (300 EAST PINE STEET in DRUMRIGHT, OK)
(National Center for Education Statistics) - STATE ID-19-I039-110 Organizations: DRUMRIGHT (SCHOOL DISTRICT)
BEREXCO INC. (PO BOX 231 in DRUMRIGHT, OK)
(Integrated Compliance Information System) - ICIS-06-2001-0263, FORMAL ENFORCEMENT ACTION Business SIC classification: CRUDE PETROLEUM AND NATURAL GAS
DUKE ENERGY FIELD SERVICES: HARD GRAVES BOOSTER DISCHARGE PIPELINE (SECTION 21-T18N-R10E in DRUMRIGHT, OK)
(Integrated Compliance Information System) - ICIS-06-2002-4561, FORMAL ENFORCEMENT ACTION Business SIC classification: NATURAL GAS LIQUIDS
ENERGY LEASE SVC INC (123 S OHIO AVE in DRUMRIGHT, OK)
(Integrated Compliance Information System) - ICIS-06-2000-0133, FORMAL ENFORCEMENT ACTION, ICIS-06-2001-0001, Business SIC classification: CRUDE PETROLEUM AND NATURAL GAS
LITTLE RIVER ENERGY COMPANY (109 EAST BROADWAY in DRUMRIGHT, OK)
(Integrated Compliance Information System) - ICIS-06-2003-4522, FORMAL ENFORCEMENT ACTION
ARCO OIL & GAS-DRUMSIGHT GAS PLNT (5M E 1.5M N in DRUMRIGHT, OK)
(Resource Conservation and Recovery Act (tracking hazardous waste)) Organizations: ARCO OIL & GAS CO A DIV OF ATL RICHFIELD (CONTACT/OPERATOR)
BRUCE STONE & SAND CO (TRUCK BY PASS N W OF CITY in DRUMRIGHT, OK)
(Resource Conservation and Recovery Act (tracking hazardous waste)) Organizations: TOMMY C BRUCE (CONTACT/OWNER)
BP PIPELINES NORTH /DRUMRIGHT TANK FARM (1 MI E OFF HWY 33 in DRUMRIGHT, OK)
AIR MINOR (AIRS/AFS) Business SIC classification: CRUDE PETROLEUM PIPELINES Alternative names: AMOCO PIPELINE CO /DRUMRIGHT TANK FARM
CENTRAL OKLAHOMA VO-TECH (3 CT CIRCLE in DRUMRIGHT, OK)
COMPLIANCE ACTIVITY (Tracking inspections of insecticide, fungicide, and rodenticide, and toxic substances) Conditionally Exempt Small Quantity Generators, less than 100 kg/month of hazardous waste (Resource Conservation and Recovery Act (tracking hazardous waste)) - notification Organizations: CENTRAL VO-TECH BD OF EDUCATION (CONTACT/OWNER)
Housing units lacking complete plumbing facilities: 8.3% Housing units lacking complete kitchen facilities: 3.2%
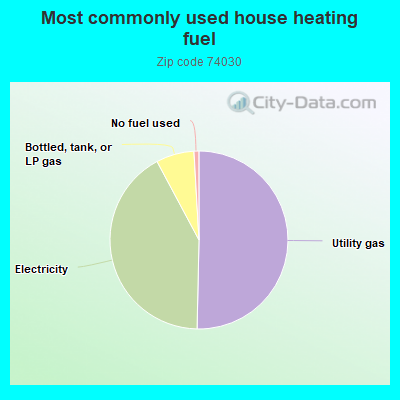
50.3%Utility gas
41.8%Electricity
6.9%Bottled, tank, or LP gas
0.9%No fuel used
Population in 1990: 7,886.
Place of birth for U.S.-born residents:
This state: 2,275
Northeast: 36
Midwest: 341
South: 172
West: 160
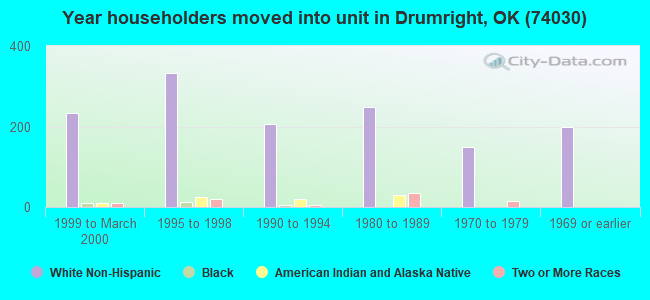
57% of the 74030 zip code residents lived in the same house 5 years ago. Out of people who lived in different houses, 52% lived in this county. Out of people who lived in different counties, 50% lived in Oklahoma.
93% of the 74030 zip code residents lived in the same house 1 year ago. Out of people who lived in different houses, 58% moved from this county. Out of people who lived in different houses, 24% moved from different county within same state. Out of people who lived in different houses, 16% moved from different state. Out of people who lived in different houses, 6% moved from abroad.
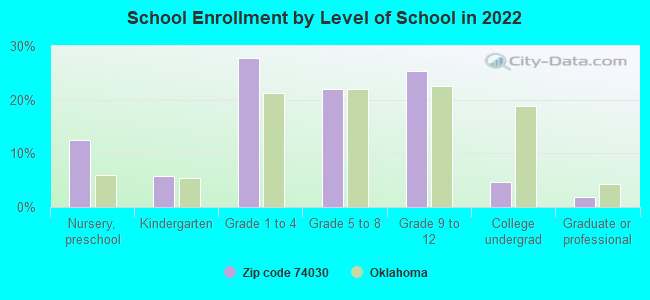
Private vs. public school enrollment:
Students in private schools in grades 1 to 8 (elementary and middle school): 5
Here:
2.0%
Oklahoma:
11.7%
Students in private schools in grades 9 to 12 (high school): 4
Here:
3.1%
Oklahoma:
11.7%
Students in private undergraduate colleges: 2
Here:
9.5%
Oklahoma:
19.3%
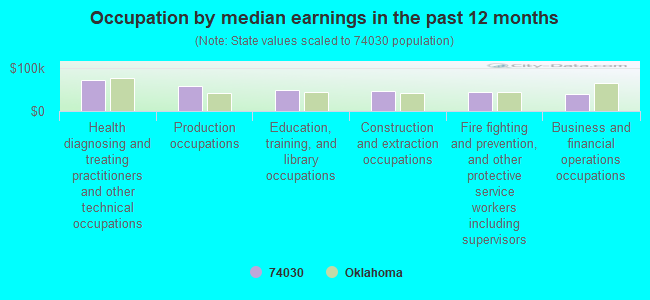
Occupation by median earnings in the past 12 months ($)
71,626Health diagnosing and treating practitioners and other technical occupations
58,813Production occupations
49,538Education, training, and library occupations
47,357Construction and extraction occupations
44,240Fire fighting and prevention, and other protective service workers including supervisors
39,756Business and financial operations occupations
Companies with federal contracts located in this zip code:
OMNI MFG INC (100 SOUTH OHIO STREET in DRUMRIGHT, OK; small business) 50 employees, $0 revenue. : $1,200,933 in 5 contractsfrom 2000 to 2001
Contracts for Navigational Instruments by Defense Logistics Agency Signed by year:2000: $197,106; 2001: $1,003,827; 2002: $0; 2003: $0; 2004: $0; 2005: $0; 2006: $0.
Biggest contracts:
$484,726 with Defense Logistics Agency for Navigational Instruments. Signed on 2001-09-26. Completion date: 2002-01-04.
$420,548, same as above.Signed on 2001-10-26. Completion date: 2002-02-26.
$98,553, same as above.Signed on 2001-09-13. Completion date: 2002-02-15.
$98,553, same as above.Signed on 2000-09-01. Completion date: 2001-02-28.
HAUSNER'S PRECAST CONCRETE PRO (505 N GRIFFITH in DRUMRIGHT, OK; small business) 30 employees, $5397733 revenue. Small Disadvantaged Business
$10,000 with Public Health Service for Construction of Structures and Facilities -- Sewage and Waste Facilities. Signed on 2000-05-15. Completion date: 2001-05-15.
Top industries in this zip code by the number of employees in 2005:
Health Care and Social Assistance: Nursing Care Facilities (50-99 employees: 1 establishment, 1-4 employees: 1 establishment)
Mining: Crude Petroleum and Natural Gas Extraction (20-49: 1, 10-19: 1, 1-4: 12)
Finance and Insurance: Commercial Banking (50-99: 1)
Accommodation and Food Services: Limited-Service Restaurants (20-49: 1, 10-19: 1)
Mining: Support Activities for Oil and Gas Operations (10-19: 2, 1-4: 6)
Accommodation and Food Services: Full-Service Restaurants (20-49: 1)
Construction: Oil and Gas Pipeline and Related Structures Construction (20-49: 1)
Health Care and Social Assistance: General Medical and Surgical Hospitals (20-49: 1)
People in group quarters in 2010:
62 people in nursing facilities/skilled-nursing facilities
People in group quarters in 2000:
81 people in nursing homes
Fatal accident statistics in 2010:
Fatal accident count: 1
Vehicles involved in fatal accidents: 2
Fatal accidents caused by drunken drivers: 1
Fatalities: 1
Persons involved in fatal accidents: 2
Pedestrians involved in fatal accidents: 0
Home Mortgage Disclosure Act Aggregated Statistics For Year 2009 (Based on 4 partial tracts)
A) FHA, FSA/RHS & VA Home Purchase Loans
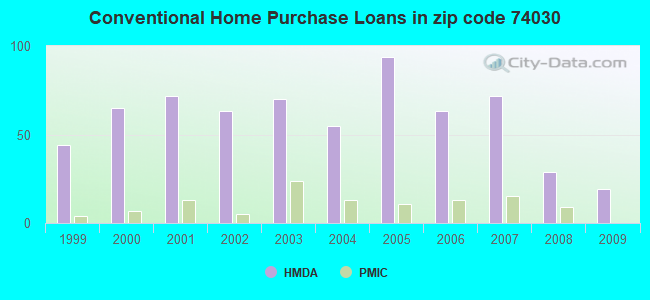
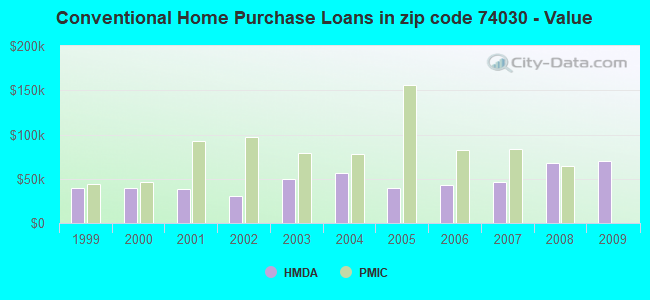
B) Conventional Home Purchase Loans
C) Refinancings
D) Home Improvement Loans
F) Non-occupant Loans on < 5 Family Dwellings (A B C & D)
G) Loans On Manufactured Home Dwelling (A B C & D)
Number
Average Value
Number
Average Value
Number
Average Value
Number
Average Value
Number
Average Value
Number
Average Value
LOANS ORIGINATED
18
$66,363
19
$70,383
85
$72,458
19
$21,427
8
$61,040
25
$53,023
APPLICATIONS APPROVED, NOT ACCEPTED
2
$50,650
0
$0
6
$113,460
0
$0
0
$0
0
$0
APPLICATIONS DENIED
2
$18,090
18
$50,825
31
$88,650
18
$18,547
0
$0
9
$48,457
APPLICATIONS WITHDRAWN
4
$56,032
6
$75,680
11
$70,285
0
$0
4
$32,115
4
$116,680
FILES CLOSED FOR INCOMPLETENESS
0
$0
0
$0
7
$73,910
2
$58,795
0
$0
0
$0
Aggregated Statistics For Year 2008 (Based on 4 partial tracts)
A) FHA, FSA/RHS & VA Home Purchase Loans
B) Conventional Home Purchase Loans
C) Refinancings
D) Home Improvement Loans
F) Non-occupant Loans on < 5 Family Dwellings (A B C & D)
G) Loans On Manufactured Home Dwelling (A B C & D)
Number
Average Value
Number
Average Value
Number
Average Value
Number
Average Value
Number
Average Value
Number
Average Value
LOANS ORIGINATED
23
$67,377
29
$67,450
63
$60,066
29
$23,005
20
$28,313
17
$47,088
APPLICATIONS APPROVED, NOT ACCEPTED
0
$0
12
$87,848
9
$79,596
2
$7,235
0
$0
6
$90,138
APPLICATIONS DENIED
1
$60,600
23
$51,763
48
$83,742
30
$12,375
4
$51,890
15
$54,236
APPLICATIONS WITHDRAWN
2
$46,820
11
$102,126
20
$96,624
2
$30,975
0
$0
4
$61,958
FILES CLOSED FOR INCOMPLETENESS
0
$0
2
$46,130
4
$85,508
0
$0
0
$0
2
$46,130
Aggregated Statistics For Year 2007 (Based on 4 partial tracts)
A) FHA, FSA/RHS & VA Home Purchase Loans
B) Conventional Home Purchase Loans
C) Refinancings
D) Home Improvement Loans
F) Non-occupant Loans on < 5 Family Dwellings (A B C & D)
G) Loans On Manufactured Home Dwelling (A B C & D)
Number
Average Value
Number
Average Value
Number
Average Value
Number
Average Value
Number
Average Value
Number
Average Value
LOANS ORIGINATED
9
$67,836
72
$46,074
77
$55,139
37
$14,159
28
$29,069
36
$33,484
APPLICATIONS APPROVED, NOT ACCEPTED
0
$0
13
$74,106
7
$75,979
5
$35,456
2
$18,090
9
$41,114
APPLICATIONS DENIED
4
$86,038
32
$51,333
55
$77,355
20
$26,343
6
$32,867
12
$43,015
APPLICATIONS WITHDRAWN
0
$0
9
$65,901
26
$73,853
6
$22,892
2
$16,160
0
$0
FILES CLOSED FOR INCOMPLETENESS
0
$0
0
$0
2
$74,810
2
$63,315
0
$0
0
$0
Aggregated Statistics For Year 2006 (Based on 4 partial tracts)
A) FHA, FSA/RHS & VA Home Purchase Loans
B) Conventional Home Purchase Loans
C) Refinancings
D) Home Improvement Loans
F) Non-occupant Loans on < 5 Family Dwellings (A B C & D)
G) Loans On Manufactured Home Dwelling (A B C & D)
Number
Average Value
Number
Average Value
Number
Average Value
Number
Average Value
Number
Average Value
Number
Average Value
LOANS ORIGINATED
5
$39,544
63
$43,422
93
$49,036
50
$25,896
20
$35,708
31
$28,776
APPLICATIONS APPROVED, NOT ACCEPTED
0
$0
7
$61,247
13
$66,098
1
$9,360
0
$0
7
$58,663
APPLICATIONS DENIED
3
$82,893
31
$50,696
56
$63,491
19
$31,762
2
$4,525
28
$54,399
APPLICATIONS WITHDRAWN
0
$0
7
$72,426
41
$93,498
4
$16,500
0
$0
1
$60,160
FILES CLOSED FOR INCOMPLETENESS
0
$0
0
$0
8
$125,345
0
$0
0
$0
0
$0
Aggregated Statistics For Year 2005 (Based on 4 partial tracts)
A) FHA, FSA/RHS & VA Home Purchase Loans
B) Conventional Home Purchase Loans
C) Refinancings
D) Home Improvement Loans
E) Loans on Dwellings For 5+ Families
F) Non-occupant Loans on < 5 Family Dwellings (A B C & D)
G) Loans On Manufactured Home Dwelling (A B C & D)
Number
Average Value
Number
Average Value
Number
Average Value
Number
Average Value
Number
Average Value
Number
Average Value
Number
Average Value
LOANS ORIGINATED
4
$52,445
94
$39,668
83
$55,294
71
$16,108
2
$13,570
26
$23,492
47
$34,840
APPLICATIONS APPROVED, NOT ACCEPTED
0
$0
20
$68,052
9
$55,074
2
$27,135
0
$0
0
$0
16
$72,184
APPLICATIONS DENIED
4
$87,780
32
$55,317
80
$75,371
22
$27,567
0
$0
5
$28,596
24
$56,558
APPLICATIONS WITHDRAWN
0
$0
14
$42,598
56
$72,318
9
$60,471
0
$0
4
$54,722
7
$51,219
FILES CLOSED FOR INCOMPLETENESS
0
$0
0
$0
9
$98,088
0
$0
0
$0
0
$0
0
$0
Aggregated Statistics For Year 2004 (Based on 4 partial tracts)
A) FHA, FSA/RHS & VA Home Purchase Loans
B) Conventional Home Purchase Loans
C) Refinancings
D) Home Improvement Loans
F) Non-occupant Loans on < 5 Family Dwellings (A B C & D)
G) Loans On Manufactured Home Dwelling (A B C & D)
Number
Average Value
Number
Average Value
Number
Average Value
Number
Average Value
Number
Average Value
Number
Average Value
LOANS ORIGINATED
4
$39,798
55
$56,890
101
$57,061
39
$12,714
19
$37,194
14
$33,643
APPLICATIONS APPROVED, NOT ACCEPTED
0
$0
15
$59,518
31
$61,183
2
$18,025
0
$0
15
$53,587
APPLICATIONS DENIED
2
$27,135
26
$36,263
96
$64,078
18
$19,452
0
$0
42
$48,917
APPLICATIONS WITHDRAWN
0
$0
8
$57,966
52
$86,238
1
$20,050
2
$117,585
3
$54,153
FILES CLOSED FOR INCOMPLETENESS
0
$0
2
$32,560
6
$65,385
0
$0
0
$0
2
$32,560
Aggregated Statistics For Year 2003 (Based on 4 partial tracts)
A) FHA, FSA/RHS & VA Home Purchase Loans
B) Conventional Home Purchase Loans
C) Refinancings
D) Home Improvement Loans
E) Loans on Dwellings For 5+ Families
F) Non-occupant Loans on < 5 Family Dwellings (A B C & D)
Number
Average Value
Number
Average Value
Number
Average Value
Number
Average Value
Number
Average Value
Number
Average Value
LOANS ORIGINATED
14
$51,728
70
$49,835
110
$55,954
61
$16,092
2
$6,933,895
12
$25,422
APPLICATIONS APPROVED, NOT ACCEPTED
0
$0
15
$44,433
22
$55,156
2
$31,660
0
$0
2
$19,900
APPLICATIONS DENIED
5
$91,898
73
$88,244
58
$64,004
19
$6,252
0
$0
36
$133,313
APPLICATIONS WITHDRAWN
0
$0
11
$90,121
32
$50,409
7
$9,303
0
$0
2
$20,805
FILES CLOSED FOR INCOMPLETENESS
2
$28,040
4
$48,390
2
$54,270
0
$0
0
$0
0
$0
Aggregated Statistics For Year 2002 (Based on 2 partial tracts)
A) FHA, FSA/RHS & VA Home Purchase Loans
B) Conventional Home Purchase Loans
C) Refinancings
D) Home Improvement Loans
F) Non-occupant Loans on < 5 Family Dwellings (A B C & D)
Number
Average Value
Number
Average Value
Number
Average Value
Number
Average Value
Number
Average Value
LOANS ORIGINATED
4
$76,430
63
$30,322
89
$51,465
54
$11,089
25
$22,576
APPLICATIONS APPROVED, NOT ACCEPTED
0
$0
11
$45,554
4
$45,678
4
$7,688
0
$0
APPLICATIONS DENIED
2
$44,320
45
$29,668
49
$43,970
13
$8,628
5
$54,994
APPLICATIONS WITHDRAWN
4
$37,538
5
$50,290
62
$42,978
2
$7,235
4
$12,210
FILES CLOSED FOR INCOMPLETENESS
0
$0
2
$28,945
11
$94,233
0
$0
2
$45,225
Aggregated Statistics For Year 2001 (Based on 2 partial tracts)
A) FHA, FSA/RHS & VA Home Purchase Loans
B) Conventional Home Purchase Loans
C) Refinancings
D) Home Improvement Loans
F) Non-occupant Loans on < 5 Family Dwellings (A B C & D)
Number
Average Value
Number
Average Value
Number
Average Value
Number
Average Value
Number
Average Value
LOANS ORIGINATED
9
$85,626
72
$37,989
42
$38,678
38
$12,092
14
$24,680
APPLICATIONS APPROVED, NOT ACCEPTED
0
$0
14
$42,382
7
$69,517
2
$7,235
0
$0
APPLICATIONS DENIED
0
$0
76
$35,585
69
$49,630
16
$10,289
2
$4,525
APPLICATIONS WITHDRAWN
0
$0
5
$38,712
40
$41,245
13
$13,776
5
$15,920
FILES CLOSED FOR INCOMPLETENESS
0
$0
2
$113,065
7
$60,989
0
$0
2
$113,065
Aggregated Statistics For Year 2000 (Based on 2 partial tracts)
A) FHA, FSA/RHS & VA Home Purchase Loans
B) Conventional Home Purchase Loans
C) Refinancings
D) Home Improvement Loans
F) Non-occupant Loans on < 5 Family Dwellings (A B C & D)
Number
Average Value
Number
Average Value
Number
Average Value
Number
Average Value
Number
Average Value
LOANS ORIGINATED
13
$39,242
65
$39,047
65
$37,238
42
$9,691
22
$21,708
APPLICATIONS APPROVED, NOT ACCEPTED
4
$35,275
24
$44,698
9
$52,260
5
$12,302
0
$0
APPLICATIONS DENIED
4
$32,110
56
$29,849
18
$42,210
20
$14,834
2
$7,235
APPLICATIONS WITHDRAWN
4
$40,250
9
$49,446
14
$60,860
2
$18,090
0
$0
FILES CLOSED FOR INCOMPLETENESS
0
$0
0
$0
2
$27,135
0
$0
0
$0
Aggregated Statistics For Year 1999 (Based on 2 partial tracts)
A) FHA, FSA/RHS & VA Home Purchase Loans
B) Conventional Home Purchase Loans
C) Refinancings
D) Home Improvement Loans
F) Non-occupant Loans on < 5 Family Dwellings (A B C & D)
Detailed PMIC statistics for the following Tracts:0207.04
, 0208.00
2002 - 2018 National Fire Incident Reporting System (NFIRS) incidents
According to the data from the years 2002 - 2018 the average number of fires per year is 34. The highest number of fires - 89 took place in 2016, and the least - 1 in 2003. The data has a growing trend.
When looking into fire subcategories, the most incidents belonged to: Outside Fires (76.9%), and Structure Fires (17.9%).
Fire incident types reported to NFIRS in Zip Code 74030


 Nearest zip codes: 74068, 74052, 74038, 74023, 74028, 74044.


 According to the data from the years 2002 - 2018 the average number of fires per year is 34. The highest number of fires - 89 took place in 2016, and the least - 1 in 2003. The data has a growing trend.
 When looking into fire subcategories, the most incidents belonged to: Outside Fires (76.9%), and Structure Fires (17.9%).