Estimated zip code population in 2022: 9,535 Zip code population in 2010: 9,067 Zip code population in 2000: 8,430
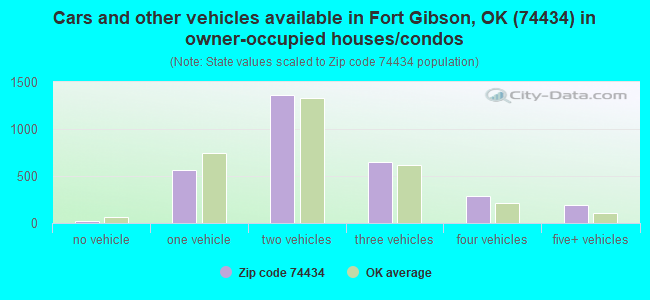
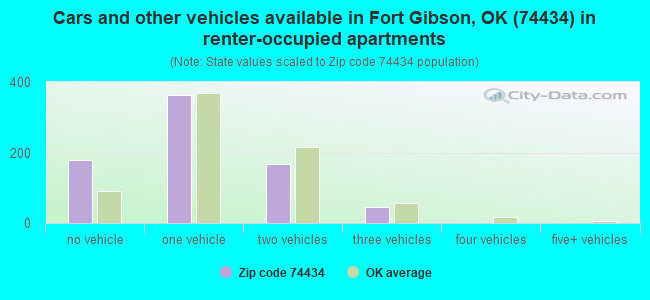
Houses and condos: 4,144 Renter-occupied apartments: 751
% of renters here:
20%
State:
35%
March 2022 cost of living index in zip code 74434: 78.9 (low, U.S. average is 100)
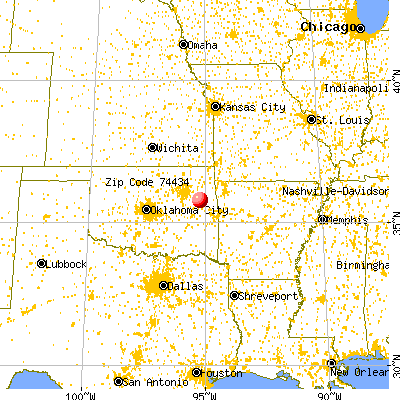
Land area: 90.3 sq. mi. Water area: 4.7 sq. mi.
Population density: 106 people per square mile
(very low).
OSM Map
General Map
Google Map
MSN Map
OSM Map
General Map
Google Map
MSN Map
OSM Map
General Map
Google Map
MSN Map
OSM Map
General Map
Google Map
MSN Map
Please wait while loading the map...
Real estate property taxes paid for housing units in 2022:
This zip code:
0.7% ($1,255)
Oklahoma:
0.8% ($1,501)
Median real estate property taxes paid for housing units with mortgages in 2022: $1,384 (0.7%) Median real estate property taxes paid for housing units with no mortgage in 2022: $1,015 (0.6%)
Business Search- 14 Million verified businesses
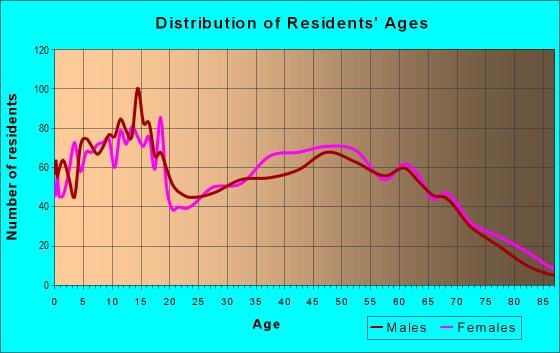
Males: 4,612
(48.4%)
Females: 4,923
(51.6%)
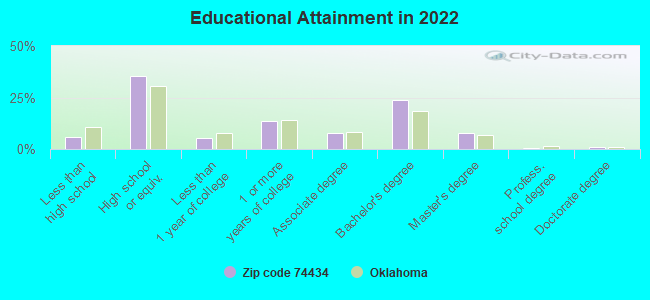
For population 25 years and over in 74434:
High school or higher: 94.4%
Bachelor's degree or higher: 32.8%
Graduate or professional degree: 9.2%
Unemployed: 2.8%
Mean travel time to work (commute): 24.8 minutes
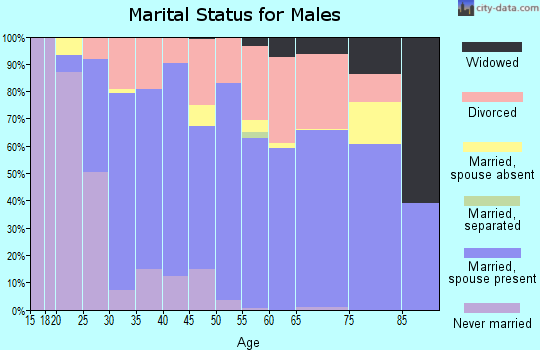
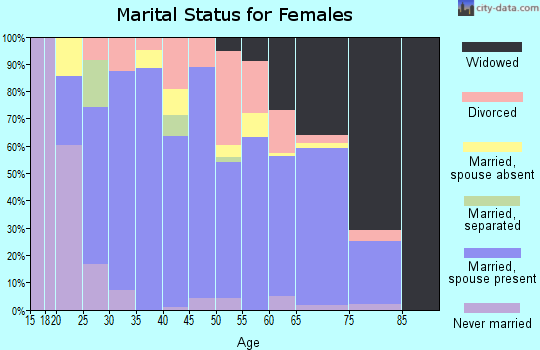
For population 15 years and over in 74434:
Never married: 23.8%
Now married: 56.4%
Separated: 0.9%
Widowed: 4.8%
Divorced: 14.1%
Zip code 74434 compared to state average:
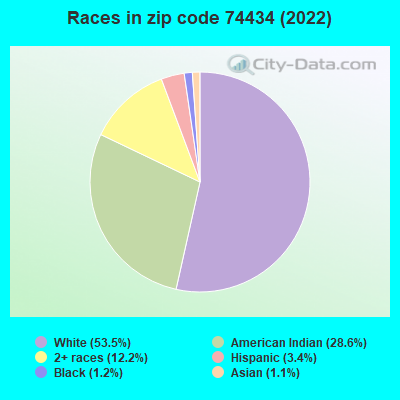
Black race population percentage significantly below state average.
Hispanic race population percentage significantly below state average.
Foreign-born population percentage significantly below state average.
Renting percentage below state average.
Length of stay since moving in significantly above state average.
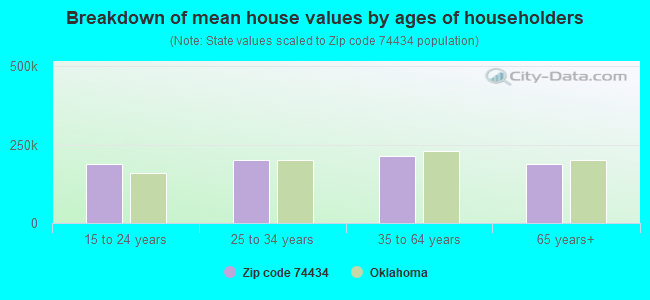
Estimated median house/condo value in 2022: $186,303
74434:
$186,303
Oklahoma:
$191,700
According to our research of Oklahoma and other state lists, there were 21 registered sex offenders living in 74434 zip code as of April 26, 2024. The ratio of all residents to sex offenders in zip code 74434 is 441 to 1. The ratio of registered sex offenders to all residents in this zip code is near the state average.
Median resident age:
This zip code:
38.7 years
Oklahoma median age:
37.1 years
Average household size:
This zip code:
2.5 people
Oklahoma:
2.5 people
Averages for the 2020 tax year for zip code 74434, filed in 2021:
Average Adjusted Gross Income (AGI) in 2020: $65,084 (Individual Income Tax Returns)
Here:
$65,084
State:
$63,060
Salary/wage: $56,121 (reported on 82.0% of returns)
Here:
$56,121
State:
$52,427
(% of AGI for various income ranges: 1046.9% for AGIs below $25k, 3678.7% for AGIs $25k-50k, 6192.1% for AGIs $50k-75k, 8892.3% for AGIs $75k-100k, 17430.8% for AGIs $100k-200k, 58465.0% for AGIs over 200k)
Taxable interest for individuals: $983 (reported on 26.8% of returns)
This zip code:
$983
Oklahoma:
$1,603
(% of AGI for various income ranges: 12.8% for AGIs below $25k, 23.9% for AGIs $25k-50k, 33.8% for AGIs $50k-75k, 58.7% for AGIs $75k-100k, 49.2% for AGIs $100k-200k, 540.0% for AGIs over 200k)
Ordinary dividends: $3,024 (reported on 12.2% of returns)
Here:
$3,024
State:
$7,001
(% of AGI for various income ranges: 8.5% for AGIs below $25k, 20.6% for AGIs $25k-50k, 41.4% for AGIs $50k-75k, 57.0% for AGIs $75k-100k, 170.0% for AGIs $100k-200k, 537.5% for AGIs over 200k)
Net capital gain/loss in AGI: +$15,654 (reported on 12.2% of returns)
Here:
+$15,654
State:
+$19,855
(% of AGI for various income ranges: 3.7% for AGIs below $25k, 29.6% for AGIs $25k-50k, 73.1% for AGIs $50k-75k, 87.3% for AGIs $75k-100k, 506.9% for AGIs $100k-200k, 11435.0% for AGIs over 200k)
Profit/loss from business: +$12,326 (reported on 16.4% of returns)
Here:
+$12,326
State:
+$9,904
(% of AGI for various income ranges: 109.8% for AGIs below $25k, 114.3% for AGIs $25k-50k, 200.5% for AGIs $50k-75k, 230.0% for AGIs $75k-100k, 388.6% for AGIs $100k-200k, 7255.0% for AGIs over 200k)
Taxable individual retirement arrangement distribution: $21,223 (reported on 9.3% of returns)
74434:
$21,223
Oklahoma:
$20,476
(% of AGI for various income ranges: 49.2% for AGIs below $25k, 97.2% for AGIs $25k-50k, 292.6% for AGIs $50k-75k, 490.0% for AGIs $75k-100k, 1003.1% for AGIs $100k-200k)
Total itemized deductions: $41,579 (reported on 6.4% of returns)
Here:
$41,579
State:
$39,736
(% of AGI for various income ranges: 70.1% for AGIs below $25k, 129.5% for AGIs $50k-75k, 212.3% for AGIs $75k-100k, 995.3% for AGIs $100k-200k, 11372.5% for AGIs over 200k)
Charity contributions: $17,132 (reported on 5.0% of returns)
Here:
$17,132
State:
$17,288
(% of AGI for various income ranges: 89.5% for AGIs $50k-75k, 263.1% for AGIs $100k-200k, 4830.0% for AGIs over 200k)
Taxes paid: $6,704 (reported on 6.4% of returns)
74434:
$6,704
State:
$7,046
(% of AGI for various income ranges: 7.2% for AGIs below $25k, 16.9% for AGIs $50k-75k, 54.3% for AGIs $75k-100k, 195.3% for AGIs $100k-200k, 1510.0% for AGIs over 200k)
Earned income credit: $2,322 (reported on 19.1% of returns)
Here:
$2,322
State:
$2,435
(% of AGI for various income ranges: 105.3% for AGIs below $25k, 98.7% for AGIs $25k-50k, 2.6% for AGIs $50k-75k)
Percentage of individuals using paid preparers for their 2020 taxes: 95.0%
Here:
95%
State:
94%
(% for various income ranges: 93.5% for AGIs below $25k, 96.4% for AGIs $25k-50k, 94.6% for AGIs $50k-75k, 97.5% for AGIs $75k-100k, 95.0% for AGIs $100k-200k, 92.9% for AGIs over 200k)
Averages for the 2012 tax year for zip code 74434, filed in 2013:
Average Adjusted Gross Income (AGI) in 2012: $52,423 (Individual Income Tax Returns)
Here:
$52,423
State:
$58,581
Salary/wage: $46,096 (reported on 86.1% of returns)
Here:
$46,096
State:
$45,973
(% of AGI for various income ranges: 77.9% for AGIs below $25k, 79.8% for AGIs $25k-50k, 79.1% for AGIs $50k-75k, 78.5% for AGIs $75k-100k, 79.7% for AGIs $100k-200k, 46.1% for AGIs over 200k)
Taxable interest for individuals: $1,037 (reported on 25.3% of returns)
This zip code:
$1,037
Oklahoma:
$1,625
(% of AGI for various income ranges: 0.7% for AGIs below $25k, 0.6% for AGIs $25k-50k, 0.6% for AGIs $50k-75k, 0.3% for AGIs $75k-100k, 0.5% for AGIs $100k-200k, 0.5% for AGIs over 200k)
Ordinary dividends: $2,105 (reported on 11.4% of returns)
Here:
$2,105
State:
$6,374
(% of AGI for various income ranges: 0.4% for AGIs below $25k, 0.6% for AGIs $25k-50k, 0.4% for AGIs $50k-75k, 0.3% for AGIs $75k-100k, 0.4% for AGIs $100k-200k, 0.9% for AGIs over 200k)
Net capital gain/loss in AGI: +$4,326 (reported on 8.6% of returns)
Here:
+$4,326
State:
+$24,023
(% of AGI for various income ranges: 0.1% for AGIs $25k-50k, 0.4% for AGIs $50k-75k, 0.4% for AGIs $75k-100k, 0.6% for AGIs $100k-200k, 3.7% for AGIs over 200k)
Profit/loss from business: +$13,210 (reported on 16.2% of returns)
Here:
+$13,210
State:
+$11,913
(% of AGI for various income ranges: 7.0% for AGIs below $25k, 3.1% for AGIs $25k-50k, 2.2% for AGIs $50k-75k, 1.8% for AGIs $75k-100k, 7.9% for AGIs $100k-200k)
Taxable individual retirement arrangement distribution: $14,527 (reported on 8.4% of returns)
74434:
$14,527
Oklahoma:
$15,242
(% of AGI for various income ranges: 1.8% for AGIs below $25k, 2.4% for AGIs $25k-50k, 2.0% for AGIs $50k-75k, 3.5% for AGIs $75k-100k, 2.7% for AGIs $100k-200k)
Total itemized deductions: $21,429 (22% of AGI, reported on 29.2% of returns)
Here:
$21,429
State:
$24,882
Here:
21.8% of AGI
State:
18.8% of AGI
(% of AGI for various income ranges: 5.2% for AGIs below $25k, 7.9% for AGIs $25k-50k, 10.3% for AGIs $50k-75k, 13.2% for AGIs $75k-100k, 15.2% for AGIs $100k-200k, 15.8% for AGIs over 200k)
Charity contributions: $5,629 (reported on 23.7% of returns)
Here:
$5,629
State:
$6,591
(% of AGI for various income ranges: 0.7% for AGIs below $25k, 1.4% for AGIs $25k-50k, 2.3% for AGIs $50k-75k, 2.8% for AGIs $75k-100k, 3.6% for AGIs $100k-200k, 3.2% for AGIs over 200k)
Taxes paid: $5,199 (reported on 29.0% of returns)
74434:
$5,199
State:
$7,196
(% of AGI for various income ranges: 0.6% for AGIs below $25k, 1.3% for AGIs $25k-50k, 2.0% for AGIs $50k-75k, 3.0% for AGIs $75k-100k, 4.4% for AGIs $100k-200k, 4.5% for AGIs over 200k)
Earned income credit: $2,414 (reported on 22.0% of returns)
Here:
$2,414
State:
$2,354
(% of AGI for various income ranges: 8.2% for AGIs below $25k, 1.8% for AGIs $25k-50k)
Percentage of individuals using paid preparers for their 2012 taxes: 55.4%
Here:
55%
State:
56%
(% for various income ranges: 49.3% for AGIs below $25k, 54.2% for AGIs $25k-50k, 58.9% for AGIs $50k-75k, 60.0% for AGIs $75k-100k, 65.9% for AGIs $100k-200k, 80.0% for AGIs over 200k)
Averages for the 2004 tax year for zip code 74434, filed in 2005:
Average Adjusted Gross Income (AGI) in 2004: $38,852 (Individual Income Tax Returns)
Here:
$38,852
State:
$41,245
Salary/wage: $35,566 (reported on 86.1% of returns)
Here:
$35,566
State:
$35,318
(% of AGI for various income ranges: 113.2% for AGIs below $10k, 78.6% for AGIs $10k-25k, 82.9% for AGIs $25k-50k, 81.6% for AGIs $50k-75k, 85.7% for AGIs $75k-100k, 64.0% for AGIs over 100k)
Taxable interest for individuals: $1,675 (reported on 34.6% of returns)
This zip code:
$1,675
Oklahoma:
$1,745
(% of AGI for various income ranges: 7.7% for AGIs below $10k, 1.7% for AGIs $10k-25k, 1.3% for AGIs $25k-50k, 1.2% for AGIs $50k-75k, 0.9% for AGIs $75k-100k, 1.8% for AGIs over 100k)
Taxable dividends: $1,856 (reported on 15.2% of returns)
Here:
$1,856
State:
$2,920
(% of AGI for various income ranges: 1.2% for AGIs below $10k, 0.4% for AGIs $10k-25k, 0.3% for AGIs $25k-50k, 0.4% for AGIs $50k-75k, 0.3% for AGIs $75k-100k, 1.9% for AGIs over 100k)
Net capital gain/loss: +$4,309 (reported on 11.1% of returns)
Here:
+$4,309
State:
+$10,653
(% of AGI for various income ranges: 0.2% for AGIs below $10k, 0.3% for AGIs $10k-25k, 0.7% for AGIs $25k-50k, 0.7% for AGIs $50k-75k, 0.5% for AGIs $75k-100k, 3.5% for AGIs over 100k)
Profit/loss from business: +$9,152 (reported on 17.9% of returns)
Here:
+$9,152
State:
+$8,532
(% of AGI for various income ranges: 5.8% for AGIs below $10k, 4.8% for AGIs $10k-25k, 3.2% for AGIs $25k-50k, 3.3% for AGIs $50k-75k, 2.5% for AGIs $75k-100k, 7.1% for AGIs over 100k)
IRA payment deduction: $3,333 (reported on 2.1% of returns)
74434:
$3,333
Oklahoma:
$3,127
(% of AGI for various income ranges: 0.2% for AGIs $10k-25k, 0.2% for AGIs $25k-50k, 0.2% for AGIs $50k-75k, 0.1% for AGIs $75k-100k, 0.2% for AGIs over 100k)
Self-employed pension: $19,083 (reported on 0.3% of returns)
Here:
$19,083
Oklahoma:
$14,276
Total itemized deductions: $16,548 (23% of AGI, reported on 33.5% of returns)
Here:
$16,548
State:
$17,093
Here:
23.2% of AGI
State:
20.5% of AGI
(% of AGI for various income ranges: 5.4% for AGIs below $10k, 7.2% for AGIs $10k-25k, 12.6% for AGIs $25k-50k, 14.5% for AGIs $50k-75k, 16.8% for AGIs $75k-100k, 17.9% for AGIs over 100k)
Charity contributions deductions: $4,026 (5% of AGI, reported on 29.3% of returns)
Here:
$4,026
State:
$4,240
Here:
5.4% of AGI
State:
4.8% of AGI
(% of AGI for various income ranges: 0.9% for AGIs below $10k, 1.4% for AGIs $10k-25k, 2.5% for AGIs $25k-50k, 3.1% for AGIs $50k-75k, 3.3% for AGIs $75k-100k, 4.3% for AGIs over 100k)
Total tax: $4,847 (reported on 71.2% of returns)
74434:
$4,847
State:
$6,542
(% of AGI for various income ranges: 3.3% for AGIs below $10k, 3.4% for AGIs $10k-25k, 5.5% for AGIs $25k-50k, 8.2% for AGIs $50k-75k, 9.3% for AGIs $75k-100k, 15.8% for AGIs over 100k)
Earned income credit: $1,850 (reported on 20.5% of returns)
Here:
$1,850
State:
$1,830
Percentage of individuals using paid preparers for their 2004 taxes: 64.1%
Here:
64%
State:
63%
(% for various income ranges: 58.1% for AGIs below $10k, 65.0% for AGIs $10k-25k, 66.0% for AGIs $25k-50k, 64.7% for AGIs $50k-75k, 64.2% for AGIs $75k-100k, 72.3% for AGIs over 100k)
Likely homosexual households (counted as self-reported same-sex unmarried-partner households)
Lesbian couples: 0.5% of all households
Gay men: 0.0% of all households
Household received Food Stamps/SNAP in the past 12 months: 573 Household did not receive Food Stamps/SNAP in the past 12 months: 3,261
Women who had a birth in the past 12 months: 115 (51 now married, 61 unmarried) Women who did not have a birth in the past 12 months: 2,231 (1,144 now married, 1,086 unmarried)
Housing units in zip code 74434 with a mortgage: 1,864 (91 second mortgage, 16 home equity loan, 50 both second mortgage and home equity loan) Houses without a mortgage: 38
Median monthly owner costs for units with a mortgage: $1,245 Median monthly owner costs for units without a mortgage: $456
Residents with income below the poverty level in 2022:
This zip code:
12.4%
Whole state:
15.7%
Residents with income below 50% of the poverty level in 2022:
This zip code:
7.1%
Whole state:
8.3%
Median number of rooms in houses and condos:
Here:
6.1
State:
6.1
Median number of rooms in apartments:
Here:
4.3
State:
4.5
Notable locations in this zip code not listed on our city pages
Notable locations in zip code 74434: Berch Hole (A), Fort Gibson Fire Department (B), Norwood Fire Department Station 1 (C). Display/hide their locations on the map
Churches in zip code 74434 include: Fort Gibson Church of Christ (A), First United Methodist Church (B), First Baptist Church (C), Fourmile Branch Church (D). Display/hide their locations on the map
Cemeteries: Walker Cemetery (1), Anderson Cemetery (2), Fort Gibson Cemetery (3), Fort Gibson National Cemetery (4), Four Mile Cemetery (5), Jones Cemetery (6), New Hope Cemetery (7). Display/hide their locations on the map
Lakes and reservoirs: Ross Lake (A), Horseshoe Lake (B), Katy Lake (C), Shimoon Lake (D), Fort Gibson Lake (E), Little Deep Fork Creek Site 57b Reservoir (F). Display/hide their locations on the map
Streams, rivers, and creeks: Bondinot Creek (A), Hicks Branch (B), Walker Branch (C), Verdigris River (D), Correll Branch (E), Bayou Manard (F), Gulager Spring Branch (G), Neosho River (H), Mill Creek (I). Display/hide their locations on the map
Parks in zip code 74434 include: Wahoo Bay Public Use Area (1), Dam Site Public Use Area (2), Canyon Road Public Use Area (3), Fort Gibson Stockade (4), Mallard Bay Recreation Area (5). Display/hide their locations on the map
In group quarters: 56 (-1 institutionalized population)
Size of family households: 1,214 2-persons, 589 3-persons, 550 4-persons, 222 5-persons, 121 6-persons, 34 7-or-more-persons
Size of nonfamily households: 956 1-person, 140 2-persons
1,266 married couples with children.
658 single-parent households (198 men, 460 women).
97.7% of residents of 74434 zip code speak English at home.
0.6% of residents speak Spanish at home (100% very well).
1.0% of residents speak Asian or Pacific Island language at home (40% very well, 2% well, 57% not well).
0.6% of residents speak other language at home (100% very well).
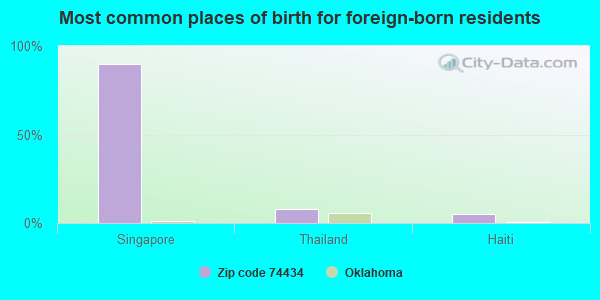
Foreign born population: 99 (1.0%) (100.0% of them are naturalized citizens)
This zip code:
1.0%
Whole state:
6.0%
90%Singapore
8%Thailand
5%Haiti
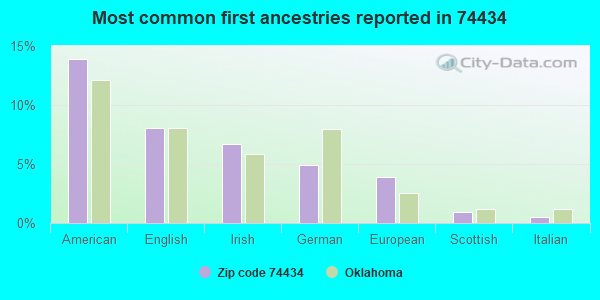
14%American
8%English
7%Irish
5%German
4%European
1%Scottish
0%Italian
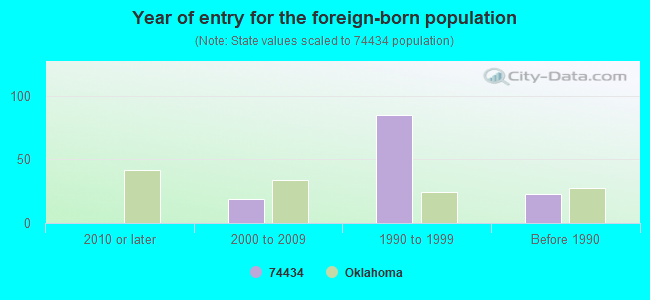
Year of entry for the foreign-born population
02010 or later
192000 to 2009
851990 to 1999
23Before 1990
Facilities with environmental interests located in this zip code:
FORT GIBSON EARLY LRNING CTR (500 S ROSS in FORT GIBSON, OK)
(National Center for Education Statistics) - STATE ID-51-I003-110 Organizations: FT GIBSON (SCHOOL DISTRICT)
FORT GIBSON HS (500 S ROSS in FORT GIBSON, OK)
(National Center for Education Statistics) - STATE ID-51-I003-705 Organizations: FT GIBSON (SCHOOL DISTRICT)
FORT GIBSON IES (500 S ROSS in FORT GIBSON, OK)
(National Center for Education Statistics) - STATE ID-51-I003-105 Organizations: FT GIBSON (SCHOOL DISTRICT)
FORT GIBSON MS (500 S ROSS in FORT GIBSON, OK)
(National Center for Education Statistics) - STATE ID-51-I003-505 Organizations: FT GIBSON (SCHOOL DISTRICT)
ARKHOLA DIV APAC AK/MUSKOGEE ASPHALT PLT (1MI E OF HWY 10 & 62 JUNCTION in FORT GIBSON, OK) . Tribal Land
AIR MINOR (AIRS/AFS) Business SIC classification: ASPHALT PAVING MIXTURES AND BLOCKS
FORT GIBSON UTILITIES AUTH (PO BOX 218 in FORT GIBSON, OK)
STATE MASTER (Oklahoma environmental compliance activities data) National Pollutant Discharge Elimination System MAJOR (Tracking pollutant discharge elimination systems) - permit Business SIC classification: SEWERAGE SYSTEMS Alternative names: FORT GIBSON UTILITIES AUTHORIT, FORT GIBSON WWTF
ARKHOLA SAND & GRAVEL (E OF JUNCT 62 & 10 ASPHALF PLT in FT GIBSON, OK)
Conditionally Exempt Small Quantity Generators, less than 100 kg/month of hazardous waste (Resource Conservation and Recovery Act (tracking hazardous waste)) - notification
FORT GIBSON POWERHOUSE (HIGHWAY 251-A in FORT GIBSON, OK) . Federal Facility. ARMY CORPS OF ENGINEERS
Conditionally Exempt Small Quantity Generators, less than 100 kg/month of hazardous waste (Resource Conservation and Recovery Act (tracking hazardous waste)) - notification Organizations: US ARMY CORPS OF ENGINEERS (CONTACT/OWNER)
FT. GIBSON PUBLIC SCHOOLS (500 SOUTH ROSS in FORT GIBSON, OK)
COMPLIANCE ACTIVITY (Tracking inspections of insecticide, fungicide, and rodenticide, and toxic substances) Business SIC classification: ELEMENTARY AND SECONDARY SCHOOLS
FORT GIBSON PUBLIC SCHOOLS (CORNER OF ROSS & SOUTH ST ON HWY 10 in FORT GIBSON, OK)
COMPLIANCE ACTIVITY (Tracking inspections of insecticide, fungicide, and rodenticide, and toxic substances)
Housing units lacking complete plumbing facilities: 2.5% Housing units lacking complete kitchen facilities: 1.9%
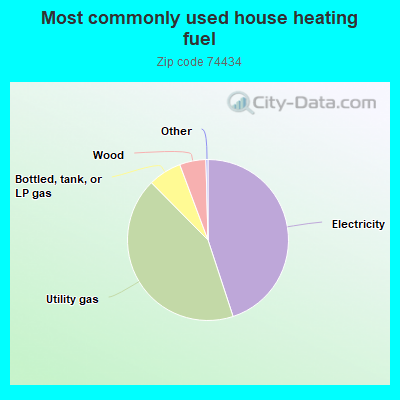
45.0%Electricity
42.7%Utility gas
6.7%Bottled, tank, or LP gas
5.3%Wood
Population in 1990: 5,233. Population change in the 1990s: +3,197 (+61.1%).
Place of birth for U.S.-born residents:
This state: 7,147
Northeast: 42
Midwest: 794
South: 732
West: 660
53% of the 74434 zip code residents lived in the same house 5 years ago. Out of people who lived in different houses, 50% lived in this county. Out of people who lived in different counties, 50% lived in Oklahoma.
91% of the 74434 zip code residents lived in the same house 1 year ago. Out of people who lived in different houses, 47% moved from this county. Out of people who lived in different houses, 49% moved from different county within same state. Out of people who lived in different houses, 3% moved from different state.
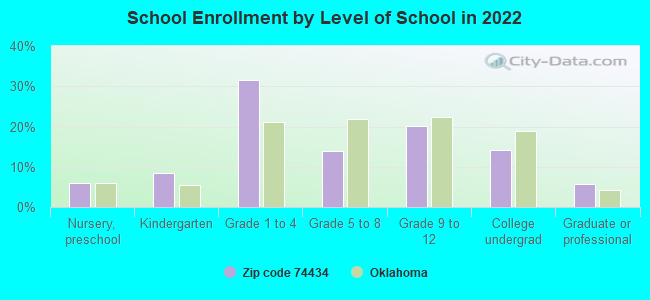
Private vs. public school enrollment:
Students in private schools in grades 1 to 8 (elementary and middle school): 66
Here:
6.6%
Oklahoma:
11.7%
Students in private schools in grades 9 to 12 (high school): 34
Here:
7.9%
Oklahoma:
11.7%
Students in private undergraduate colleges: 71
Here:
23.0%
Oklahoma:
19.3%
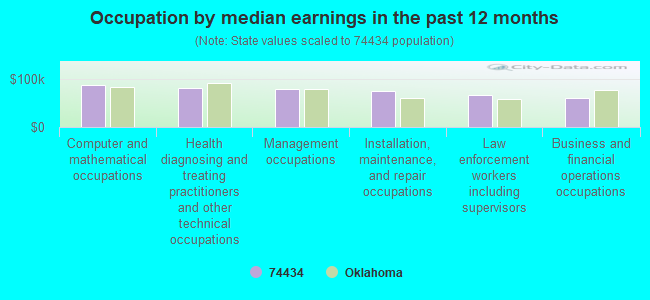
Occupation by median earnings in the past 12 months ($)
86,632Computer and mathematical occupations
81,594Health diagnosing and treating practitioners and other technical occupations
78,510Management occupations
75,005Installation, maintenance, and repair occupations
65,916Law enforcement workers including supervisors
59,761Business and financial operations occupations
Companies with federal contracts located in this zip code (FORT GIBSON, OK):
TIGER IND TRANSPORTATION SYSTE (236 S TWO MILE ROAD; small business) : $2,372,294 in 11 contractsfrom 2002 to 2005
Contracts for Construction of Structures and Facilities -- Other Conservation and Development Facilities, Construction of Structures and Facilities -- Highways, Roads, Streets, Bridges, and Railways (includes resurfacing) by U.S. Army Corps of Engineers - civil program financing only, Army Signed by year:2000: $0; 2001: $0; 2002: $1,297,379; 2003: $497,202; 2004: -$6,980; 2005: $584,693; 2006: $0.
Biggest contracts:
$936,000 with U.S. Army Corps of Engineers - civil program financing only for Construction of Structures and Facilities -- Other Conservation and Development Facilities. Signed on 2002-04-29. Completion date: 2002-09-30.
$497,202 with U.S. Army Corps of Engineers - civil program financing only for Construction of Structures and Facilities -- Highways, Roads, Streets, Bridges, and Railways (includes resurfacing). Signed on 2003-05-28. Completion date: 2003-05-22.
$363,000 with Army for Construction of Structures and Facilities -- Highways, Roads, Streets, Bridges, and Railways (includes resurfacing). Signed on 2005-06-17. Completion date: 2005-08-01.
$305,880 with U.S. Army Corps of Engineers - civil program financing only for Construction of Structures and Facilities -- Other Conservation and Development Facilities. Signed on 2002-07-19. Completion date: 2002-09-30.
HERITAGE PARK HOME OWNERS, INC (1603 S LEE ST; small business) : $489,763 in 52 contractsfrom 2002 to 2006
Contracts for Food, Oils and Fats, Special Dietary Foods and Food Specialty Preparations by Army Signed by year:2000: $0; 2001: $0; 2002: $83,670; 2003: $94,141; 2004: $59,297; 2005: $159,917; 2006: $92,738.
Biggest contracts:
$58,200 with Army for Food, Oils and Fats. Signed on 2005-03-17. Completion date: 2005-03-30.
$46,485, same as above.Signed on 2006-03-24. Completion date: 2006-04-22.
$28,175, same as above.Signed on 2002-10-17. Completion date: 2002-10-12.
$24,087, same as above.Signed on 2005-09-22. Completion date: 2005-09-28.
SHELLY R DOWNS (6188 N 38TH ST EAST; small business) : $33,600 in 6 contractsfrom 2003 to 2005
Contracts for Custodial Janitorial Services by U.S. Army Corps of Engineers - civil program financing only, Army Signed by year:2000: $0; 2001: $0; 2002: $0; 2003: $12,000; 2004: $14,400; 2005: $7,200; 2006: $0.
Biggest contracts:
$7,200 with U.S. Army Corps of Engineers - civil program financing only for Custodial Janitorial Services. Signed on 2004-10-27. Completion date: 2004-12-31.
$7,200 with Army for Custodial Janitorial Services. Signed on 2004-10-27. Completion date: 2004-12-31.
$6,600, same as above.Signed on 2005-12-12. Completion date: 2004-12-31.
$6,000, same as above.Signed on 2003-12-22. Completion date: 2004-12-31.
HENRY I WHITE (23856 N 7 MILE ROAD; small business) : $25,250 in 5 contractsfrom 2004 to 2006
Contracts for Other Administrative Support Services by Army, U.S. Army Corps of Engineers - civil program financing only Signed by year:2000: $0; 2001: $0; 2002: $0; 2003: $0; 2004: $10,100; 2005: $10,100; 2006: $5,050.
Biggest contracts:
$5,050 with Army for Other Administrative Support Services. Signed on 2006-03-01. Completion date: 2004-03-05.
$5,050 with U.S. Army Corps of Engineers - civil program financing only for Other Administrative Support Services. Signed on 2005-02-24. Completion date: 2004-03-05.
$5,050 with Army for Other Administrative Support Services. Signed on 2005-02-24. Completion date: 2004-03-05.
$5,050, same as above.Signed on 2004-03-11. Completion date: 2004-03-05.
KIZZIA, CLARA (20724 RANGER RD; small business) : $23,000 in 5 contractsfrom 2004 to 2006
Contracts for Other Administrative Support Services by Army, U.S. Army Corps of Engineers - civil program financing only Signed by year:2000: $0; 2001: $0; 2002: $0; 2003: $0; 2004: $9,200; 2005: $9,200; 2006: $4,600.
Biggest contracts:
$4,600 with Army for Other Administrative Support Services. Signed on 2006-01-25. Completion date: 2004-03-12.
$4,600 with U.S. Army Corps of Engineers - civil program financing only for Other Administrative Support Services. Signed on 2005-02-14. Completion date: 2004-03-12.
$4,600 with Army for Other Administrative Support Services. Signed on 2005-02-14. Completion date: 2004-03-12.
$4,600, same as above.Signed on 2004-03-19. Completion date: 2004-03-12.
COOK CONSTRUCTION & CRANE, INC (1738 EASTHIGHWAY 62; small business) : $9,500 in 2 contractsin 2004
$4,750 with U.S. Army Corps of Engineers - civil program financing only for Construction of Structures and Facilities -- Miscellaneous Buildings. Signed on 2004-04-19. Completion date: 2004-03-10.
$4,750 with Army for Construction of Structures and Facilities -- Miscellaneous Buildings. Signed on 2004-04-19. Completion date: 2004-03-10.
RHINE, ELSIE (155 N 3 MILE RD; small business)
$7,200 with Army for Operation of Government-Owned Facilities -- Recreation Facilities (Non-Building). Signed on 2006-04-10. Completion date: 2006-03-17.
DIEBOLD'S TREE SERVICE (21239 HWY 80; small business)
$3,500 with Army for Landscaping/Groundskeeping Services. Signed on 2004-06-01. Completion date: 2004-06-26.
Top industries in this zip code by the number of employees in 2005:
Utilities: Fossil Fuel Electric Power Generation (100-249 employees: 1 establishment, 1-4 employees: 1 establishment)


 Nearest zip codes: 74446, 74423, 74403, 74441, 74477, 74467.