Estimated zip code population in 2022: 45,907 Zip code population in 2010: 38,666 Zip code population in 2000: 35,737
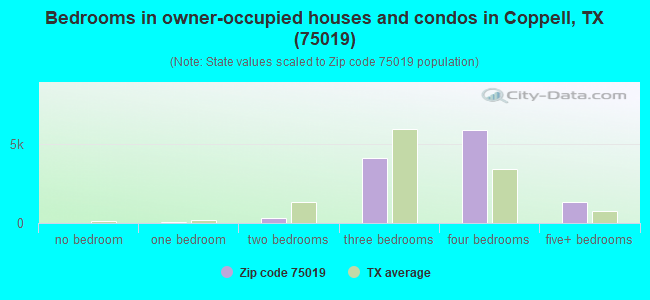
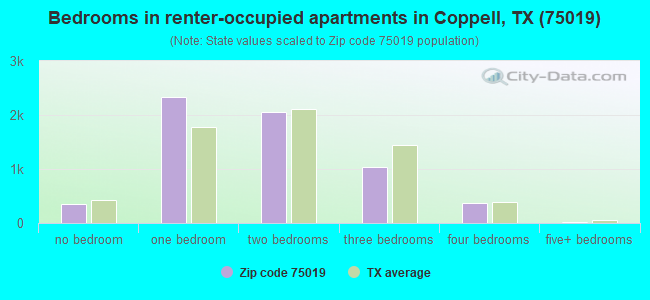
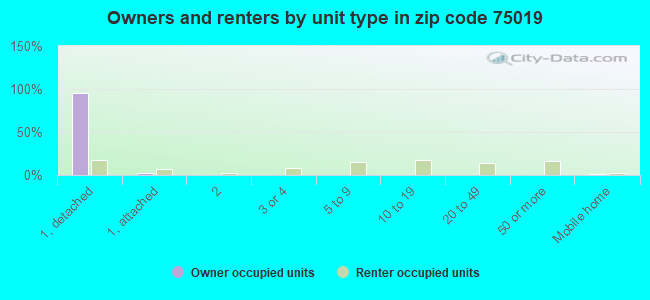
Houses and condos: 18,043 Renter-occupied apartments: 6,186
% of renters here:
35%
State:
38%
March 2022 cost of living index in zip code 75019: 96.3 (near average, U.S. average is 100)
Land area: 16.5 sq. mi. Water area: 1.8 sq. mi.
Population density: 2,787 people per square mile
(average).
OSM Map
General Map
Google Map
MSN Map
OSM Map
General Map
Google Map
MSN Map
OSM Map
General Map
Google Map
MSN Map
OSM Map
General Map
Google Map
MSN Map
Please wait while loading the map...
Real estate property taxes paid for housing units in 2022:
This zip code:
1.8% ($10,460)
Texas:
1.5% ($4,050)
Median real estate property taxes paid for housing units with mortgages in 2022: $10,505 (1.8%) Median real estate property taxes paid for housing units with no mortgage in 2022: $9,882 (1.8%)
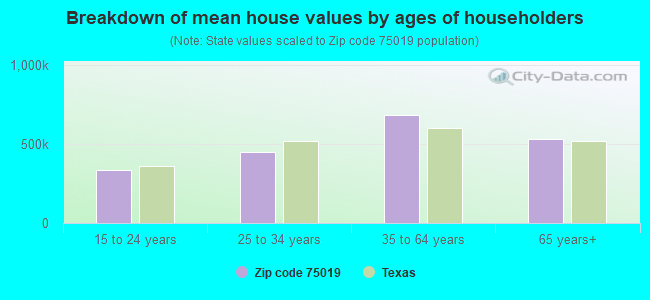
Estimated median house/condo value in 2022: $565,727
75019:
$565,727
Texas:
$275,400
According to our research of Texas and other state lists, there were 11 registered sex offenders living in 75019 zip code as of April 27, 2024. The ratio of all residents to sex offenders in zip code 75019 is 3,768 to 1. The ratio of registered sex offenders to all residents in this zip code is much lower than the state average.
Median resident age:
This zip code:
39.3 years
Texas median age:
35.6 years
Average household size:
This zip code:
2.6 people
Texas:
2.6 people
Averages for the 2020 tax year for zip code 75019, filed in 2021:
Average Adjusted Gross Income (AGI) in 2020: $154,144 (Individual Income Tax Returns)
Here:
$154,144
State:
$77,054
Salary/wage: $124,333 (reported on 87.1% of returns)
Here:
$124,333
State:
$62,766
(% of AGI for various income ranges: 1191.9% for AGIs below $25k, 3836.2% for AGIs $25k-50k, 6653.6% for AGIs $50k-75k, 10068.3% for AGIs $75k-100k, 20359.4% for AGIs $100k-200k, 87885.8% for AGIs over 200k)
Taxable interest for individuals: $3,235 (reported on 41.3% of returns)
This zip code:
$3,235
Texas:
$2,665
(% of AGI for various income ranges: 20.3% for AGIs below $25k, 22.0% for AGIs $25k-50k, 47.8% for AGIs $50k-75k, 85.7% for AGIs $75k-100k, 154.7% for AGIs $100k-200k, 1370.7% for AGIs over 200k)
Ordinary dividends: $12,890 (reported on 36.5% of returns)
Here:
$12,890
State:
$10,044
(% of AGI for various income ranges: 40.5% for AGIs below $25k, 66.7% for AGIs $25k-50k, 136.7% for AGIs $50k-75k, 222.7% for AGIs $75k-100k, 382.4% for AGIs $100k-200k, 5335.1% for AGIs over 200k)
Net capital gain/loss in AGI: +$46,755 (reported on 35.5% of returns)
Here:
+$46,755
State:
+$39,590
(% of AGI for various income ranges: 24.5% for AGIs below $25k, 60.9% for AGIs $25k-50k, 140.6% for AGIs $50k-75k, 155.4% for AGIs $75k-100k, 631.5% for AGIs $100k-200k, 21629.1% for AGIs over 200k)
Profit/loss from business: +$15,239 (reported on 19.9% of returns)
Here:
+$15,239
State:
+$10,888
(% of AGI for various income ranges: 94.3% for AGIs below $25k, 136.0% for AGIs $25k-50k, 228.1% for AGIs $50k-75k, 281.4% for AGIs $75k-100k, 682.6% for AGIs $100k-200k, 2027.0% for AGIs over 200k)
Taxable individual retirement arrangement distribution: $31,097 (reported on 8.3% of returns)
75019:
$31,097
Texas:
$24,740
(% of AGI for various income ranges: 65.8% for AGIs below $25k, 103.9% for AGIs $25k-50k, 237.7% for AGIs $50k-75k, 360.5% for AGIs $75k-100k, 619.8% for AGIs $100k-200k, 1554.3% for AGIs over 200k)
Self-employed (Keogh) retirement plans: $29,167 (reported on 1.4% of returns)
75019:
$29,167
Texas:
$29,298
(% of AGI for various income ranges: 11.9% for AGIs $50k-75k, 44.9% for AGIs $100k-200k, 475.5% for AGIs over 200k)
Total itemized deductions: $40,595 (reported on 16.3% of returns)
Here:
$40,595
State:
$40,428
(% of AGI for various income ranges: 63.1% for AGIs below $25k, 180.1% for AGIs $25k-50k, 387.0% for AGIs $50k-75k, 553.9% for AGIs $75k-100k, 1103.4% for AGIs $100k-200k, 5844.3% for AGIs over 200k)
Charity contributions: $17,457 (reported on 14.2% of returns)
Here:
$17,457
State:
$18,201
(% of AGI for various income ranges: 4.3% for AGIs below $25k, 29.4% for AGIs $25k-50k, 77.6% for AGIs $50k-75k, 102.1% for AGIs $75k-100k, 297.6% for AGIs $100k-200k, 2684.7% for AGIs over 200k)
Taxes paid: $9,022 (reported on 16.2% of returns)
75019:
$9,022
State:
$7,821
(% of AGI for various income ranges: 14.6% for AGIs below $25k, 40.5% for AGIs $25k-50k, 97.4% for AGIs $50k-75k, 153.6% for AGIs $75k-100k, 310.2% for AGIs $100k-200k, 1114.9% for AGIs over 200k)
Earned income credit: $1,957 (reported on 6.5% of returns)
Here:
$1,957
State:
$2,584
(% of AGI for various income ranges: 49.8% for AGIs below $25k, 49.0% for AGIs $25k-50k, 0.7% for AGIs $50k-75k)
Percentage of individuals using paid preparers for their 2020 taxes: 92.3%
Here:
92%
State:
92%
(% for various income ranges: 90.6% for AGIs below $25k, 93.1% for AGIs $25k-50k, 92.4% for AGIs $50k-75k, 91.1% for AGIs $75k-100k, 92.7% for AGIs $100k-200k, 93.3% for AGIs over 200k)
Averages for the 2012 tax year for zip code 75019, filed in 2013:
Average Adjusted Gross Income (AGI) in 2012: $130,003 (Individual Income Tax Returns)
Here:
$130,003
State:
$65,384
Salary/wage: $110,468 (reported on 89.3% of returns)
Here:
$110,468
State:
$52,524
(% of AGI for various income ranges: 83.2% for AGIs below $25k, 84.8% for AGIs $25k-50k, 81.8% for AGIs $50k-75k, 84.2% for AGIs $75k-100k, 85.8% for AGIs $100k-200k, 68.8% for AGIs over 200k)
Taxable interest for individuals: $1,672 (reported on 45.5% of returns)
This zip code:
$1,672
Texas:
$2,372
(% of AGI for various income ranges: 1.3% for AGIs below $25k, 0.7% for AGIs $25k-50k, 0.6% for AGIs $50k-75k, 0.5% for AGIs $75k-100k, 0.5% for AGIs $100k-200k, 0.6% for AGIs over 200k)
Ordinary dividends: $8,211 (reported on 34.6% of returns)
Here:
$8,211
State:
$9,721
(% of AGI for various income ranges: 3.1% for AGIs below $25k, 1.5% for AGIs $25k-50k, 1.7% for AGIs $50k-75k, 1.3% for AGIs $75k-100k, 1.2% for AGIs $100k-200k, 2.8% for AGIs over 200k)
Net capital gain/loss in AGI: +$20,076 (reported on 30.5% of returns)
Here:
+$20,076
State:
+$35,319
(% of AGI for various income ranges: 0.4% for AGIs below $25k, 0.5% for AGIs $25k-50k, 0.6% for AGIs $50k-75k, 0.4% for AGIs $75k-100k, 1.0% for AGIs $100k-200k, 7.8% for AGIs over 200k)
Profit/loss from business: +$20,431 (reported on 19.7% of returns)
Here:
+$20,431
State:
+$13,732
(% of AGI for various income ranges: 7.4% for AGIs below $25k, 4.3% for AGIs $25k-50k, 3.7% for AGIs $50k-75k, 4.0% for AGIs $75k-100k, 3.3% for AGIs $100k-200k, 2.6% for AGIs over 200k)
Taxable individual retirement arrangement distribution: $25,374 (reported on 9.3% of returns)
75019:
$25,374
Texas:
$19,511
(% of AGI for various income ranges: 2.6% for AGIs below $25k, 2.2% for AGIs $25k-50k, 2.5% for AGIs $50k-75k, 2.5% for AGIs $75k-100k, 2.2% for AGIs $100k-200k, 1.4% for AGIs over 200k)
Self-employment retirement plans: $22,581 (reported on 1.7% of returns)
75019:
$22,581
Texas:
$23,938
(% of AGI for various income ranges: 0.3% for AGIs $50k-75k, 0.2% for AGIs $100k-200k, 0.4% for AGIs over 200k)
Total itemized deductions: $34,519 (16% of AGI, reported on 48.5% of returns)
Here:
$34,519
State:
$24,724
Here:
15.9% of AGI
State:
15.9% of AGI
(% of AGI for various income ranges: 12.7% for AGIs below $25k, 11.3% for AGIs $25k-50k, 14.1% for AGIs $50k-75k, 13.6% for AGIs $75k-100k, 13.5% for AGIs $100k-200k, 12.5% for AGIs over 200k)
Charity contributions: $8,313 (reported on 42.3% of returns)
Here:
$8,313
State:
$6,808
(% of AGI for various income ranges: 0.9% for AGIs below $25k, 1.3% for AGIs $25k-50k, 1.9% for AGIs $50k-75k, 2.2% for AGIs $75k-100k, 2.4% for AGIs $100k-200k, 3.2% for AGIs over 200k)
Taxes paid: $10,263 (reported on 48.0% of returns)
75019:
$10,263
State:
$6,921
(% of AGI for various income ranges: 3.2% for AGIs below $25k, 3.4% for AGIs $25k-50k, 4.4% for AGIs $50k-75k, 4.8% for AGIs $75k-100k, 5.2% for AGIs $100k-200k, 3.0% for AGIs over 200k)
Earned income credit: $2,007 (reported on 6.9% of returns)
Here:
$2,007
State:
$2,570
(% of AGI for various income ranges: 4.0% for AGIs below $25k, 0.7% for AGIs $25k-50k)
Percentage of individuals using paid preparers for their 2012 taxes: 45.3%
Here:
45%
State:
51%
(% for various income ranges: 39.2% for AGIs below $25k, 41.7% for AGIs $25k-50k, 44.5% for AGIs $50k-75k, 42.4% for AGIs $75k-100k, 45.8% for AGIs $100k-200k, 61.1% for AGIs over 200k)
Averages for the 2004 tax year for zip code 75019, filed in 2005:
Average Adjusted Gross Income (AGI) in 2004: $96,317 (Individual Income Tax Returns)
Here:
$96,317
State:
$47,881
Salary/wage: $89,908 (reported on 89.1% of returns)
Here:
$89,908
State:
$41,947
(% of AGI for various income ranges: 82.0% for AGIs $10k-25k, 86.3% for AGIs $25k-50k, 87.2% for AGIs $50k-75k, 88.2% for AGIs $75k-100k, 80.7% for AGIs over 100k)
Taxable interest for individuals: $1,646 (reported on 56.6% of returns)
This zip code:
$1,646
Texas:
$2,255
(% of AGI for various income ranges: 2.1% for AGIs $10k-25k, 1.1% for AGIs $25k-50k, 0.9% for AGIs $50k-75k, 0.6% for AGIs $75k-100k, 0.9% for AGIs over 100k)
Taxable dividends: $3,778 (reported on 40.8% of returns)
Here:
$3,778
State:
$4,261
(% of AGI for various income ranges: 1.7% for AGIs $10k-25k, 0.9% for AGIs $25k-50k, 1.2% for AGIs $50k-75k, 0.9% for AGIs $75k-100k, 1.7% for AGIs over 100k)
Net capital gain/loss: +$9,085 (reported on 36.3% of returns)
Here:
+$9,085
State:
+$16,110
(% of AGI for various income ranges: 0.4% for AGIs $10k-25k, 0.3% for AGIs $25k-50k, 1.0% for AGIs $50k-75k, 0.8% for AGIs $75k-100k, 4.3% for AGIs over 100k)
Profit/loss from business: +$18,645 (reported on 20.2% of returns)
Here:
+$18,645
State:
+$11,013
(% of AGI for various income ranges: 9.1% for AGIs $10k-25k, 6.0% for AGIs $25k-50k, 4.0% for AGIs $50k-75k, 4.0% for AGIs $75k-100k, 3.6% for AGIs over 100k)
IRA payment deduction: $3,322 (reported on 3.3% of returns)
75019:
$3,322
Texas:
$3,120
(% of AGI for various income ranges: 0.2% for AGIs $10k-25k, 0.2% for AGIs $25k-50k, 0.2% for AGIs $50k-75k, 0.2% for AGIs $75k-100k, 0.1% for AGIs over 100k)
Self-employed pension: $16,681 (reported on 2.3% of returns)
Here:
$16,681
Texas:
$16,401
(% of AGI for various income ranges: 0.1% for AGIs $25k-50k, 0.2% for AGIs $50k-75k, 0.2% for AGIs $75k-100k, 0.5% for AGIs over 100k)
Total itemized deductions: $24,133 (17% of AGI, reported on 54.5% of returns)
Here:
$24,133
State:
$19,631
Here:
16.7% of AGI
State:
18.9% of AGI
(% of AGI for various income ranges: 16.2% for AGIs $10k-25k, 15.3% for AGIs $25k-50k, 18.0% for AGIs $50k-75k, 17.7% for AGIs $75k-100k, 12.3% for AGIs over 100k)
Charity contributions deductions: $5,139 (3% of AGI, reported on 48.9% of returns)
Here:
$5,139
State:
$4,753
Here:
3.4% of AGI
State:
4.2% of AGI
(% of AGI for various income ranges: 1.5% for AGIs $10k-25k, 1.8% for AGIs $25k-50k, 2.3% for AGIs $50k-75k, 2.7% for AGIs $75k-100k, 2.7% for AGIs over 100k)
Total tax: $20,132 (reported on 83.0% of returns)
75019:
$20,132
State:
$9,058
(% of AGI for various income ranges: 4.9% for AGIs $10k-25k, 7.8% for AGIs $25k-50k, 9.7% for AGIs $50k-75k, 10.9% for AGIs $75k-100k, 20.0% for AGIs over 100k)
Earned income credit: $1,710 (reported on 5.8% of returns)
Here:
$1,710
State:
$2,024
Percentage of individuals using paid preparers for their 2004 taxes: 47.1%
Here:
47%
State:
57%
(% for various income ranges: 41.1% for AGIs below $10k, 50.4% for AGIs $10k-25k, 46.3% for AGIs $25k-50k, 44.4% for AGIs $50k-75k, 42.6% for AGIs $75k-100k, 52.1% for AGIs over 100k)
Likely homosexual households (counted as self-reported same-sex unmarried-partner households)
Lesbian couples: 0.2% of all households
Gay men: 0.1% of all households
Household received Food Stamps/SNAP in the past 12 months: 136 Household did not receive Food Stamps/SNAP in the past 12 months: 17,652
Women who had a birth in the past 12 months: 620 (632 now married, 0 unmarried) Women who did not have a birth in the past 12 months: 11,035 (6,078 now married, 4,918 unmarried)
Housing units in zip code 75019 with a mortgage: 7,678 (423 second mortgage, 9 home equity loan, 256 both second mortgage and home equity loan) Houses without a mortgage: 149
Median monthly owner costs for units with a mortgage: $3,172 Median monthly owner costs for units without a mortgage: $1,337
Residents with income below the poverty level in 2022:
This zip code:
2.8%
Whole state:
14.0%
Residents with income below 50% of the poverty level in 2022:
This zip code:
1.6%
Whole state:
7.4%
Median number of rooms in houses and condos:
Here:
7.8
State:
6.3
Median number of rooms in apartments:
Here:
3.6
State:
4.0
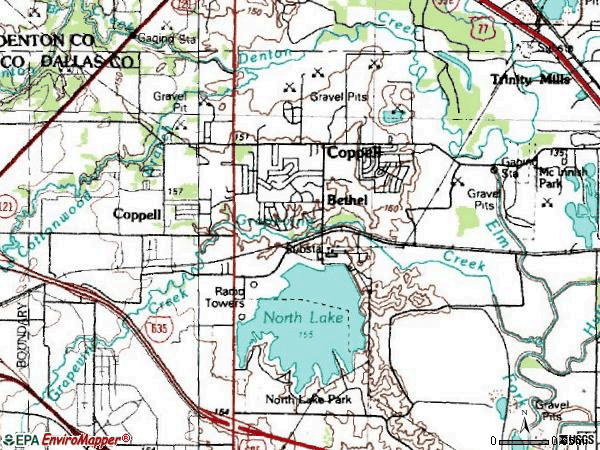
Notable locations in this zip code not listed on our city pages
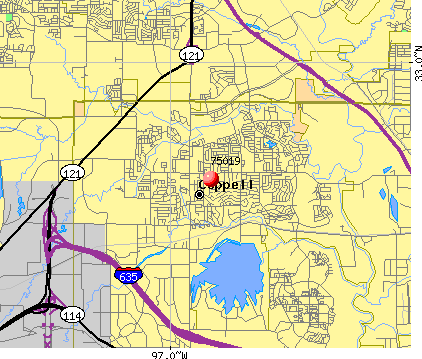
Notable locations in zip code 75019: Coppell Fire Department Station 1 (A), Coppell Fire Department Station 3 (B), Coppell Fire Department Station 2 (C). Display/hide their locations on the map
Churches in zip code 75019 include: Metrocrest Community Church (A), Sandy Lake Road Baptist Church (B), Riverside Church of Christ (C), First United Methodist Church of Coppell (D). Display/hide their locations on the map
In group quarters: 48 (-1 institutionalized population)
Size of family households: 5,213 2-persons, 3,424 3-persons, 3,517 4-persons, 832 5-persons, 315 6-persons, 17 7-or-more-persons
Size of nonfamily households: 4,018 1-person, 468 2-persons, 15 4-persons
9,826 married couples with children.
2,053 single-parent households (564 men, 1,489 women).
60.4% of residents of 75019 zip code speak English at home.
10.7% of residents speak Spanish at home (79% very well, 10% well, 10% not well, 1% not at all).
11.7% of residents speak other Indo-European language at home (86% very well, 9% well, 3% not well, 2% not at all).
17.2% of residents speak Asian or Pacific Island language at home (82% very well, 12% well, 5% not well, 1% not at all).
1.3% of residents speak other language at home (100% very well).
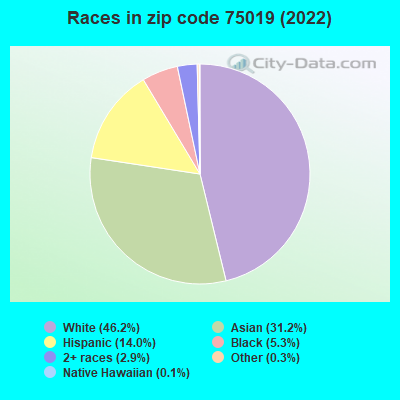
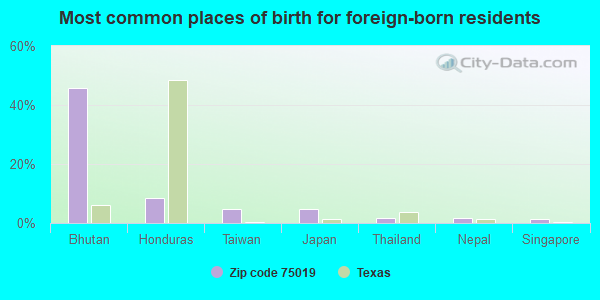
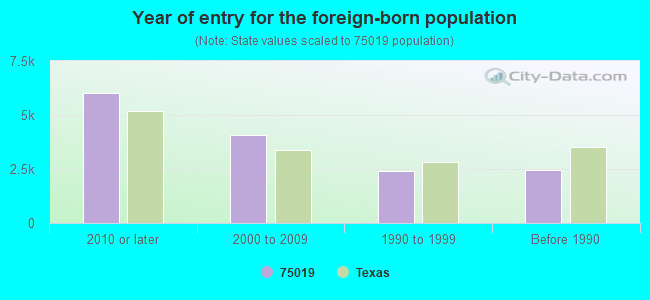
Foreign born population: 13,863 (30.2%) (46.7% of them are naturalized citizens)
This zip code:
30.2%
Whole state:
17.2%
46%Bhutan
9%Honduras
5%Taiwan
5%Japan
2%Thailand
2%Nepal
2%Singapore
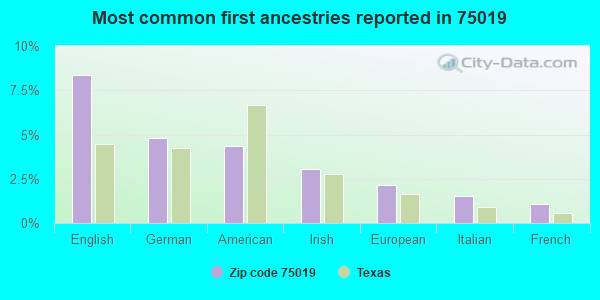
8%English
5%German
4%American
3%Irish
2%European
2%Italian
1%French
Year of entry for the foreign-born population
6,0012010 or later
4,0682000 to 2009
2,4111990 to 1999
2,437Before 1990
Facilities with environmental interests located in this zip code:
AUSTIN EL (161 S MOORE in COPPELL, TX)
(National Center for Education Statistics) - STATE ID-057922103 Organizations: COPPELL ISD (SCHOOL DISTRICT)
AHMED YANOUVI DBA CUSTOM CLEANERS (820 S MACARTHUR STE 104 in COPPELL, TX)
ANDYS COPPELL CLEANERS (120 S DENTON TAP RD STE 470 C in COPPELL, TX)
(Resource Conservation and Recovery Act (tracking hazardous waste)) Alternative names: COPPELL CLNRS
AS CLEANERS (700 E SANDY LAKE RD in COPPELL, TX)
(Resource Conservation and Recovery Act (tracking hazardous waste)) Alternative names: AS CLNRS
901 NORTH LAKE STEAM ELECTRIC STATION (14901 NORTH LAKE RD in COPPELL, TX)
HAZARDOUS WASTE BIENNIAL REPORTER (Resource Conservation and Recovery Act (tracking hazardous waste)) Large Quantity Generators, more that 1000 kg of hazardous waste/month (Resource Conservation and Recovery Act (tracking hazardous waste)) Business NAICS classification: SUPPORT ACTIVITIES FOR OIL AND GAS OPERATIONS.
Housing units lacking complete plumbing facilities: 0.2% Housing units lacking complete kitchen facilities: 0.5%
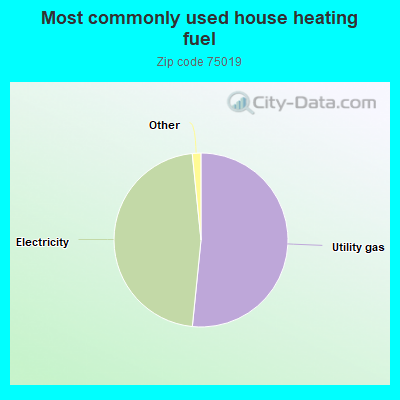
51.6%Utility gas
46.8%Electricity
0.7%Bottled, tank, or LP gas
0.7%No fuel used
Population in 1990: 16,862. Population change in the 1990s: +18,875 (+111.9%).
Place of birth for U.S.-born residents:
This state: 17,256
Northeast: 2,364
Midwest: 4,514
South: 4,146
West: 3,214
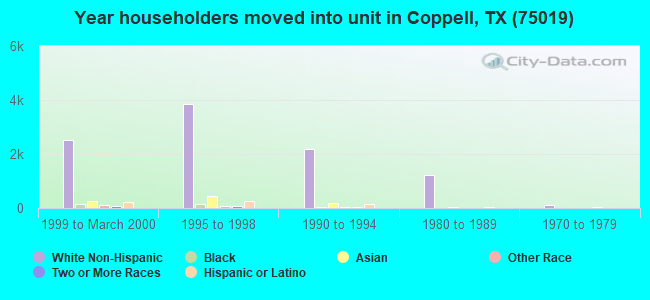
41% of the 75019 zip code residents lived in the same house 5 years ago. Out of people who lived in different houses, 52% lived in this county. Out of people who lived in different counties, 50% lived in Texas.
87% of the 75019 zip code residents lived in the same house 1 year ago. Out of people who lived in different houses, 49% moved from this county. Out of people who lived in different houses, 25% moved from different county within same state. Out of people who lived in different houses, 17% moved from different state. Out of people who lived in different houses, 10% moved from abroad.
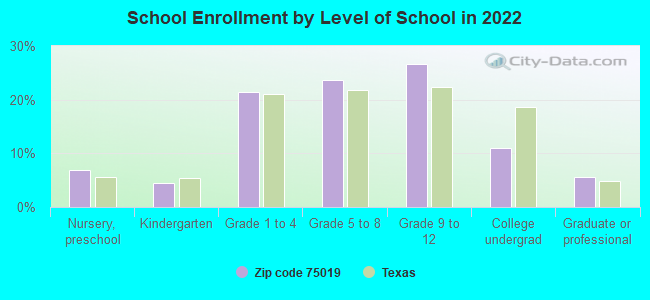
Private vs. public school enrollment:
Students in private schools in grades 1 to 8 (elementary and middle school): 378
Here:
6.6%
Texas:
8.8%
Students in private schools in grades 9 to 12 (high school): 88
Here:
2.6%
Texas:
8.0%
Students in private undergraduate colleges: 321
Here:
22.9%
Texas:
16.2%
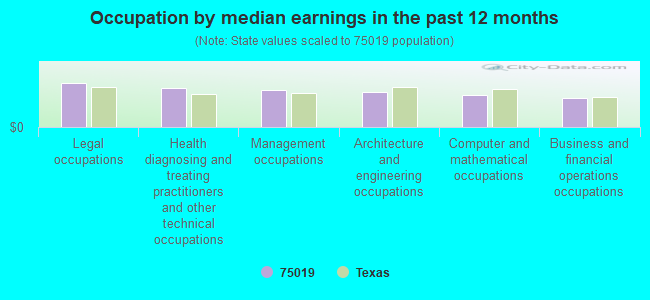
Occupation by median earnings in the past 12 months ($)
157,839Legal occupations
140,849Health diagnosing and treating practitioners and other technical occupations
131,299Management occupations
126,296Architecture and engineering occupations
116,486Computer and mathematical occupations
104,296Business and financial operations occupations
Companies with biggest federal contracts located in this zip code (COPPELL, TX):
NESTLE WATERS NORTH AMERICA IN (1322 CRESTSIDE DRIVE SUITE) : $4,068,362 in 15 contractsfrom 1999 to 2005
Contracts for Food Items For Resale, Beverages, Nonalcoholic by Department of Defense, Defense Commissary Agency, Army Signed by year:2000: $0; 2001: $425,468; 2002: $2,489,500; 2003: $902,365; 2004: $65,929; 2005: $3,750; 2006: $0.
Biggest contracts:
$1,477,291 with Department of Defense for Food Items For Resale. Signed on 2002-10-01. Completion date: 2003-05-31.
$478,813, same as above.Signed on 2002-01-01. Completion date: 2002-08-31.
$445,154, same as above.Signed on 2003-06-01. Completion date: 2003-08-31.
$423,324, same as above.Signed on 2002-04-01. Completion date: 2002-06-30.
ADVANCED GLOBAL SERVICES (281 ALEX DRIVE; small business) : $2,847,943 in 15 contractsfrom 2004 to 2006
Contracts for Defense Aircraft -- Basic Research (R&D), Defense Electronics and Communication Equipment -- Basic Research (R&D) by Air Force Signed by year:2000: $0; 2001: $0; 2002: $0; 2003: $0; 2004: $299,722; 2005: $1,324,838; 2006: $1,223,383.
Biggest contracts:
$375,000 with Air Force for Defense Aircraft -- Basic Research (R&D). Signed on 2005-06-01. Completion date: 2007-05-31.
$375,000, same as above.Signed on 2005-06-01. Completion date: 2007-06-01.
$375,000, same as above.Signed on 2005-06-01. Completion date: 2007-05-31.
$304,944 with Air Force for Defense Electronics and Communication Equipment -- Basic Research (R&D). Taking place in UT. Signed on 2006-06-19. Completion date: 2007-10-09.
APPLIED TECHNOLOGICAL SERVICES (255 S DENTON TAP ROAD; small business) : $384,631 in 4 contractsfrom 2003 to 2006
$193,441 with Army for Other Environmental Services, Studies, and Analytical Support. Taking place in HI. Signed on 2003-08-02. Completion date: 2004-09-30.
$92,895 with Army for Other ADP and Telecommunications Services (includes data storage on tapes, compact disks, etc.). Taking place in HI. Signed on 2006-05-12. Completion date: 2006-05-31.
$89,900, same as above.Signed on 2005-05-24. Completion date: 2006-05-31.
$8,395 with Army for Other Environmental Services, Studies, and Analytical Support. Taking place in HI. Signed on 2004-04-30. Completion date: 2004-05-21.
ULINE, INC (DEL) (635 FREEPORT PKWY; small business) : $102,666 in 20 contractsfrom 2003 to 2006
Contracts for Miscellaneous Materials Handling Equipment, Packaging and Packing Bulk Materials, Miscellaneous Vehicular Components, Boxes, Cartons, and Crates, and moreby Army, Federal Emergency Management Agency, Defense Logistics Agency, Department of Veterans Affairs, and others Signed by year:2000: $0; 2001: $0; 2002: $0; 2003: $35,120; 2004: $26,812; 2005: $21,706; 2006: $19,028.
Biggest contracts:
$17,440 with Army for Miscellaneous Materials Handling Equipment. Taking place in LA. Signed on 2006-06-15. Completion date: 2006-07-17.
$16,400 with Army for Packaging and Packing Bulk Materials. Signed on 2003-09-23. Completion date: 2003-10-15.
$15,595 with Army for Miscellaneous Vehicular Components. Signed on 2004-01-21. Completion date: 2004-01-30.
$7,089 with Army for Boxes, Cartons, and Crates. Signed on 2003-08-08. Completion date: 2003-07-01.
CELURO INC (114 WHISPERING HILLS DR; small business) : $98,000 in 2 contractsfrom 2005 to 2006
$65,000 with Navy for Other ADP and Telecommunications Services (includes data storage on tapes, compact disks, etc.). Signed on 2005-08-30. Completion date: 2005-12-17.
$33,000, same as above.Signed on 2006-02-28. Completion date: 2006-07-31.
SHARED TECHNOLOGIES INC (1405 S BELTLINE RD; small business) : $63,435 in 4 contractsfrom 2005 to 2006
$40,552 with Navy for ADP Software. Signed on 2006-06-23. Completion date: 2006-06-27.
$20,238 with National Park Service for Other ADP and Telecommunications Services (includes data storage on tapes, compact disks, etc.). Taking place in AZ. Signed on 2005-11-03. Completion date: 2006-09-30.
$1,645, same as above.Signed on 2005-11-03. Completion date: 2006-09-30.
$1,000 with Food Safety and Inspection Service for ADP Telecommunications and Transmission Services. Taking place in DC. Signed on 2005-11-17. Completion date: 2005-11-30.
PRINTERS CONNECTIONS INC (267 PARK VALLEY DR; small business) : $46,557 in 6 contractsfrom 2003 to 2005
Contracts for ADP Input/Output and Storage Devices, ADP Components, Miscellaneous Furniture and Fixtures, ADP Support Equipment by Army Signed by year:2000: $0; 2001: $0; 2002: $0; 2003: $11,591; 2004: $7,831; 2005: $27,135; 2006: $0.
Biggest contracts:
$15,792 with Army for ADP Input/Output and Storage Devices. Signed on 2005-12-15. Completion date: 2006-01-06.
$7,831, same as above.Signed on 2004-09-22. Completion date: 2004-10-13.
$7,348 with Army for ADP Components. Signed on 2005-01-04. Completion date: 2005-01-28.
$5,912 with Army for Miscellaneous Furniture and Fixtures. Signed on 2003-06-20. Completion date: 2003-06-27.
CONTAINER STORE INC, THE (500 FREEPORT PKWY) : $29,173 in 4 contractsfrom 2004 to 2006
$16,123 with Army for Cabinets, Lockers, Bins, and Shelving. Signed on 2005-12-23. Completion date: 2006-01-04.
$5,768 with Army for Luggage. Signed on 2006-06-05. Completion date: 2006-06-24.
$4,583 with Army for Boxes, Cartons, and Crates. Signed on 2004-10-25. Completion date: 2004-11-03.
$2,699, same as above.Signed on 2004-10-27. Completion date: 2004-11-09.
BRINK'S INCORPORATED (555 DIVIDEND DR)
$14,600 with Department of Defense for Guard Services. Taking place in CA. Signed on 2006-03-06. Completion date: 2007-02-28.
RACOR SYSTEMS DISTRIBUTION CO (203 MOCKINGBIRD LANE; small business)
$9,414 with Air Force for Office Furniture. Signed on 2005-04-21. Completion date: 2005-05-12.
Top industries in this zip code by the number of employees in 2005:
2002 - 2018 National Fire Incident Reporting System (NFIRS) incidents
Based on the data from the years 2002 - 2018 the average number of fire incidents per year is 82. The highest number of fires - 130 took place in 2006, and the least - 56 in 2003. The data has an increasing trend.
When looking into fire subcategories, the most reports belonged to: Outside Fires (46.8%), and Structure Fires (35.4%).
Fire incident types reported to NFIRS in Zip Code 75019

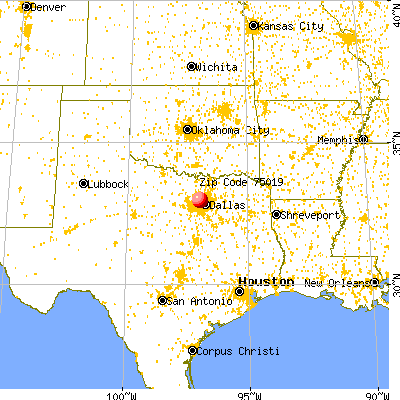


 Nearest zip codes: 75063, 75067, 75006, 75057, 75039, 75038.


 Based on the data from the years 2002 - 2018 the average number of fire incidents per year is 82. The highest number of fires - 130 took place in 2006, and the least - 56 in 2003. The data has an increasing trend.
 When looking into fire subcategories, the most reports belonged to: Outside Fires (46.8%), and Structure Fires (35.4%).