Estimated zip code population in 2022: 50,703 Zip code population in 2010: 45,452 Zip code population in 2000: 46,635
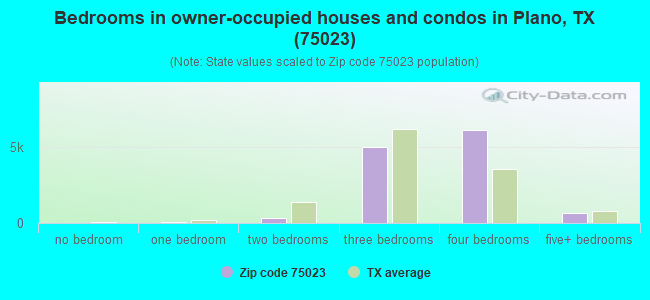
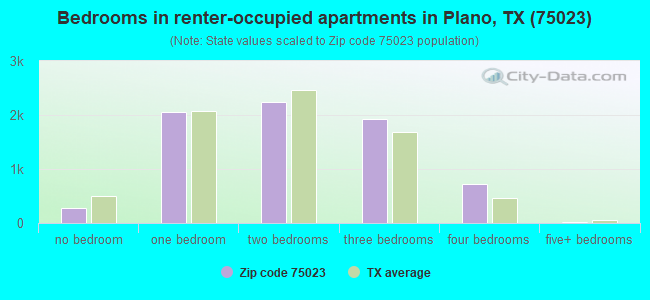
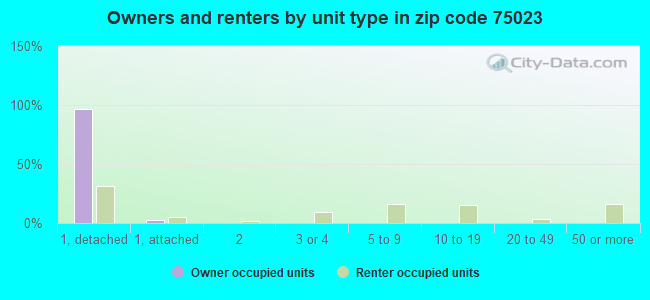
Houses and condos: 19,927 Renter-occupied apartments: 7,273
% of renters here:
37%
State:
38%
March 2022 cost of living index in zip code 75023: 96.6 (near average, U.S. average is 100)
Land area: 9.4 sq. mi. Water area: 0.0 sq. mi.
Population density: 5,382 people per square mile
(average).
OSM Map
General Map
Google Map
MSN Map
OSM Map
General Map
Google Map
MSN Map
OSM Map
General Map
Google Map
MSN Map
OSM Map
General Map
Google Map
MSN Map
Please wait while loading the map...
Real estate property taxes paid for housing units in 2022:
This zip code:
1.4% ($5,894)
Texas:
1.5% ($4,050)
Median real estate property taxes paid for housing units with mortgages in 2022: $6,276 (1.5%) Median real estate property taxes paid for housing units with no mortgage in 2022: $5,432 (1.3%)
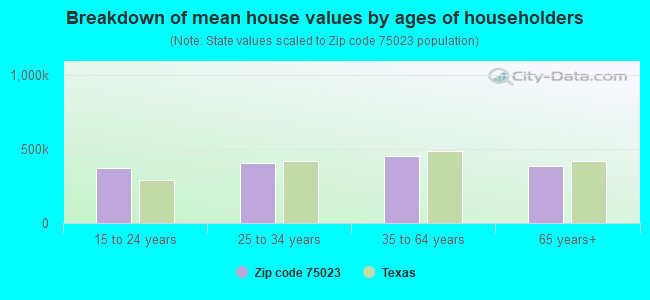
Estimated median house/condo value in 2022: $416,109
75023:
$416,109
Texas:
$275,400
According to our research of Texas and other state lists, there were 43 registered sex offenders living in 75023 zip code as of April 27, 2024. The ratio of all residents to sex offenders in zip code 75023 is 1,162 to 1. The ratio of registered sex offenders to all residents in this zip code is much lower than the state average.
Median resident age:
This zip code:
39.0 years
Texas median age:
35.6 years
Average household size:
This zip code:
2.6 people
Texas:
2.6 people
Averages for the 2020 tax year for zip code 75023, filed in 2021:
Average Adjusted Gross Income (AGI) in 2020: $78,425 (Individual Income Tax Returns)
Here:
$78,425
State:
$77,054
Salary/wage: $70,854 (reported on 82.9% of returns)
Here:
$70,854
State:
$62,766
(% of AGI for various income ranges: 1170.8% for AGIs below $25k, 3714.6% for AGIs $25k-50k, 6642.1% for AGIs $50k-75k, 9744.4% for AGIs $75k-100k, 18760.1% for AGIs $100k-200k, 66377.2% for AGIs over 200k)
Taxable interest for individuals: $1,513 (reported on 29.8% of returns)
This zip code:
$1,513
Texas:
$2,665
(% of AGI for various income ranges: 20.2% for AGIs below $25k, 24.1% for AGIs $25k-50k, 36.6% for AGIs $50k-75k, 63.1% for AGIs $75k-100k, 115.6% for AGIs $100k-200k, 685.7% for AGIs over 200k)
Ordinary dividends: $5,992 (reported on 24.1% of returns)
Here:
$5,992
State:
$10,044
(% of AGI for various income ranges: 28.6% for AGIs below $25k, 44.8% for AGIs $25k-50k, 97.7% for AGIs $50k-75k, 163.6% for AGIs $75k-100k, 403.5% for AGIs $100k-200k, 2785.4% for AGIs over 200k)
Net capital gain/loss in AGI: +$11,998 (reported on 23.0% of returns)
Here:
+$11,998
State:
+$39,590
(% of AGI for various income ranges: 11.4% for AGIs below $25k, 40.3% for AGIs $25k-50k, 94.1% for AGIs $50k-75k, 162.2% for AGIs $75k-100k, 614.4% for AGIs $100k-200k, 7627.4% for AGIs over 200k)
Profit/loss from business: +$11,374 (reported on 20.1% of returns)
Here:
+$11,374
State:
+$10,888
(% of AGI for various income ranges: 140.0% for AGIs below $25k, 174.6% for AGIs $25k-50k, 221.9% for AGIs $50k-75k, 290.7% for AGIs $75k-100k, 595.0% for AGIs $100k-200k, 2656.1% for AGIs over 200k)
Taxable individual retirement arrangement distribution: $25,808 (reported on 9.8% of returns)
75023:
$25,808
Texas:
$24,740
(% of AGI for various income ranges: 59.7% for AGIs below $25k, 115.9% for AGIs $25k-50k, 248.7% for AGIs $50k-75k, 433.0% for AGIs $75k-100k, 870.2% for AGIs $100k-200k, 2891.3% for AGIs over 200k)
Self-employed (Keogh) retirement plans: $22,636 (reported on 0.5% of returns)
75023:
$22,636
Texas:
$29,298
(% of AGI for various income ranges: 7.2% for AGIs $25k-50k, 29.0% for AGIs $100k-200k, 270.2% for AGIs over 200k)
Total itemized deductions: $32,614 (reported on 8.4% of returns)
Here:
$32,614
State:
$40,428
(% of AGI for various income ranges: 52.9% for AGIs below $25k, 131.3% for AGIs $25k-50k, 275.7% for AGIs $50k-75k, 486.9% for AGIs $75k-100k, 746.5% for AGIs $100k-200k, 4090.7% for AGIs over 200k)
Charity contributions: $11,358 (reported on 6.7% of returns)
Here:
$11,358
State:
$18,201
(% of AGI for various income ranges: 3.4% for AGIs below $25k, 17.4% for AGIs $25k-50k, 41.9% for AGIs $50k-75k, 84.9% for AGIs $75k-100k, 210.5% for AGIs $100k-200k, 1660.0% for AGIs over 200k)
Taxes paid: $7,124 (reported on 8.2% of returns)
75023:
$7,124
State:
$7,821
(% of AGI for various income ranges: 9.9% for AGIs below $25k, 24.9% for AGIs $25k-50k, 57.8% for AGIs $50k-75k, 113.7% for AGIs $75k-100k, 186.1% for AGIs $100k-200k, 746.1% for AGIs over 200k)
Earned income credit: $2,140 (reported on 12.0% of returns)
Here:
$2,140
State:
$2,584
(% of AGI for various income ranges: 80.0% for AGIs below $25k, 59.1% for AGIs $25k-50k, 0.9% for AGIs $50k-75k)
Percentage of individuals using paid preparers for their 2020 taxes: 90.7%
Here:
91%
State:
92%
(% for various income ranges: 89.0% for AGIs below $25k, 90.9% for AGIs $25k-50k, 91.7% for AGIs $50k-75k, 92.0% for AGIs $75k-100k, 91.3% for AGIs $100k-200k, 91.8% for AGIs over 200k)
Averages for the 2012 tax year for zip code 75023, filed in 2013:
Average Adjusted Gross Income (AGI) in 2012: $67,286 (Individual Income Tax Returns)
Here:
$67,286
State:
$65,384
Salary/wage: $61,016 (reported on 86.2% of returns)
Here:
$61,016
State:
$52,524
(% of AGI for various income ranges: 78.0% for AGIs below $25k, 83.5% for AGIs $25k-50k, 79.8% for AGIs $50k-75k, 80.7% for AGIs $75k-100k, 81.0% for AGIs $100k-200k, 67.5% for AGIs over 200k)
Taxable interest for individuals: $1,134 (reported on 34.4% of returns)
This zip code:
$1,134
Texas:
$2,372
(% of AGI for various income ranges: 0.9% for AGIs below $25k, 0.5% for AGIs $25k-50k, 0.6% for AGIs $50k-75k, 0.5% for AGIs $75k-100k, 0.5% for AGIs $100k-200k, 0.8% for AGIs over 200k)
Ordinary dividends: $4,651 (reported on 23.3% of returns)
Here:
$4,651
State:
$9,721
(% of AGI for various income ranges: 1.9% for AGIs below $25k, 1.0% for AGIs $25k-50k, 1.1% for AGIs $50k-75k, 1.1% for AGIs $75k-100k, 1.2% for AGIs $100k-200k, 3.2% for AGIs over 200k)
Net capital gain/loss in AGI: +$6,531 (reported on 19.4% of returns)
Here:
+$6,531
State:
+$35,319
(% of AGI for various income ranges: 0.2% for AGIs $25k-50k, 0.2% for AGIs $50k-75k, 0.4% for AGIs $75k-100k, 0.8% for AGIs $100k-200k, 7.2% for AGIs over 200k)
Profit/loss from business: +$13,706 (reported on 20.0% of returns)
Here:
+$13,706
State:
+$13,732
(% of AGI for various income ranges: 9.5% for AGIs below $25k, 4.3% for AGIs $25k-50k, 3.2% for AGIs $50k-75k, 3.0% for AGIs $75k-100k, 3.8% for AGIs $100k-200k, 4.1% for AGIs over 200k)
Taxable individual retirement arrangement distribution: $21,855 (reported on 10.3% of returns)
75023:
$21,855
Texas:
$19,511
(% of AGI for various income ranges: 2.9% for AGIs below $25k, 2.7% for AGIs $25k-50k, 3.3% for AGIs $50k-75k, 3.3% for AGIs $75k-100k, 3.5% for AGIs $100k-200k, 3.7% for AGIs over 200k)
Self-employment retirement plans: $16,933 (reported on 0.8% of returns)
75023:
$16,933
Texas:
$23,938
(% of AGI for various income ranges: 0.1% for AGIs $50k-75k, 0.3% for AGIs $100k-200k, 0.4% for AGIs over 200k)
Total itemized deductions: $19,791 (18% of AGI, reported on 32.8% of returns)
Here:
$19,791
State:
$24,724
Here:
17.7% of AGI
State:
15.9% of AGI
(% of AGI for various income ranges: 9.4% for AGIs below $25k, 9.0% for AGIs $25k-50k, 11.3% for AGIs $50k-75k, 10.5% for AGIs $75k-100k, 9.9% for AGIs $100k-200k, 8.0% for AGIs over 200k)
Charity contributions: $4,773 (reported on 27.3% of returns)
Here:
$4,773
State:
$6,808
(% of AGI for various income ranges: 0.7% for AGIs below $25k, 1.1% for AGIs $25k-50k, 1.5% for AGIs $50k-75k, 1.7% for AGIs $75k-100k, 2.2% for AGIs $100k-200k, 2.7% for AGIs over 200k)
Taxes paid: $5,464 (reported on 32.2% of returns)
75023:
$5,464
State:
$6,921
(% of AGI for various income ranges: 2.0% for AGIs below $25k, 2.0% for AGIs $25k-50k, 2.9% for AGIs $50k-75k, 2.9% for AGIs $75k-100k, 3.0% for AGIs $100k-200k, 2.2% for AGIs over 200k)
Earned income credit: $2,205 (reported on 12.6% of returns)
Here:
$2,205
State:
$2,570
(% of AGI for various income ranges: 5.5% for AGIs below $25k, 0.9% for AGIs $25k-50k)
Percentage of individuals using paid preparers for their 2012 taxes: 40.7%
Here:
41%
State:
51%
(% for various income ranges: 39.7% for AGIs below $25k, 41.2% for AGIs $25k-50k, 41.4% for AGIs $50k-75k, 40.0% for AGIs $75k-100k, 39.2% for AGIs $100k-200k, 52.2% for AGIs over 200k)
Averages for the 2004 tax year for zip code 75023, filed in 2005:
Average Adjusted Gross Income (AGI) in 2004: $60,709 (Individual Income Tax Returns)
Here:
$60,709
State:
$47,881
Salary/wage: $57,446 (reported on 88.1% of returns)
Here:
$57,446
State:
$41,947
(% of AGI for various income ranges: 150.9% for AGIs below $10k, 80.0% for AGIs $10k-25k, 86.0% for AGIs $25k-50k, 84.7% for AGIs $50k-75k, 85.7% for AGIs $75k-100k, 80.8% for AGIs over 100k)
Taxable interest for individuals: $1,256 (reported on 48.3% of returns)
This zip code:
$1,256
Texas:
$2,255
(% of AGI for various income ranges: 8.2% for AGIs below $10k, 2.0% for AGIs $10k-25k, 1.1% for AGIs $25k-50k, 0.8% for AGIs $50k-75k, 0.7% for AGIs $75k-100k, 0.9% for AGIs over 100k)
Taxable dividends: $2,121 (reported on 30.2% of returns)
Here:
$2,121
State:
$4,261
(% of AGI for various income ranges: 5.4% for AGIs below $10k, 1.5% for AGIs $10k-25k, 0.9% for AGIs $25k-50k, 0.7% for AGIs $50k-75k, 0.9% for AGIs $75k-100k, 1.1% for AGIs over 100k)
Net capital gain/loss: +$6,625 (reported on 26.4% of returns)
Here:
+$6,625
State:
+$16,110
(% of AGI for various income ranges: -2.7% for AGIs below $10k, 0.1% for AGIs $10k-25k, 0.2% for AGIs $25k-50k, 0.5% for AGIs $50k-75k, 0.6% for AGIs $75k-100k, 5.4% for AGIs over 100k)
Profit/loss from business: +$12,381 (reported on 18.9% of returns)
Here:
+$12,381
State:
+$11,013
(% of AGI for various income ranges: 1.3% for AGIs below $10k, 7.6% for AGIs $10k-25k, 3.4% for AGIs $25k-50k, 3.2% for AGIs $50k-75k, 3.3% for AGIs $75k-100k, 4.0% for AGIs over 100k)
IRA payment deduction: $3,147 (reported on 3.3% of returns)
75023:
$3,147
Texas:
$3,120
(% of AGI for various income ranges: 0.5% for AGIs below $10k, 0.3% for AGIs $10k-25k, 0.3% for AGIs $25k-50k, 0.2% for AGIs $50k-75k, 0.2% for AGIs $75k-100k, 0.1% for AGIs over 100k)
Self-employed pension: $13,043 (reported on 1.1% of returns)
Here:
$13,043
Texas:
$16,401
(% of AGI for various income ranges: 0.3% for AGIs below $10k, 0.1% for AGIs $25k-50k, 0.1% for AGIs $50k-75k, 0.2% for AGIs $75k-100k, 0.4% for AGIs over 100k)
Total itemized deductions: $17,221 (18% of AGI, reported on 44.0% of returns)
Here:
$17,221
State:
$19,631
Here:
18.3% of AGI
State:
18.9% of AGI
(% of AGI for various income ranges: 24.6% for AGIs below $10k, 13.7% for AGIs $10k-25k, 13.7% for AGIs $25k-50k, 14.8% for AGIs $50k-75k, 15.0% for AGIs $75k-100k, 10.3% for AGIs over 100k)
Charity contributions deductions: $3,503 (4% of AGI, reported on 38.0% of returns)
Here:
$3,503
State:
$4,753
Here:
3.5% of AGI
State:
4.2% of AGI
(% of AGI for various income ranges: 1.1% for AGIs below $10k, 1.1% for AGIs $10k-25k, 1.6% for AGIs $25k-50k, 2.1% for AGIs $50k-75k, 2.4% for AGIs $75k-100k, 2.4% for AGIs over 100k)
Total tax: $10,349 (reported on 80.7% of returns)
75023:
$10,349
State:
$9,058
(% of AGI for various income ranges: 5.3% for AGIs below $10k, 4.6% for AGIs $10k-25k, 7.4% for AGIs $25k-50k, 9.9% for AGIs $50k-75k, 11.5% for AGIs $75k-100k, 18.4% for AGIs over 100k)
Earned income credit: $1,656 (reported on 9.4% of returns)
Here:
$1,656
State:
$2,024
Percentage of individuals using paid preparers for their 2004 taxes: 41.3%
Here:
41%
State:
57%
(% for various income ranges: 34.1% for AGIs below $10k, 47.5% for AGIs $10k-25k, 43.6% for AGIs $25k-50k, 41.3% for AGIs $50k-75k, 38.7% for AGIs $75k-100k, 41.1% for AGIs over 100k)
Likely homosexual households (counted as self-reported same-sex unmarried-partner households)
Lesbian couples: 0.1% of all households
Gay men: 0.0% of all households
Household received Food Stamps/SNAP in the past 12 months: 955 Household did not receive Food Stamps/SNAP in the past 12 months: 18,433
Women who had a birth in the past 12 months: 665 (601 now married, 72 unmarried) Women who did not have a birth in the past 12 months: 11,394 (5,345 now married, 6,037 unmarried)
Housing units in zip code 75023 with a mortgage: 7,201 (546 second mortgage, 491 both second mortgage and home equity loan) Houses without a mortgage: 149
Median monthly owner costs for units with a mortgage: $2,211 Median monthly owner costs for units without a mortgage: $931
Residents with income below the poverty level in 2022:
This zip code:
7.5%
Whole state:
14.0%
Residents with income below 50% of the poverty level in 2022:
This zip code:
3.5%
Whole state:
7.4%
Median number of rooms in houses and condos:
Here:
7.5
State:
6.3
Median number of rooms in apartments:
Here:
4.3
State:
4.0
Notable locations in this zip code not listed on our city pages
Churches in zip code 75023 include: Saint Paul Lutheran Church (A), Saint Elizabeth Ann Seton Catholic Church (B), Fellowship of Plano Church (C). Display/hide their locations on the map
Parks in zip code 75023 include: Horseshoe Park (1), Pioneer Park (2), John Clark Field (3), Enfield Park (4), Longhorn Park (5), Buckhorn Park (6). Display/hide their locations on the map
7,136 married couples with children.
1,831 single-parent households (394 men, 1,437 women).
72.7% of residents of 75023 zip code speak English at home.
11.4% of residents speak Spanish at home (68% very well, 22% well, 8% not well, 2% not at all).
7.2% of residents speak other Indo-European language at home (65% very well, 25% well, 7% not well, 3% not at all).
7.8% of residents speak Asian or Pacific Island language at home (62% very well, 21% well, 14% not well, 3% not at all).
1.7% of residents speak other language at home (81% very well, 14% well, 2% not well, 3% not at all).
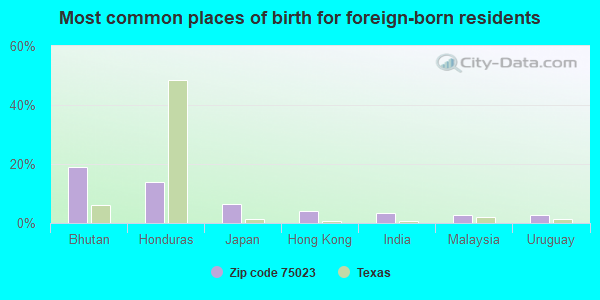
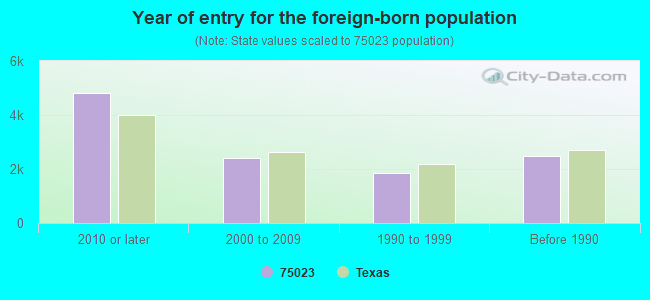
Foreign born population: 10,069 (19.9%) (51.3% of them are naturalized citizens)
Housing units lacking complete plumbing facilities: 0.4% Housing units lacking complete kitchen facilities: 1.7%
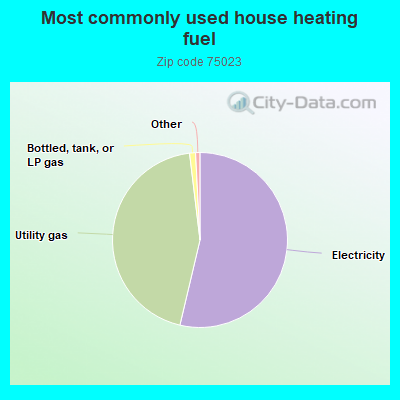
53.7%Electricity
44.4%Utility gas
1.1%Bottled, tank, or LP gas
Population in 1990: 40,832. Population change in the 1990s: +5,803 (+14.2%).
Place of birth for U.S.-born residents:
This state: 21,582
Northeast: 3,258
Midwest: 5,765
South: 5,057
West: 3,955
52% of the 75023 zip code residents lived in the same house 5 years ago. Out of people who lived in different houses, 39% lived in this county. Out of people who lived in different counties, 50% lived in Texas.
88% of the 75023 zip code residents lived in the same house 1 year ago. Out of people who lived in different houses, 46% moved from this county. Out of people who lived in different houses, 28% moved from different county within same state. Out of people who lived in different houses, 22% moved from different state. Out of people who lived in different houses, 6% moved from abroad.
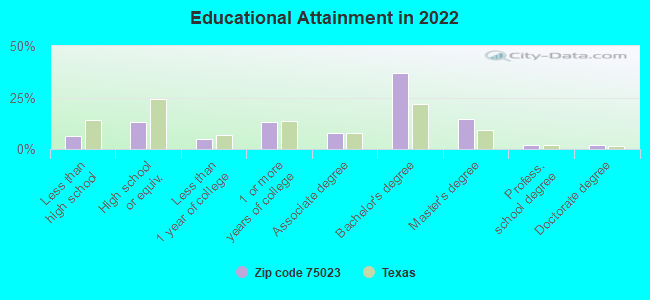
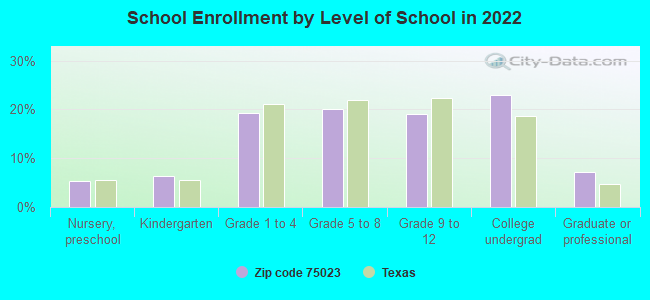
Private vs. public school enrollment:
Students in private schools in grades 1 to 8 (elementary and middle school): 549
Here:
12.8%
Texas:
8.8%
Students in private schools in grades 9 to 12 (high school): 140
Here:
6.7%
Texas:
8.0%
Students in private undergraduate colleges: 344
Here:
13.7%
Texas:
16.2%
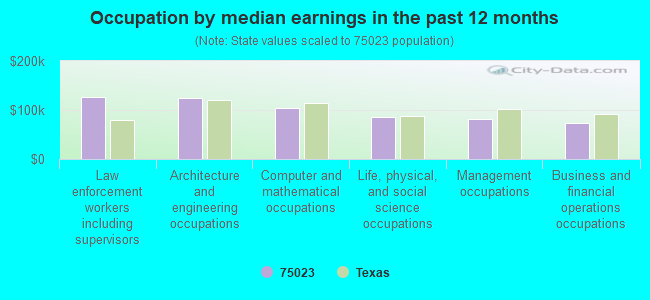
Occupation by median earnings in the past 12 months ($)
127,521Law enforcement workers including supervisors
124,629Architecture and engineering occupations
104,184Computer and mathematical occupations
85,238Life, physical, and social science occupations
81,685Management occupations
73,098Business and financial operations occupations
Companies with federal contracts located in this zip code (PLANO, TX):
RAYTHEON COMPANY (6600 CHASE OAKS BLVD , BLD) : $41,197,654 in 38 contractsfrom 2000 to 2006
Contracts for Night Vision Equipment, Emitted and Reflected Radiation, Defense Electronics and Communication Equipment -- Basic Research (R&D), Program Management/Support Services, Miscellaneous Communication Equipment, and moreby Army, Defense Finance and Accounting Service, NASA, Department of Defense, and others Signed by year:2000: $1,597,367; 2001: $35,631,744; 2002: $1,929,816; 2003: $294,761; 2004: $1,375,943; 2005: $309,491; 2006: $58,532.
Biggest contracts:
$29,921,861 with Army for Night Vision Equipment, Emitted and Reflected Radiation. Signed on 2001-01-24. Completion date: 2002-03-31.
$2,912,064, same as above.Signed on 2001-01-31. Completion date: 2002-10-31.
$1,290,000 with Army for Defense Electronics and Communication Equipment -- Basic Research (R&D). Signed on 2001-06-29. Completion date: 2002-02-27.
$1,115,000, same as above.Signed on 2002-02-25. Completion date: 2001-06-30.
CRYO SOURCE LLC (2520 DOWNING DR; small business) : $585,448 in 4 contractsfrom 2004 to 2005
$528,000 with Defense Logistics Agency for Space and Water Heating Equipment. Signed on 2004-03-17. Completion date: 2004-06-06.
$31,920, same as above.Signed on 2004-03-17. Completion date: 2004-06-06.
$13,300 with Defense Logistics Agency for Liquid and Gas Flow, Liquid Level, and Mechanical Motion Measuring Instruments. Signed on 2005-09-27. Completion date: 2005-12-26.
$12,228 with Defense Logistics Agency for Space and Water Heating Equipment. Signed on 2004-10-05. Completion date: 2004-11-17.
ADVANCED SOURCE INTERNATIONAL (3415 CUSTER RD STE 125; small business) : $459,518 in 4 contractsfrom 2002 to 2005
$315,000 with Army for Office Furniture. Signed on 2002-09-22. Completion date: 2002-11-01.
$113,750 with Army for Public Relations Services(includes writing services, event planning and management, media relations, radio and television analysis, and press services). Taking place in GA. Signed on 2004-09-28. Completion date: 2004-10-28.
$18,800 with Army for Office Furniture. Signed on 2005-08-04. Completion date: 2005-08-29.
$11,968 with Army for Office Devices and Accessories. Signed on 2002-05-30. Completion date: 2002-06-30.
DAVID CORNISH & CO., INC. (3400 SILVERSTONE #125; small business)
$75,000 with Navy for Waste Treatment and Storage. Signed on 2000-09-26. Completion date: 2001-07-16.
MARTIN, TEDDY T (2505 FOUNTAIN HEAD DR; small business) : $20,840 in 3 contractsfrom 2005 to 2006
$8,170 with Army for Recreation Site Maintenance Services (non-construction). Signed on 2005-03-12. Completion date: 2005-09-12.
$8,170 with U.S. Army Corps of Engineers - civil program financing only for Recreation Site Maintenance Services (non-construction). Signed on 2005-03-12. Completion date: 2005-09-12.
$4,500 with Army for Recreation Site Maintenance Services (non-construction). Signed on 2006-06-06. Completion date: 2006-09-06.
SCHIER BILL,OWNER (2304 CHAMBERLIN DR; small business)
$12,800 with Air Force for Maintenance, Repair or Alteration of Real Property -- Restoration of real property. Taking place in LA. Signed on 2004-07-14. Completion date: 2004-07-15.
USE OF FORCE CONSULTANTS (1113 OVERDOWNS; small business)
$3,525 with Army for Other Education and Training Services. Taking place in OK. Signed on 2002-04-01. Completion date: 2002-03-01.
Top industries in this zip code by the number of employees in 2005:
2002 - 2018 National Fire Incident Reporting System (NFIRS) incidents
According to the data from the years 2002 - 2018 the average number of fire incidents per year is 69. The highest number of fire incidents - 109 took place in 2003, and the least - 44 in 2015. The data has a decreasing trend.
When looking into fire subcategories, the most incidents belonged to: Structure Fires (39.3%), and Outside Fires (39.1%).
Fire incident types reported to NFIRS in Zip Code 75023


 Nearest zip codes: 75025, 75075, 75074, 75013, 75024, 75080.


 : $41,197,654 in 38 contracts from 2000 to 2006
 According to the data from the years 2002 - 2018 the average number of fire incidents per year is 69. The highest number of fire incidents - 109 took place in 2003, and the least - 44 in 2015. The data has a decreasing trend.
 When looking into fire subcategories, the most incidents belonged to: Structure Fires (39.3%), and Outside Fires (39.1%).