Cities: Sherman, TX (21.08%) ,
Southmayd, TX (1.58%) ,
Howe, TX (0.32%) ,
Knollwood, TX (0.29%) ,
Dorchester, TX (0.20%) ,
Sadler, TX (0.08%) County: Grayson County, TX Estimated zip code population in 2022: 27,302
Zip code population in 2010: 22,839
Zip code population in 2000: 20,423
Houses and condos: 13,068
Renter-occupied apartments: 5,481
% of renters here:
45%State:
38%
March 2022 cost of living index in zip code 75092: 86.4
(less than average, U.S. average is 100)
Land area: 113.3
sq. mi.
Water area: 0.4
sq. mi.
Population density: 241 people per square mile (very low).
OSM Map
General Map
Google Map
MSN Map
OSM Map
General Map
Google Map
MSN Map
OSM Map
General Map
Google Map
MSN Map
OSM Map
General Map
Google Map
MSN Map
Please wait while loading the map...
Real estate property taxes paid for housing units in 2022:
This zip code:
1.4% ($3,716)Texas:
1.5% ($4,050)
Median real estate property taxes paid for housing units with mortgages in 2022: $4,449 (1.4%)
Median real estate property taxes paid for housing units with no mortgage in 2022: $2,380 (1.1%)
Profiles of local businesses
Business Search - 14 Million verified businesses
Males: 13,509 Females: 13,793
For population 25 years and over in 75092:
High school or higher: 93.8%Bachelor's degree or higher: 31.6%Graduate or professional degree: 12.1%Unemployed: 2.3%Mean travel time to work (commute): 21.8 minutes
For population 15 years and over in 75092:
Never married: 28.2%Now married: 52.3%Separated: 0.9%Widowed: 4.7%Divorced: 13.9%
Zip code 75092 compared to state average:
Unemployed percentage below state average. Black race population percentage below state average. Hispanic race population percentage significantly below state average. Median age above state average. Foreign-born population percentage significantly below state average. Length of stay since moving in above state average. 20,547 75.3% White 2,434 8.9% Hispanic or Latino 1,679 6.2% Black 1,445 5.3% Two or more races 983 3.6% Asian 147 0.5% Some other race 62 0.2% American Indian
Data:
Median household income ($)
Median household income (% change since 2000)
Household income diversity
Ratio of average income to average house value (%)
Ratio of average income to average rent
Median household income ($) - White
Median household income ($) - Black or African American
Median household income ($) - Asian
Median household income ($) - Hispanic or Latino
Median household income ($) - American Indian and Alaska Native
Median household income ($) - Multirace
Median household income ($) - Other Race
Median household income for houses/condos with a mortgage ($)
Median household income for apartments without a mortgage ($)
Races - White alone (%)
Races - White alone (% change since 2000)
Races - Black alone (%)
Races - Black alone (% change since 2000)
Races - American Indian alone (%)
Races - American Indian alone (% change since 2000)
Races - Asian alone (%)
Races - Asian alone (% change since 2000)
Races - Hispanic (%)
Races - Hispanic (% change since 2000)
Races - Native Hawaiian and Other Pacific Islander alone (%)
Races - Native Hawaiian and Other Pacific Islander alone (% change since 2000)
Races - Two or more races (%)
Races - Two or more races (% change since 2000)
Races - Other race alone (%)
Races - Other race alone (% change since 2000)
Racial diversity
Unemployment (%)
Unemployment (% change since 2000)
Unemployment (%) - White
Unemployment (%) - Black or African American
Unemployment (%) - Asian
Unemployment (%) - Hispanic or Latino
Unemployment (%) - American Indian and Alaska Native
Unemployment (%) - Multirace
Unemployment (%) - Other Race
Population density (people per square mile)
Population - Males (%)
Population - Females (%)
Population - Males (%) - White
Population - Males (%) - Black or African American
Population - Males (%) - Asian
Population - Males (%) - Hispanic or Latino
Population - Males (%) - American Indian and Alaska Native
Population - Males (%) - Multirace
Population - Males (%) - Other Race
Population - Females (%) - White
Population - Females (%) - Black or African American
Population - Females (%) - Asian
Population - Females (%) - Hispanic or Latino
Population - Females (%) - American Indian and Alaska Native
Population - Females (%) - Multirace
Population - Females (%) - Other Race
Coronavirus confirmed cases (Apr 27, 2024)
Deaths caused by coronavirus (Apr 27, 2024)
Coronavirus confirmed cases (per 100k population) (Apr 27, 2024)
Deaths caused by coronavirus (per 100k population) (Apr 27, 2024)
Daily increase in number of cases (Apr 27, 2024)
Weekly increase in number of cases (Apr 27, 2024)
Cases doubled (in days) (Apr 27, 2024)
Hospitalized patients (Apr 18, 2022)
Negative test results (Apr 18, 2022)
Total test results (Apr 18, 2022)
COVID Vaccine doses distributed (per 100k population) (Sep 19, 2023)
COVID Vaccine doses administered (per 100k population) (Sep 19, 2023)
COVID Vaccine doses distributed (Sep 19, 2023)
COVID Vaccine doses administered (Sep 19, 2023)
Likely homosexual households (%)
Likely homosexual households (% change since 2000)
Likely homosexual households - Lesbian couples (%)
Likely homosexual households - Lesbian couples (% change since 2000)
Likely homosexual households - Gay men (%)
Likely homosexual households - Gay men (% change since 2000)
Cost of living index
Median gross rent ($)
Median contract rent ($)
Median monthly housing costs ($)
Median house or condo value ($)
Median house or condo value ($ change since 2000)
Mean house or condo value by units in structure - 1, detached ($)
Mean house or condo value by units in structure - 1, attached ($)
Mean house or condo value by units in structure - 2 ($)
Mean house or condo value by units in structure by units in structure - 3 or 4 ($)
Mean house or condo value by units in structure - 5 or more ($)
Mean house or condo value by units in structure - Boat, RV, van, etc. ($)
Mean house or condo value by units in structure - Mobile home ($)
Median house or condo value ($) - White
Median house or condo value ($) - Black or African American
Median house or condo value ($) - Asian
Median house or condo value ($) - Hispanic or Latino
Median house or condo value ($) - American Indian and Alaska Native
Median house or condo value ($) - Multirace
Median house or condo value ($) - Other Race
Median resident age
Resident age diversity
Median resident age - Males
Median resident age - Females
Median resident age - White
Median resident age - Black or African American
Median resident age - Asian
Median resident age - Hispanic or Latino
Median resident age - American Indian and Alaska Native
Median resident age - Multirace
Median resident age - Other Race
Median resident age - Males - White
Median resident age - Males - Black or African American
Median resident age - Males - Asian
Median resident age - Males - Hispanic or Latino
Median resident age - Males - American Indian and Alaska Native
Median resident age - Males - Multirace
Median resident age - Males - Other Race
Median resident age - Females - White
Median resident age - Females - Black or African American
Median resident age - Females - Asian
Median resident age - Females - Hispanic or Latino
Median resident age - Females - American Indian and Alaska Native
Median resident age - Females - Multirace
Median resident age - Females - Other Race
Commute - mean travel time to work (minutes)
Travel time to work - Less than 5 minutes (%)
Travel time to work - Less than 5 minutes (% change since 2000)
Travel time to work - 5 to 9 minutes (%)
Travel time to work - 5 to 9 minutes (% change since 2000)
Travel time to work - 10 to 19 minutes (%)
Travel time to work - 10 to 19 minutes (% change since 2000)
Travel time to work - 20 to 29 minutes (%)
Travel time to work - 20 to 29 minutes (% change since 2000)
Travel time to work - 30 to 39 minutes (%)
Travel time to work - 30 to 39 minutes (% change since 2000)
Travel time to work - 40 to 59 minutes (%)
Travel time to work - 40 to 59 minutes (% change since 2000)
Travel time to work - 60 to 89 minutes (%)
Travel time to work - 60 to 89 minutes (% change since 2000)
Travel time to work - 90 or more minutes (%)
Travel time to work - 90 or more minutes (% change since 2000)
Marital status - Never married (%)
Marital status - Now married (%)
Marital status - Separated (%)
Marital status - Widowed (%)
Marital status - Divorced (%)
Median family income ($)
Median family income (% change since 2000)
Median non-family income ($)
Median non-family income (% change since 2000)
Median per capita income ($)
Median per capita income (% change since 2000)
Median family income ($) - White
Median family income ($) - Black or African American
Median family income ($) - Asian
Median family income ($) - Hispanic or Latino
Median family income ($) - American Indian and Alaska Native
Median family income ($) - Multirace
Median family income ($) - Other Race
Median year house/condo built
Median year apartment built
Year house built - Built 2005 or later (%)
Year house built - Built 2000 to 2004 (%)
Year house built - Built 1990 to 1999 (%)
Year house built - Built 1980 to 1989 (%)
Year house built - Built 1970 to 1979 (%)
Year house built - Built 1960 to 1969 (%)
Year house built - Built 1950 to 1959 (%)
Year house built - Built 1940 to 1949 (%)
Year house built - Built 1939 or earlier (%)
Average household size
Household density (households per square mile)
Average household size - White
Average household size - Black or African American
Average household size - Asian
Average household size - Hispanic or Latino
Average household size - American Indian and Alaska Native
Average household size - Multirace
Average household size - Other Race
Occupied housing units (%)
Vacant housing units (%)
Owner occupied housing units (%)
Renter occupied housing units (%)
Vacancy status - For rent (%)
Vacancy status - For sale only (%)
Vacancy status - Rented or sold, not occupied (%)
Vacancy status - For seasonal, recreational, or occasional use (%)
Vacancy status - For migrant workers (%)
Vacancy status - Other vacant (%)
Residents with income below the poverty level (%)
Residents with income below 50% of the poverty level (%)
Children below poverty level (%)
Poor families by family type - Married-couple family (%)
Poor families by family type - Male, no wife present (%)
Poor families by family type - Female, no husband present (%)
Poverty status for native-born residents (%)
Poverty status for foreign-born residents (%)
Poverty among high school graduates not in families (%)
Poverty among people who did not graduate high school not in families (%)
Residents with income below the poverty level (%) - White
Residents with income below the poverty level (%) - Black or African American
Residents with income below the poverty level (%) - Asian
Residents with income below the poverty level (%) - Hispanic or Latino
Residents with income below the poverty level (%) - American Indian and Alaska Native
Residents with income below the poverty level (%) - Multirace
Residents with income below the poverty level (%) - Other Race
Air pollution - Air Quality Index (AQI)
Air pollution - CO
Air pollution - NO2
Air pollution - SO2
Air pollution - Ozone
Air pollution - PM10
Air pollution - PM25
Air pollution - Pb
Crime - Murders per 100,000 population
Crime - Rapes per 100,000 population
Crime - Robberies per 100,000 population
Crime - Assaults per 100,000 population
Crime - Burglaries per 100,000 population
Crime - Thefts per 100,000 population
Crime - Auto thefts per 100,000 population
Crime - Arson per 100,000 population
Crime - City-data.com crime index
Crime - Violent crime index
Crime - Property crime index
Crime - Murders per 100,000 population (5 year average)
Crime - Rapes per 100,000 population (5 year average)
Crime - Robberies per 100,000 population (5 year average)
Crime - Assaults per 100,000 population (5 year average)
Crime - Burglaries per 100,000 population (5 year average)
Crime - Thefts per 100,000 population (5 year average)
Crime - Auto thefts per 100,000 population (5 year average)
Crime - Arson per 100,000 population (5 year average)
Crime - City-data.com crime index (5 year average)
Crime - Violent crime index (5 year average)
Crime - Property crime index (5 year average)
1996 Presidential Elections Results (%) - Democratic Party (Clinton)
1996 Presidential Elections Results (%) - Republican Party (Dole)
1996 Presidential Elections Results (%) - Other
2000 Presidential Elections Results (%) - Democratic Party (Gore)
2000 Presidential Elections Results (%) - Republican Party (Bush)
2000 Presidential Elections Results (%) - Other
2004 Presidential Elections Results (%) - Democratic Party (Kerry)
2004 Presidential Elections Results (%) - Republican Party (Bush)
2004 Presidential Elections Results (%) - Other
2008 Presidential Elections Results (%) - Democratic Party (Obama)
2008 Presidential Elections Results (%) - Republican Party (McCain)
2008 Presidential Elections Results (%) - Other
2012 Presidential Elections Results (%) - Democratic Party (Obama)
2012 Presidential Elections Results (%) - Republican Party (Romney)
2012 Presidential Elections Results (%) - Other
2016 Presidential Elections Results (%) - Democratic Party (Clinton)
2016 Presidential Elections Results (%) - Republican Party (Trump)
2016 Presidential Elections Results (%) - Other
2020 Presidential Elections Results (%) - Democratic Party (Biden)
2020 Presidential Elections Results (%) - Republican Party (Trump)
2020 Presidential Elections Results (%) - Other
Ancestries Reported - Arab (%)
Ancestries Reported - Czech (%)
Ancestries Reported - Danish (%)
Ancestries Reported - Dutch (%)
Ancestries Reported - English (%)
Ancestries Reported - French (%)
Ancestries Reported - French Canadian (%)
Ancestries Reported - German (%)
Ancestries Reported - Greek (%)
Ancestries Reported - Hungarian (%)
Ancestries Reported - Irish (%)
Ancestries Reported - Italian (%)
Ancestries Reported - Lithuanian (%)
Ancestries Reported - Norwegian (%)
Ancestries Reported - Polish (%)
Ancestries Reported - Portuguese (%)
Ancestries Reported - Russian (%)
Ancestries Reported - Scotch-Irish (%)
Ancestries Reported - Scottish (%)
Ancestries Reported - Slovak (%)
Ancestries Reported - Subsaharan African (%)
Ancestries Reported - Swedish (%)
Ancestries Reported - Swiss (%)
Ancestries Reported - Ukrainian (%)
Ancestries Reported - United States (%)
Ancestries Reported - Welsh (%)
Ancestries Reported - West Indian (%)
Ancestries Reported - Other (%)
Educational Attainment - No schooling completed (%)
Educational Attainment - Less than high school (%)
Educational Attainment - High school or equivalent (%)
Educational Attainment - Less than 1 year of college (%)
Educational Attainment - 1 or more years of college (%)
Educational Attainment - Associate degree (%)
Educational Attainment - Bachelor's degree (%)
Educational Attainment - Master's degree (%)
Educational Attainment - Professional school degree (%)
Educational Attainment - Doctorate degree (%)
School Enrollment - Nursery, preschool (%)
School Enrollment - Kindergarten (%)
School Enrollment - Grade 1 to 4 (%)
School Enrollment - Grade 5 to 8 (%)
School Enrollment - Grade 9 to 12 (%)
School Enrollment - College undergrad (%)
School Enrollment - Graduate or professional (%)
School Enrollment - Not enrolled in school (%)
School enrollment - Public schools (%)
School enrollment - Private schools (%)
School enrollment - Not enrolled (%)
Median number of rooms in houses and condos
Median number of rooms in apartments
Housing units lacking complete plumbing facilities (%)
Housing units lacking complete kitchen facilities (%)
Density of houses
Urban houses (%)
Rural houses (%)
Households with people 60 years and over (%)
Households with people 65 years and over (%)
Households with people 75 years and over (%)
Households with one or more nonrelatives (%)
Households with no nonrelatives (%)
Population in households (%)
Family households (%)
Nonfamily households (%)
Population in families (%)
Family households with own children (%)
Median number of bedrooms in owner occupied houses
Mean number of bedrooms in owner occupied houses
Median number of bedrooms in renter occupied houses
Mean number of bedrooms in renter occupied houses
Median number of vehichles in owner occupied houses
Mean number of vehichles in owner occupied houses
Median number of vehichles in renter occupied houses
Mean number of vehichles in renter occupied houses
Mortgage status - with mortgage (%)
Mortgage status - with second mortgage (%)
Mortgage status - with home equity loan (%)
Mortgage status - with both second mortgage and home equity loan (%)
Mortgage status - without a mortgage (%)
Average family size
Average family size - White
Average family size - Black or African American
Average family size - Asian
Average family size - Hispanic or Latino
Average family size - American Indian and Alaska Native
Average family size - Multirace
Average family size - Other Race
Geographical mobility - Same house 1 year ago (%)
Geographical mobility - Moved within same county (%)
Geographical mobility - Moved from different county within same state (%)
Geographical mobility - Moved from different state (%)
Geographical mobility - Moved from abroad (%)
Place of birth - Born in state of residence (%)
Place of birth - Born in other state (%)
Place of birth - Native, outside of US (%)
Place of birth - Foreign born (%)
Housing units in structures - 1, detached (%)
Housing units in structures - 1, attached (%)
Housing units in structures - 2 (%)
Housing units in structures - 3 or 4 (%)
Housing units in structures - 5 to 9 (%)
Housing units in structures - 10 to 19 (%)
Housing units in structures - 20 to 49 (%)
Housing units in structures - 50 or more (%)
Housing units in structures - Mobile home (%)
Housing units in structures - Boat, RV, van, etc. (%)
House/condo owner moved in on average (years ago)
Renter moved in on average (years ago)
Year householder moved into unit - Moved in 1999 to March 2000 (%)
Year householder moved into unit - Moved in 1995 to 1998 (%)
Year householder moved into unit - Moved in 1990 to 1994 (%)
Year householder moved into unit - Moved in 1980 to 1989 (%)
Year householder moved into unit - Moved in 1970 to 1979 (%)
Year householder moved into unit - Moved in 1969 or earlier (%)
Means of transportation to work - Drove car alone (%)
Means of transportation to work - Carpooled (%)
Means of transportation to work - Public transportation (%)
Means of transportation to work - Bus or trolley bus (%)
Means of transportation to work - Streetcar or trolley car (%)
Means of transportation to work - Subway or elevated (%)
Means of transportation to work - Railroad (%)
Means of transportation to work - Ferryboat (%)
Means of transportation to work - Taxicab (%)
Means of transportation to work - Motorcycle (%)
Means of transportation to work - Bicycle (%)
Means of transportation to work - Walked (%)
Means of transportation to work - Other means (%)
Working at home (%)
Industry diversity
Most Common Industries - Agriculture, forestry, fishing and hunting, and mining (%)
Most Common Industries - Agriculture, forestry, fishing and hunting (%)
Most Common Industries - Mining, quarrying, and oil and gas extraction (%)
Most Common Industries - Construction (%)
Most Common Industries - Manufacturing (%)
Most Common Industries - Wholesale trade (%)
Most Common Industries - Retail trade (%)
Most Common Industries - Transportation and warehousing, and utilities (%)
Most Common Industries - Transportation and warehousing (%)
Most Common Industries - Utilities (%)
Most Common Industries - Information (%)
Most Common Industries - Finance and insurance, and real estate and rental and leasing (%)
Most Common Industries - Finance and insurance (%)
Most Common Industries - Real estate and rental and leasing (%)
Most Common Industries - Professional, scientific, and management, and administrative and waste management services (%)
Most Common Industries - Professional, scientific, and technical services (%)
Most Common Industries - Management of companies and enterprises (%)
Most Common Industries - Administrative and support and waste management services (%)
Most Common Industries - Educational services, and health care and social assistance (%)
Most Common Industries - Educational services (%)
Most Common Industries - Health care and social assistance (%)
Most Common Industries - Arts, entertainment, and recreation, and accommodation and food services (%)
Most Common Industries - Arts, entertainment, and recreation (%)
Most Common Industries - Accommodation and food services (%)
Most Common Industries - Other services, except public administration (%)
Most Common Industries - Public administration (%)
Occupation diversity
Most Common Occupations - Management, business, science, and arts occupations (%)
Most Common Occupations - Management, business, and financial occupations (%)
Most Common Occupations - Management occupations (%)
Most Common Occupations - Business and financial operations occupations (%)
Most Common Occupations - Computer, engineering, and science occupations (%)
Most Common Occupations - Computer and mathematical occupations (%)
Most Common Occupations - Architecture and engineering occupations (%)
Most Common Occupations - Life, physical, and social science occupations (%)
Most Common Occupations - Education, legal, community service, arts, and media occupations (%)
Most Common Occupations - Community and social service occupations (%)
Most Common Occupations - Legal occupations (%)
Most Common Occupations - Education, training, and library occupations (%)
Most Common Occupations - Arts, design, entertainment, sports, and media occupations (%)
Most Common Occupations - Healthcare practitioners and technical occupations (%)
Most Common Occupations - Health diagnosing and treating practitioners and other technical occupations (%)
Most Common Occupations - Health technologists and technicians (%)
Most Common Occupations - Service occupations (%)
Most Common Occupations - Healthcare support occupations (%)
Most Common Occupations - Protective service occupations (%)
Most Common Occupations - Fire fighting and prevention, and other protective service workers including supervisors (%)
Most Common Occupations - Law enforcement workers including supervisors (%)
Most Common Occupations - Food preparation and serving related occupations (%)
Most Common Occupations - Building and grounds cleaning and maintenance occupations (%)
Most Common Occupations - Personal care and service occupations (%)
Most Common Occupations - Sales and office occupations (%)
Most Common Occupations - Sales and related occupations (%)
Most Common Occupations - Office and administrative support occupations (%)
Most Common Occupations - Natural resources, construction, and maintenance occupations (%)
Most Common Occupations - Farming, fishing, and forestry occupations (%)
Most Common Occupations - Construction and extraction occupations (%)
Most Common Occupations - Installation, maintenance, and repair occupations (%)
Most Common Occupations - Production, transportation, and material moving occupations (%)
Most Common Occupations - Production occupations (%)
Most Common Occupations - Transportation occupations (%)
Most Common Occupations - Material moving occupations (%)
People in Group quarters - Institutionalized population (%)
People in Group quarters - Correctional institutions (%)
People in Group quarters - Federal prisons and detention centers (%)
People in Group quarters - Halfway houses (%)
People in Group quarters - Local jails and other confinement facilities (including police lockups) (%)
People in Group quarters - Military disciplinary barracks (%)
People in Group quarters - State prisons (%)
People in Group quarters - Other types of correctional institutions (%)
People in Group quarters - Nursing homes (%)
People in Group quarters - Hospitals/wards, hospices, and schools for the handicapped (%)
People in Group quarters - Hospitals/wards and hospices for chronically ill (%)
People in Group quarters - Hospices or homes for chronically ill (%)
People in Group quarters - Military hospitals or wards for chronically ill (%)
People in Group quarters - Other hospitals or wards for chronically ill (%)
People in Group quarters - Hospitals or wards for drug/alcohol abuse (%)
People in Group quarters - Mental (Psychiatric) hospitals or wards (%)
People in Group quarters - Schools, hospitals, or wards for the mentally retarded (%)
People in Group quarters - Schools, hospitals, or wards for the physically handicapped (%)
People in Group quarters - Institutions for the deaf (%)
People in Group quarters - Institutions for the blind (%)
People in Group quarters - Orthopedic wards and institutions for the physically handicapped (%)
People in Group quarters - Wards in general hospitals for patients who have no usual home elsewhere (%)
People in Group quarters - Wards in military hospitals for patients who have no usual home elsewhere (%)
People in Group quarters - Juvenile institutions (%)
People in Group quarters - Long-term care (%)
People in Group quarters - Homes for abused, dependent, and neglected children (%)
People in Group quarters - Residential treatment centers for emotionally disturbed children (%)
People in Group quarters - Training schools for juvenile delinquents (%)
People in Group quarters - Short-term care, detention or diagnostic centers for delinquent children (%)
People in Group quarters - Type of juvenile institution unknown (%)
People in Group quarters - Noninstitutionalized population (%)
People in Group quarters - College dormitories (includes college quarters off campus) (%)
People in Group quarters - Military quarters (%)
People in Group quarters - On base (%)
People in Group quarters - Barracks, unaccompanied personnel housing (UPH), (Enlisted/Officer), ;and similar group living quarters for military personnel (%)
People in Group quarters - Transient quarters for temporary residents (%)
People in Group quarters - Military ships (%)
People in Group quarters - Group homes (%)
People in Group quarters - Homes or halfway houses for drug/alcohol abuse (%)
People in Group quarters - Homes for the mentally ill (%)
People in Group quarters - Homes for the mentally retarded (%)
People in Group quarters - Homes for the physically handicapped (%)
People in Group quarters - Other group homes (%)
People in Group quarters - Religious group quarters (%)
People in Group quarters - Dormitories (%)
People in Group quarters - Agriculture workers' dormitories on farms (%)
People in Group quarters - Job Corps and vocational training facilities (%)
People in Group quarters - Other workers' dormitories (%)
People in Group quarters - Crews of maritime vessels (%)
People in Group quarters - Other nonhousehold living situations (%)
People in Group quarters - Other noninstitutional group quarters (%)
Residents speaking English at home (%)
Residents speaking English at home - Born in the United States (%)
Residents speaking English at home - Native, born elsewhere (%)
Residents speaking English at home - Foreign born (%)
Residents speaking Spanish at home (%)
Residents speaking Spanish at home - Born in the United States (%)
Residents speaking Spanish at home - Native, born elsewhere (%)
Residents speaking Spanish at home - Foreign born (%)
Residents speaking other language at home (%)
Residents speaking other language at home - Born in the United States (%)
Residents speaking other language at home - Native, born elsewhere (%)
Residents speaking other language at home - Foreign born (%)
Class of Workers - Employee of private company (%)
Class of Workers - Self-employed in own incorporated business (%)
Class of Workers - Private not-for-profit wage and salary workers (%)
Class of Workers - Local government workers (%)
Class of Workers - State government workers (%)
Class of Workers - Federal government workers (%)
Class of Workers - Self-employed workers in own not incorporated business and Unpaid family workers (%)
House heating fuel used in houses and condos - Utility gas (%)
House heating fuel used in houses and condos - Bottled, tank, or LP gas (%)
House heating fuel used in houses and condos - Electricity (%)
House heating fuel used in houses and condos - Fuel oil, kerosene, etc. (%)
House heating fuel used in houses and condos - Coal or coke (%)
House heating fuel used in houses and condos - Wood (%)
House heating fuel used in houses and condos - Solar energy (%)
House heating fuel used in houses and condos - Other fuel (%)
House heating fuel used in houses and condos - No fuel used (%)
House heating fuel used in apartments - Utility gas (%)
House heating fuel used in apartments - Bottled, tank, or LP gas (%)
House heating fuel used in apartments - Electricity (%)
House heating fuel used in apartments - Fuel oil, kerosene, etc. (%)
House heating fuel used in apartments - Coal or coke (%)
House heating fuel used in apartments - Wood (%)
House heating fuel used in apartments - Solar energy (%)
House heating fuel used in apartments - Other fuel (%)
House heating fuel used in apartments - No fuel used (%)
Armed forces status - In Armed Forces (%)
Armed forces status - Civilian (%)
Armed forces status - Civilian - Veteran (%)
Armed forces status - Civilian - Nonveteran (%)
Fatal accidents locations in years 2005-2021
Fatal accidents locations in 2005
Fatal accidents locations in 2006
Fatal accidents locations in 2007
Fatal accidents locations in 2008
Fatal accidents locations in 2009
Fatal accidents locations in 2010
Fatal accidents locations in 2011
Fatal accidents locations in 2012
Fatal accidents locations in 2013
Fatal accidents locations in 2014
Fatal accidents locations in 2015
Fatal accidents locations in 2016
Fatal accidents locations in 2017
Fatal accidents locations in 2018
Fatal accidents locations in 2019
Fatal accidents locations in 2020
Fatal accidents locations in 2021
Alcohol use - People drinking some alcohol every month (%)
Alcohol use - People not drinking at all (%)
Alcohol use - Average days/month drinking alcohol
Alcohol use - Average drinks/week
Alcohol use - Average days/year people drink much
Audiometry - Average condition of hearing (%)
Audiometry - People that can hear a whisper from across a quiet room (%)
Audiometry - People that can hear normal voice from across a quiet room (%)
Audiometry - Ears ringing, roaring, buzzing (%)
Audiometry - Had a job exposure to loud noise (%)
Audiometry - Had off-work exposure to loud noise (%)
Blood Pressure & Cholesterol - Has high blood pressure (%)
Blood Pressure & Cholesterol - Checking blood pressure at home (%)
Blood Pressure & Cholesterol - Frequently checking blood cholesterol (%)
Blood Pressure & Cholesterol - Has high cholesterol level (%)
Consumer Behavior - Money monthly spent on food at supermarket/grocery store
Consumer Behavior - Money monthly spent on food at other stores
Consumer Behavior - Money monthly spent on eating out
Consumer Behavior - Money monthly spent on carryout/delivered foods
Consumer Behavior - Income spent on food at supermarket/grocery store (%)
Consumer Behavior - Income spent on food at other stores (%)
Consumer Behavior - Income spent on eating out (%)
Consumer Behavior - Income spent on carryout/delivered foods (%)
Current Health Status - General health condition (%)
Current Health Status - Blood donors (%)
Current Health Status - Has blood ever tested for HIV virus (%)
Current Health Status - Left-handed people (%)
Dermatology - People using sunscreen (%)
Diabetes - Diabetics (%)
Diabetes - Had a blood test for high blood sugar (%)
Diabetes - People taking insulin (%)
Diet Behavior & Nutrition - Diet health (%)
Diet Behavior & Nutrition - Milk product consumption (# of products/month)
Diet Behavior & Nutrition - Meals not home prepared (#/week)
Diet Behavior & Nutrition - Meals from fast food or pizza place (#/week)
Diet Behavior & Nutrition - Ready-to-eat foods (#/month)
Diet Behavior & Nutrition - Frozen meals/pizza (#/month)
Drug Use - People that ever used marijuana or hashish (%)
Drug Use - Ever used hard drugs (%)
Drug Use - Ever used any form of cocaine (%)
Drug Use - Ever used heroin (%)
Drug Use - Ever used methamphetamine (%)
Health Insurance - People covered by health insurance (%)
Kidney Conditions-Urology - Avg. # of times urinating at night
Medical Conditions - People with asthma (%)
Medical Conditions - People with anemia (%)
Medical Conditions - People with psoriasis (%)
Medical Conditions - People with overweight (%)
Medical Conditions - Elderly people having difficulties in thinking or remembering (%)
Medical Conditions - People who ever received blood transfusion (%)
Medical Conditions - People having trouble seeing even with glass/contacts (%)
Medical Conditions - People with arthritis (%)
Medical Conditions - People with gout (%)
Medical Conditions - People with congestive heart failure (%)
Medical Conditions - People with coronary heart disease (%)
Medical Conditions - People with angina pectoris (%)
Medical Conditions - People who ever had heart attack (%)
Medical Conditions - People who ever had stroke (%)
Medical Conditions - People with emphysema (%)
Medical Conditions - People with thyroid problem (%)
Medical Conditions - People with chronic bronchitis (%)
Medical Conditions - People with any liver condition (%)
Medical Conditions - People who ever had cancer or malignancy (%)
Mental Health - People who have little interest in doing things (%)
Mental Health - People feeling down, depressed, or hopeless (%)
Mental Health - People who have trouble sleeping or sleeping too much (%)
Mental Health - People feeling tired or having little energy (%)
Mental Health - People with poor appetite or overeating (%)
Mental Health - People feeling bad about themself (%)
Mental Health - People who have trouble concentrating on things (%)
Mental Health - People moving or speaking slowly or too fast (%)
Mental Health - People having thoughts they would be better off dead (%)
Oral Health - Average years since last visit a dentist
Oral Health - People embarrassed because of mouth (%)
Oral Health - People with gum disease (%)
Oral Health - General health of teeth and gums (%)
Oral Health - Average days a week using dental floss/device
Oral Health - Average days a week using mouthwash for dental problem
Oral Health - Average number of teeth
Pesticide Use - Households using pesticides to control insects (%)
Pesticide Use - Households using pesticides to kill weeds (%)
Physical Activity - People doing vigorous-intensity work activities (%)
Physical Activity - People doing moderate-intensity work activities (%)
Physical Activity - People walking or bicycling (%)
Physical Activity - People doing vigorous-intensity recreational activities (%)
Physical Activity - People doing moderate-intensity recreational activities (%)
Physical Activity - Average hours a day doing sedentary activities
Physical Activity - Average hours a day watching TV or videos
Physical Activity - Average hours a day using computer
Physical Functioning - People having limitations keeping them from working (%)
Physical Functioning - People limited in amount of work they can do (%)
Physical Functioning - People that need special equipment to walk (%)
Physical Functioning - People experiencing confusion/memory problems (%)
Physical Functioning - People requiring special healthcare equipment (%)
Prescription Medications - Average number of prescription medicines taking
Preventive Aspirin Use - Adults 40+ taking low-dose aspirin (%)
Reproductive Health - Vaginal deliveries (%)
Reproductive Health - Cesarean deliveries (%)
Reproductive Health - Deliveries resulted in a live birth (%)
Reproductive Health - Pregnancies resulted in a delivery (%)
Reproductive Health - Women breastfeeding newborns (%)
Reproductive Health - Women that had a hysterectomy (%)
Reproductive Health - Women that had both ovaries removed (%)
Reproductive Health - Women that have ever taken birth control pills (%)
Reproductive Health - Women taking birth control pills (%)
Reproductive Health - Women that have ever used Depo-Provera or injectables (%)
Reproductive Health - Women that have ever used female hormones (%)
Sexual Behavior - People 18+ that ever had sex (vaginal, anal, or oral) (%)
Sexual Behavior - Males 18+ that ever had vaginal sex with a woman (%)
Sexual Behavior - Males 18+ that ever performed oral sex on a woman (%)
Sexual Behavior - Males 18+ that ever had anal sex with a woman (%)
Sexual Behavior - Males 18+ that ever had any sex with a man (%)
Sexual Behavior - Females 18+ that ever had vaginal sex with a man (%)
Sexual Behavior - Females 18+ that ever performed oral sex on a man (%)
Sexual Behavior - Females 18+ that ever had anal sex with a man (%)
Sexual Behavior - Females 18+ that ever had any kind of sex with a woman (%)
Sexual Behavior - Average age people first had sex
Sexual Behavior - Average number of female sex partners in lifetime (males 18+)
Sexual Behavior - Average number of female vaginal sex partners in lifetime (males 18+)
Sexual Behavior - Average age people first performed oral sex on a woman (18+)
Sexual Behavior - Average number of woman performed oral sex on in lifetime (18+)
Sexual Behavior - Average number of male sex partners in lifetime (males 18+)
Sexual Behavior - Average number of male anal sex partners in lifetime (males 18+)
Sexual Behavior - Average age people first performed oral sex on a man (18+)
Sexual Behavior - Average number of male oral sex partners in lifetime (18+)
Sexual Behavior - People using protection when performing oral sex (%)
Sexual Behavior - Average number of times people have vaginal or anal sex a year
Sexual Behavior - People having sex without condom (%)
Sexual Behavior - Average number of male sex partners in lifetime (females 18+)
Sexual Behavior - Average number of male vaginal sex partners in lifetime (females 18+)
Sexual Behavior - Average number of female sex partners in lifetime (females 18+)
Sexual Behavior - Circumcised males 18+ (%)
Sleep Disorders - Average hours sleeping at night
Sleep Disorders - People that has trouble sleeping (%)
Smoking-Cigarette Use - People smoking cigarettes (%)
Taste & Smell - People 40+ having problems with smell (%)
Taste & Smell - People 40+ having problems with taste (%)
Taste & Smell - People 40+ that ever had wisdom teeth removed (%)
Taste & Smell - People 40+ that ever had tonsils teeth removed (%)
Taste & Smell - People 40+ that ever had a loss of consciousness because of a head injury (%)
Taste & Smell - People 40+ that ever had a broken nose or other serious injury to face or skull (%)
Taste & Smell - People 40+ that ever had two or more sinus infections (%)
Weight - Average height (inches)
Weight - Average weight (pounds)
Weight - Average BMI
Weight - People that are obese (%)
Weight - People that ever were obese (%)
Weight - People trying to lose weight (%)
Urban population: 21,891
Rural population: 5,410
Estimated median house/condo value in 2022: $267,994
75092:
$267,994Texas:
$275,400
According to our research of Texas and other state lists, there were 39 registered sex offenders living in 75092 zip code as of April 27, 2024 . The ratio of all residents to sex offenders in zip code 75092 is 615 to 1.The ratio of registered sex offenders to all residents in this zip code is lower than the state average.
Median resident age: This zip code:
41.8 yearsTexas median age:
35.6 years
Average household size: This zip code:
2.2 peopleTexas:
2.6 people
Averages for the 2020 tax year for zip code 75092, filed in 2021:
Average Adjusted Gross Income (AGI) in 2020: $64,748 (Individual Income Tax Returns) Here:
$64,748State:
$77,054
Salary/wage: $55,117 (reported on 82.7% of returns )Here:
$55,117State:
$62,766
(% of AGI for various income ranges: 1192.8% for AGIs below $25k , 3562.0% for AGIs $25k-50k , 6288.7% for AGIs $50k-75k , 9076.9% for AGIs $75k-100k , 17214.5% for AGIs $100k-200k , 76768.6% for AGIs over 200k ) Taxable interest for individuals: $2,121 (reported on 21.9% of returns )This zip code:
$2,121Texas:
$2,665
(% of AGI for various income ranges: 14.5% for AGIs below $25k , 16.5% for AGIs $25k-50k , 51.7% for AGIs $50k-75k , 56.1% for AGIs $75k-100k , 151.3% for AGIs $100k-200k , 1652.1% for AGIs over 200k ) Ordinary dividends: $6,662 (reported on 14.2% of returns )(% of AGI for various income ranges: 19.9% for AGIs below $25k , 27.1% for AGIs $25k-50k , 73.2% for AGIs $50k-75k , 141.1% for AGIs $75k-100k , 374.8% for AGIs $100k-200k , 3444.3% for AGIs over 200k ) Net capital gain/loss in AGI: +$16,127 (reported on 13.5% of returns )Here:
+$16,127State:
+$39,590
(% of AGI for various income ranges: 13.3% for AGIs below $25k , 23.9% for AGIs $25k-50k , 79.9% for AGIs $50k-75k , 94.8% for AGIs $75k-100k , 610.0% for AGIs $100k-200k , 13494.3% for AGIs over 200k ) Profit/loss from business: +$12,692 (reported on 16.2% of returns )Here:
+$12,692State:
+$10,888
(% of AGI for various income ranges: 100.0% for AGIs below $25k , 98.6% for AGIs $25k-50k , 171.1% for AGIs $50k-75k , 211.4% for AGIs $75k-100k , 675.3% for AGIs $100k-200k , 6755.7% for AGIs over 200k ) Taxable individual retirement arrangement distribution: $22,859 (reported on 8.6% of returns )75092:
$22,859Texas:
$24,740
(% of AGI for various income ranges: 51.5% for AGIs below $25k , 86.1% for AGIs $25k-50k , 250.5% for AGIs $50k-75k , 359.3% for AGIs $75k-100k , 938.9% for AGIs $100k-200k , 3850.7% for AGIs over 200k ) Self-employed (Keogh) retirement plans: $26,500 (reported on 0.2% of returns )75092:
$26,500Texas:
$29,298
(% of AGI for various income ranges: 84.6% for AGIs $100k-200k ) Total itemized deductions: $39,281 (reported on 6.5% of returns )Here:
$39,281State:
$40,428
(% of AGI for various income ranges: 34.5% for AGIs below $25k , 89.9% for AGIs $25k-50k , 238.5% for AGIs $50k-75k , 463.7% for AGIs $75k-100k , 857.3% for AGIs $100k-200k , 9508.6% for AGIs over 200k ) Charity contributions: $14,791 (reported on 5.3% of returns )Here:
$14,791State:
$18,201
(% of AGI for various income ranges: 3.2% for AGIs below $25k , 9.8% for AGIs $25k-50k , 49.9% for AGIs $50k-75k , 98.7% for AGIs $75k-100k , 261.7% for AGIs $100k-200k , 3904.3% for AGIs over 200k ) Taxes paid: $6,740 (reported on 6.4% of returns )(% of AGI for various income ranges: 5.1% for AGIs below $25k , 15.0% for AGIs $25k-50k , 48.3% for AGIs $50k-75k , 91.6% for AGIs $75k-100k , 181.7% for AGIs $100k-200k , 1175.7% for AGIs over 200k ) Earned income credit: $2,415 (reported on 15.8% of returns )(% of AGI for various income ranges: 93.0% for AGIs below $25k , 67.0% for AGIs $25k-50k , 1.7% for AGIs $50k-75k ) Percentage of individuals using paid preparers for their 2020 taxes: 92.4%(% for various income ranges: 92.2% for AGIs below $25k , 93.6% for AGIs $25k-50k , 92.0% for AGIs $50k-75k , 91.7% for AGIs $75k-100k , 91.5% for AGIs $100k-200k , 91.1% for AGIs over 200k )
Averages for the 2012 tax year for zip code 75092, filed in 2013:
Average Adjusted Gross Income (AGI) in 2012: $55,579 (Individual Income Tax Returns) Here:
$55,579State:
$65,384
Salary/wage: $46,825 (reported on 82.6% of returns )Here:
$46,825State:
$52,524
(% of AGI for various income ranges: 77.0% for AGIs below $25k , 79.9% for AGIs $25k-50k , 74.0% for AGIs $50k-75k , 72.0% for AGIs $75k-100k , 72.2% for AGIs $100k-200k , 52.4% for AGIs over 200k ) Taxable interest for individuals: $2,144 (reported on 27.5% of returns )This zip code:
$2,144Texas:
$2,372
(% of AGI for various income ranges: 1.1% for AGIs below $25k , 0.7% for AGIs $25k-50k , 0.8% for AGIs $50k-75k , 0.9% for AGIs $75k-100k , 1.1% for AGIs $100k-200k , 1.5% for AGIs over 200k ) Ordinary dividends: $5,669 (reported on 16.7% of returns )(% of AGI for various income ranges: 1.7% for AGIs below $25k , 0.6% for AGIs $25k-50k , 1.5% for AGIs $50k-75k , 1.1% for AGIs $75k-100k , 1.6% for AGIs $100k-200k , 3.1% for AGIs over 200k ) Net capital gain/loss in AGI: +$9,172 (reported on 14.5% of returns )Here:
+$9,172State:
+$35,319
(% of AGI for various income ranges: 0.4% for AGIs $50k-75k , 1.0% for AGIs $75k-100k , 1.9% for AGIs $100k-200k , 7.6% for AGIs over 200k ) Profit/loss from business: +$13,579 (reported on 15.8% of returns )Here:
+$13,579State:
+$13,732
(% of AGI for various income ranges: 5.8% for AGIs below $25k , 2.7% for AGIs $25k-50k , 2.5% for AGIs $50k-75k , 3.0% for AGIs $75k-100k , 3.4% for AGIs $100k-200k , 5.7% for AGIs over 200k ) Taxable individual retirement arrangement distribution: $20,394 (reported on 11.8% of returns )75092:
$20,394Texas:
$19,511
(% of AGI for various income ranges: 3.5% for AGIs below $25k , 3.3% for AGIs $25k-50k , 3.8% for AGIs $50k-75k , 4.4% for AGIs $75k-100k , 5.4% for AGIs $100k-200k , 4.8% for AGIs over 200k ) Self-employment retirement plans: $27,000 (reported on 0.4% of returns )75092:
$27,000Texas:
$23,938
Total itemized deductions: $22,592 (19% of AGI, reported on 23.3% of returns )Here:
$22,592State:
$24,724
Here:
19.1% of AGIState:
15.9% of AGI
(% of AGI for various income ranges: 7.7% for AGIs below $25k , 8.1% for AGIs $25k-50k , 9.7% for AGIs $50k-75k , 9.4% for AGIs $75k-100k , 11.1% for AGIs $100k-200k , 9.4% for AGIs over 200k ) Charity contributions: $6,942 (reported on 18.3% of returns )(% of AGI for various income ranges: 0.7% for AGIs below $25k , 1.2% for AGIs $25k-50k , 1.8% for AGIs $50k-75k , 2.3% for AGIs $75k-100k , 3.0% for AGIs $100k-200k , 3.4% for AGIs over 200k ) Taxes paid: $5,148 (reported on 22.9% of returns )(% of AGI for various income ranges: 1.2% for AGIs below $25k , 1.5% for AGIs $25k-50k , 2.0% for AGIs $50k-75k , 2.3% for AGIs $75k-100k , 2.8% for AGIs $100k-200k , 2.2% for AGIs over 200k ) Earned income credit: $2,331 (reported on 19.2% of returns )(% of AGI for various income ranges: 6.7% for AGIs below $25k , 1.1% for AGIs $25k-50k ) Percentage of individuals using paid preparers for their 2012 taxes: 49.4%(% for various income ranges: 45.2% for AGIs below $25k , 47.5% for AGIs $25k-50k , 50.7% for AGIs $50k-75k , 52.4% for AGIs $75k-100k , 58.5% for AGIs $100k-200k , 79.3% for AGIs over 200k )
Averages for the 2004 tax year for zip code 75092, filed in 2005:
Average Adjusted Gross Income (AGI) in 2004: $46,820 (Individual Income Tax Returns) Here:
$46,820State:
$47,881
Salary/wage: $41,967 (reported on 81.3% of returns )Here:
$41,967State:
$41,947
(% of AGI for various income ranges: 131.9% for AGIs below $10k , 74.3% for AGIs $10k-25k , 78.8% for AGIs $25k-50k , 77.1% for AGIs $50k-75k , 76.3% for AGIs $75k-100k , 63.7% for AGIs over 100k ) Taxable interest for individuals: $2,294 (reported on 42.2% of returns )This zip code:
$2,294Texas:
$2,255
(% of AGI for various income ranges: 9.4% for AGIs below $10k , 3.1% for AGIs $10k-25k , 1.9% for AGIs $25k-50k , 1.6% for AGIs $50k-75k , 1.6% for AGIs $75k-100k , 2.1% for AGIs over 100k ) Taxable dividends: $3,029 (reported on 23.5% of returns )(% of AGI for various income ranges: 6.7% for AGIs below $10k , 1.6% for AGIs $10k-25k , 1.0% for AGIs $25k-50k , 1.0% for AGIs $50k-75k , 0.9% for AGIs $75k-100k , 2.1% for AGIs over 100k ) Net capital gain/loss: +$10,198 (reported on 20.2% of returns )Here:
+$10,198State:
+$16,110
(% of AGI for various income ranges: 0.9% for AGIs below $10k , 0.4% for AGIs $10k-25k , 0.5% for AGIs $25k-50k , 1.1% for AGIs $50k-75k , 1.5% for AGIs $75k-100k , 10.5% for AGIs over 100k ) Profit/loss from business: +$11,581 (reported on 16.6% of returns )Here:
+$11,581State:
+$11,013
(% of AGI for various income ranges: 10.6% for AGIs below $10k , 3.8% for AGIs $10k-25k , 2.3% for AGIs $25k-50k , 2.2% for AGIs $50k-75k , 2.9% for AGIs $75k-100k , 6.5% for AGIs over 100k ) IRA payment deduction: $3,109 (reported on 2.4% of returns )(% of AGI for various income ranges: 0.1% for AGIs $10k-25k , 0.2% for AGIs $25k-50k , 0.1% for AGIs $50k-75k , 0.1% for AGIs $75k-100k , 0.1% for AGIs over 100k ) Self-employed pension: $15,562 (reported on 0.6% of returns )Here:
$15,562Texas:
$16,401
Total itemized deductions: $18,925 (21% of AGI, reported on 26.9% of returns )Here:
$18,925State:
$19,631
Here:
20.7% of AGIState:
18.9% of AGI
(% of AGI for various income ranges: 20.2% for AGIs below $10k , 7.7% for AGIs $10k-25k , 9.1% for AGIs $25k-50k , 10.6% for AGIs $50k-75k , 12.8% for AGIs $75k-100k , 11.6% for AGIs over 100k ) Charity contributions deductions: $5,681 (6% of AGI, reported on 22.8% of returns )Here:
5.8% of AGIState:
4.2% of AGI
(% of AGI for various income ranges: 1.1% for AGIs below $10k , 1.2% for AGIs $10k-25k , 1.5% for AGIs $25k-50k , 2.0% for AGIs $50k-75k , 2.9% for AGIs $75k-100k , 4.2% for AGIs over 100k ) Total tax: $7,463 (reported on 75.5% of returns )(% of AGI for various income ranges: 4.5% for AGIs below $10k , 3.9% for AGIs $10k-25k , 6.8% for AGIs $25k-50k , 9.0% for AGIs $50k-75k , 10.6% for AGIs $75k-100k , 19.2% for AGIs over 100k ) Earned income credit: $1,752 (reported on 15.5% of returns )Percentage of individuals using paid preparers for their 2004 taxes: 55.7%(% for various income ranges: 47.4% for AGIs below $10k , 57.5% for AGIs $10k-25k , 56.5% for AGIs $25k-50k , 57.0% for AGIs $50k-75k , 52.4% for AGIs $75k-100k , 68.4% for AGIs over 100k )
Estimated median household income in 2022: This zip code:
$62,096Texas:
$72,284
Nearest zip codes: 76268 ,
75459 ,
75076 ,
75020 ,
76264 ,
75090 .
Southmayd Zip Code Map
Percentage of family households: This zip code:
40.8%Texas:
50.5%
Percentage of households with unmarried partners: This zip code:
3.9%Texas:
48.7%
Likely homosexual households (counted as self-reported same-sex unmarried-partner households)
Lesbian couples: 0.1% of all households Gay men: 0.0% of all households
Household received Food Stamps/SNAP in the past 12 months: 919Household did not receive Food Stamps/SNAP in the past 12 months: 11,312
Women who had a birth in the past 12 months: 409 (208 now married , 196 unmarried) Women who did not have a birth in the past 12 months: 5,811 (2,403 now married , 3,412 unmarried)
Housing units in zip code 75092 with a mortgage: 3,671 (13
second mortgage , 14
both second mortgage and home equity loan )
Houses without a mortgage: 29
Median monthly owner costs for units with a mortgage: $1,813
Median monthly owner costs for units without a mortgage: $598
Residents with income below the poverty level in 2022:
This zip code:
8.6%Whole state:
14.0%
Residents with income below 50% of the poverty level in 2022:
This zip code:
5.9%Whole state:
7.4%
Median number of rooms in houses and condos: Median number of rooms in apartments: Notable locations in this zip code not listed on our city pages
Click to draw/clear zip code borders Notable locations in zip code 75092: (A) , Sadler Volunteer Fire Department (B) , Woodman Circle Home (C) , Chase at Texas Lifestar Air Medical (D) , Texoma Medical Center - Behavioral Health Center (E) , Captain Noble Allan Birge House (F) . Display/hide their locations on the map
Churches in zip code 75092 include: (A) , Harvest Time Assembly of God Church (B) , First Temple Assembly of God Church (C) , Fairview Baptist Church (D) , Friendship Church (E) , Hagerman Church (F) , Kendall Chapel (G) , Kerr Chapel (H) , Greater Life Community Church (I) . Display/hide their locations on the map
Cemeteries: (1) , Kersey Cemetery (2) , West Hill Cemetery (3) , Christian Chapel Cemetery (4) . Display/hide their locations on the map
Lakes and reservoirs: (A) , Deaver Pond (B) , Taylor Pond (C) , Old Goose Pond (D) , Elm Pond (E) , Sherman Country Club Lake (F) , Soil Conservation Service Site 10a Reservoir (G) . Display/hide their locations on the map
Streams, rivers, and creeks: (A) , Sand Creek (B) , Myer Branch (C) , Martin Branch (D) , Harris Creek (E) , Elba Creek (F) . Display/hide their locations on the map
Parks in zip code 75092 include: (1) , Birge Park (2) , Hagerman National Wildlife Refuge (3) , Fairview Park (4) . Display/hide their locations on the map
Year house built (houses)
54 2020 or later1,784 2010 to 20191,889 2000 to 20091,897 1990 to 19991,898 1980 to 19891,386 1970 to 19791,755 1960 to 19691,064 1950 to 1959238 1940 to 1949574 1939 or earlier
Zip code 75092 household income distribution in 2022 374 Less than $10,000494 $10,000 to $14,999295 $15,000 to $19,999270 $20,000 to $24,999413 $25,000 to $29,999602 $30,000 to $34,999978 $35,000 to $39,999694 $40,000 to $44,999654 $45,000 to $49,9991,022 $50,000 to $59,9991,852 $60,000 to $74,9991,358 $75,000 to $99,9991,196 $100,000 to $124,999692 $125,000 to $149,999590 $150,000 to $199,999788 $200,000 or moreEstimate of home value of owner-occupied houses/condos in 2022 in zip code 75092 32 Less than $10,00031 $10,000 to $14,99942 $15,000 to $19,99933 $20,000 to $24,99973 $25,000 to $29,99934 $30,000 to $34,9994 $35,000 to $39,99951 $40,000 to $49,999134 $50,000 to $59,99957 $60,000 to $69,99956 $70,000 to $79,99966 $80,000 to $89,99948 $90,000 to $99,999578 $100,000 to $124,999217 $125,000 to $149,999255 $150,000 to $174,999448 $175,000 to $199,9991,001 $200,000 to $249,999845 $250,000 to $299,9991,368 $300,000 to $399,999588 $400,000 to $499,999414 $500,000 to $749,99970 $750,000 to $999,99986 $1,000,000 to $1,499,99935 $2,000,000 or moreRent paid by renters in 2022 in zip code 75092 11 Less than $10014 $150 to $19947 $200 to $2492 $250 to $2998 $400 to $4494 $450 to $49964 $500 to $54923 $550 to $599104 $600 to $649253 $650 to $699305 $700 to $749538 $750 to $799580 $800 to $8991,083 $900 to $9991,162 $1,000 to $1,249302 $1,250 to $1,499611 $1,500 to $1,999120 $2,000 to $2,49931 $3,500 or more72 No cash rent
Median gross rent in 2022: $1,179.
Median price asked for vacant for-sale houses and condos in 2022: $235,426.
Estimated median house (or condo) value in 2022 for: White Non-Hispanic householders: $275,229Black or African American householders: $306,279American Indian or Alaska Native householders: $241,164Asian householders: $464,844Some other race householders: $259,252Two or more races householders: $171,528Hispanic or Latino householders: $261,663Estimated median house or condo value in 2022: $267,994
75092:
$267,994Texas:
$275,400
Lower value quartile - upper value quartile: $163,675 - $385,214
Housing units in structures:
One, detached: 8,013One, attached: 207Two: 3133 or 4: 5645 to 9: 1,20810 to 19: 1,02220 to 49: 25050 or more: 791Mobile homes: 632Boats, RVs, vans, etc.: 13Unemployment : 2.3%
Means of transportation to work in zip code 75092 75.3% 10,924 Drove a car alone10.7% 1,547 Carpooled0.1% 20 Bus or trolley bus0.3% 48 Motorcycle0.0% 7 Bicycle0.4% 54 Walked0.8% 123 Other means11.5% 1,663 Worked at homeTravel time to work (commute) in zip code 75092 280 Less than 5 minutes2,291 5 to 9 minutes3,318 10 to 14 minutes2,303 15 to 19 minutes1,169 20 to 24 minutes320 25 to 29 minutes745 30 to 34 minutes242 35 to 39 minutes481 40 to 44 minutes628 45 to 59 minutes546 60 to 89 minutes402 90 or more minutes
Percentage of zip code residents living and working in this county: 83.4%
Household type by relationship:
Households: 27,302
Male householders: 6,068 (1,574 living alone ), Female householders: 6,192 (2,425 living alone )5,905 spouses (5,762 opposite-sex spouses ), 604 unmarried partners , (604 opposite-sex unmarried partners ), 6,816 children (6,143 natural , 310 adopted , 366 stepchildren ), 203 grandchildren , 230 brothers or sisters , 390 parents , 0 foster children , 137 other relatives , 782 non-relatives In group quarters: 105 (-1 institutionalized population )
Size of family households: 4,368 2-persons , 1,585 3-persons , 874 4-persons , 471 5-persons , 255 6-persons , 9 7-or-more-persons
Size of nonfamily households: 3,997 1-person , 650 2-persons , 122 3-persons , 1 4-persons
3,620 married couples with children. single-parent households (250 men , 1,106 women ).
91.7% of residents of 75092 zip code speak English at home. of residents speak Spanish at home (78% very well, 17% well, 4% not well ).of residents speak other Indo-European language at home (79% very well, 21% well ).of residents speak Asian or Pacific Island language at home (4% very well, 42% well, 22% not well, 32% not at all ).
Foreign born population: 1,709 (6.3%)
(39.1%
of them are naturalized citizens )
This zip code:
6.3%Whole state:
17.2%
24% Honduras 9% Bhutan 6% Japan 5% Kazakhstan 4% Democratic Republic of Congo (Zaire) 4% France 4% Croatia 11% English 10% American 8% German 7% Irish 5% European 4% Scottish 2% Italian
Year of entry for the foreign-born population
1,103 2010 or later 375 2000 to 2009 245 1990 to 1999 320 Before 1990
There are
264 Other Medical Specialists in Zip Code 75092.
Housing units lacking complete kitchen facilities: 1.0%
58.9% Electricity 36.6% Utility gas 3.9% Bottled, tank, or LP gas
Place of birth for U.S.-born residents:
This state: 16,958Northeast: 572Midwest: 2,211South: 3,050West: 2,581
45% of the 75092 zip code residents lived in the same house 5 years ago.
Out of people who lived in different houses, 60% lived in this county.
Out of people who lived in different counties, 50% lived in Texas.
81% of the 75092 zip code residents lived in the same house 1 year ago.
Out of people who lived in different houses, 54% moved from this county.
Out of people who lived in different houses, 26% moved from different county within same state.
Out of people who lived in different houses, 16% moved from different state.
Out of people who lived in different houses, 2% moved from abroad.
Private vs. public school enrollment:
Students in private schools in grades 1 to 8 (elementary and middle school): 39
Students in private schools in grades 9 to 12 (high school): 63
Students in private undergraduate colleges: 110
Occupation by median earnings in the past 12 months ($)
110,814 Legal occupations 84,295 Health diagnosing and treating practitioners and other technical occupations 83,188 Business and financial operations occupations 75,406 Fire fighting and prevention, and other protective service workers including supervisors 67,862 Architecture and engineering occupations 66,528 Installation, maintenance, and repair occupations
Companies with federal contracts located in this zip code:
STARR AIRCRAFT PRODUCTS, INC (5236 N HIGHWAY 1417 in SHERMAN, TX; small business) in 17 contracts from 2000 to 2006
Contracts for Miscellaneous Aircraft Accessories and Components, Hardware, Commercial by Defense Logistics Agency, NavySigned by year: 2000: $106,153; 2001: $0; 2002: $0; 2003: $0; 2004: $16,220; 2005: $57,088; 2006: $50,597.
Biggest contracts: with Defense Logistics Agency for Miscellaneous Aircraft Accessories and Components. Signed on 2000-08-07. Completion date: 2000-11-05.
, same as above. Signed on 2000-09-27. Completion date: 2001-01-19.
, same as above. Signed on 2005-07-15. Completion date: 2006-02-23.
, same as above. Signed on 2006-05-17. Completion date: 2006-12-13.
MARY D MONTGOMERY (617 NORTH MCKOWN in SHERMAN, TX; small business) in 8 contracts from 2004 to 2006
Contracts for Operation of Government-Owned Facilities -- Recreation Facilities (Non-Building) by U.S. Army Corps of Engineers - civil program financing only, ArmySigned by year: 2000: $0; 2001: $0; 2002: $0; 2003: $0; 2004: $12,726; 2005: $11,918; 2006: $5,505.
Biggest contracts: with U.S. Army Corps of Engineers - civil program financing only for Operation of Government-Owned Facilities -- Recreation Facilities (Non-Building). Taking place in AR. Signed on 2005-02-16. Completion date: 2004-03-12.
with Army for Operation of Government-Owned Facilities -- Recreation Facilities (Non-Building). Taking place in AR. Signed on 2005-02-16. Completion date: 2004-03-12.
with U.S. Army Corps of Engineers - civil program financing only for Operation of Government-Owned Facilities -- Recreation Facilities (Non-Building). Taking place in AR. Signed on 2004-02-04. Completion date: 2004-03-12.
with Army for Operation of Government-Owned Facilities -- Recreation Facilities (Non-Building). Taking place in AR. Signed on 2004-02-04. Completion date: 2004-03-12.
TACTICAL TANKS, LLC (1162 PLAINVIEW RD in SHERMAN, TX; small business)
$25,900 with Army for Vehicular Cab, Body, and Frame Structural Components. Taking place in GA. Signed on 2004-09-27. Completion date: 2004-10-27.
Top industries in this zip code by the number of employees in 2005:
Health Care and Social Assistance: General Medical and Surgical Hospitals (over 1000 employees: 1 establishment)Health Care and Social Assistance: Home Health Care Services (250-499: 1, 20-49: 1, 5-9: 1, 1-4: 1)Health Care and Social Assistance: Offices of Physicians (except Mental Health Specialists) (10-19: 10, 5-9: 11, 1-4: 33)Accommodation and Food Services: Full-Service Restaurants (50-99: 3, 20-49: 1, 10-19: 2, 5-9: 1)Accommodation and Food Services: Limited-Service Restaurants (50-99: 1, 20-49: 3, 10-19: 4)Health Care and Social Assistance: Outpatient Mental Health and Substance Abuse Centers (100-249: 1, 1-4: 1)Construction: Power and Communication Line and Related Structures Construction (100-249: 1)Wholesale Trade: Metal Service Centers and Other Metal Merchant Wholesalers (100-249: 1)
People in group quarters in 2010:
73 people in nursing facilities/skilled-nursing facilities
14 people in other noninstitutional facilities
12 people in group homes intended for adults
People in group quarters in 2000:
408 people in nursing homes
62 people in schools, hospitals, or wards for the intellectually disabled
32 people in orthopedic wards and institutions for the physically handicapped
12 people in other group homes
9 people in other nonhousehold living situations
5 people in other noninstitutional group quarters
Fatal accident statistics in 2014:
Fatal accident count: 4Vehicles involved in fatal accidents: 5Fatal accidents caused by drunken drivers: 2Fatalities: 4Persons involved in fatal accidents: 7Pedestrians involved in fatal accidents: 0
Fatal accident statistics in 2013:
Fatal accident count: 4Vehicles involved in fatal accidents: 5Fatal accidents caused by drunken drivers: 0Fatalities: 4Persons involved in fatal accidents: 5Pedestrians involved in fatal accidents: 1
Home Mortgage Disclosure Act Aggregated Statistics For Year 2009(Based on 4 full and 10 partial tracts) A) FHA, FSA/RHS & VA B) Conventional C) Refinancings D) Home Improvement Loans E) Loans on Dwellings For 5+ Families F) Non-occupant Loans on G) Loans On Manufactured Number Average Value Number Average Value Number Average Value Number Average Value Number Average Value Number Average Value Number Average Value
LOANS ORIGINATED 180 $114,838 224 $110,098 410 $138,981 42 $42,305 1 $4,046,480 102 $74,050 18 $40,629 APPLICATIONS APPROVED, NOT ACCEPTED 6 $125,582 21 $71,980 45 $119,600 7 $139,074 0 $0 16 $63,197 5 $52,486 APPLICATIONS DENIED 17 $127,567 46 $104,370 171 $130,591 36 $49,598 2 $839,580 9 $45,229 19 $52,584 APPLICATIONS WITHDRAWN 29 $105,885 24 $124,520 102 $145,815 8 $23,885 0 $0 6 $94,493 1 $36,620 FILES CLOSED FOR INCOMPLETENESS 7 $84,154 2 $102,495 38 $161,848 2 $15,530 0 $0 2 $86,545 4 $83,018
Aggregated Statistics For Year 2008(Based on 4 full and 10 partial tracts) A) FHA, FSA/RHS & VA B) Conventional C) Refinancings D) Home Improvement Loans E) Loans on Dwellings For 5+ Families F) Non-occupant Loans on G) Loans On Manufactured Number Average Value Number Average Value Number Average Value Number Average Value Number Average Value Number Average Value Number Average Value
LOANS ORIGINATED 199 $110,558 326 $124,849 271 $151,102 74 $52,442 6 $716,550 177 $112,268 19 $67,354 APPLICATIONS APPROVED, NOT ACCEPTED 6 $111,283 39 $128,943 34 $109,245 17 $36,925 0 $0 14 $69,211 3 $39,033 APPLICATIONS DENIED 21 $91,788 77 $116,903 226 $109,020 54 $50,579 2 $2,748,625 23 $91,513 27 $62,269 APPLICATIONS WITHDRAWN 24 $83,106 41 $123,529 115 $121,511 2 $137,835 0 $0 14 $81,451 4 $59,755 FILES CLOSED FOR INCOMPLETENESS 4 $73,522 5 $77,050 14 $122,611 2 $45,620 0 $0 0 $0 1 $96,100
Aggregated Statistics For Year 2007(Based on 4 full and 10 partial tracts) A) FHA, FSA/RHS & VA B) Conventional C) Refinancings D) Home Improvement Loans E) Loans on Dwellings For 5+ Families F) Non-occupant Loans on G) Loans On Manufactured Number Average Value Number Average Value Number Average Value Number Average Value Number Average Value Number Average Value Number Average Value
LOANS ORIGINATED 131 $100,549 537 $112,923 234 $117,073 107 $43,837 10 $1,392,496 172 $80,808 31 $70,846 APPLICATIONS APPROVED, NOT ACCEPTED 13 $111,856 71 $93,026 74 $117,012 33 $45,361 0 $0 13 $71,885 12 $59,817 APPLICATIONS DENIED 11 $97,872 93 $104,931 277 $118,145 98 $46,346 4 $188,275 40 $73,296 16 $86,565 APPLICATIONS WITHDRAWN 24 $91,738 43 $95,805 124 $105,030 15 $81,926 2 $686,380 26 $60,328 8 $79,699 FILES CLOSED FOR INCOMPLETENESS 2 $83,480 6 $66,637 30 $160,383 0 $0 0 $0 2 $298,845 0 $0
Aggregated Statistics For Year 2006(Based on 4 full and 10 partial tracts) A) FHA, FSA/RHS & VA B) Conventional C) Refinancings D) Home Improvement Loans E) Loans on Dwellings For 5+ Families F) Non-occupant Loans on G) Loans On Manufactured Number Average Value Number Average Value Number Average Value Number Average Value Number Average Value Number Average Value Number Average Value
LOANS ORIGINATED 171 $95,711 795 $89,554 343 $119,284 105 $50,754 3 $1,256,300 307 $76,231 44 $63,275 APPLICATIONS APPROVED, NOT ACCEPTED 4 $104,388 98 $79,956 60 $90,715 19 $33,901 0 $0 29 $61,936 17 $41,832 APPLICATIONS DENIED 4 $116,035 130 $87,258 331 $105,570 112 $44,690 0 $0 48 $82,333 35 $55,709 APPLICATIONS WITHDRAWN 18 $97,151 135 $90,464 219 $107,496 18 $73,879 0 $0 39 $67,330 0 $0 FILES CLOSED FOR INCOMPLETENESS 2 $117,695 17 $102,785 75 $122,069 1 $91,300 0 $0 6 $46,858 0 $0
Aggregated Statistics For Year 2005(Based on 4 full and 10 partial tracts) A) FHA, FSA/RHS & VA B) Conventional C) Refinancings D) Home Improvement Loans E) Loans on Dwellings For 5+ Families F) Non-occupant Loans on G) Loans On Manufactured Number Average Value Number Average Value Number Average Value Number Average Value Number Average Value Number Average Value Number Average Value
LOANS ORIGINATED 140 $95,411 766 $91,391 452 $110,123 77 $55,809 5 $1,044,842 281 $73,043 39 $60,452 APPLICATIONS APPROVED, NOT ACCEPTED 4 $102,615 85 $85,824 90 $104,482 19 $49,267 0 $0 26 $67,314 18 $45,644 APPLICATIONS DENIED 15 $86,384 162 $71,448 423 $94,935 113 $33,236 2 $2,118,940 54 $60,511 62 $59,271 APPLICATIONS WITHDRAWN 14 $109,005 92 $89,068 191 $132,304 47 $149,855 2 $1,079,420 22 $100,825 3 $39,450 FILES CLOSED FOR INCOMPLETENESS 3 $89,653 25 $123,493 154 $109,203 0 $0 0 $0 12 $88,038 0 $0
Aggregated Statistics For Year 2004(Based on 4 full and 10 partial tracts) A) FHA, FSA/RHS & VA B) Conventional C) Refinancings D) Home Improvement Loans E) Loans on Dwellings For 5+ Families F) Non-occupant Loans on G) Loans On Manufactured Number Average Value Number Average Value Number Average Value Number Average Value Number Average Value Number Average Value Number Average Value
LOANS ORIGINATED 166 $97,925 669 $89,857 572 $96,491 99 $47,277 12 $2,140,398 164 $67,722 48 $59,586 APPLICATIONS APPROVED, NOT ACCEPTED 12 $96,782 101 $100,449 84 $100,234 28 $19,680 0 $0 29 $82,521 28 $46,134 APPLICATIONS DENIED 21 $106,750 154 $73,755 458 $79,465 135 $33,402 0 $0 63 $88,271 55 $46,427 APPLICATIONS WITHDRAWN 21 $90,142 69 $82,091 283 $98,524 9 $34,902 0 $0 29 $89,166 4 $68,218 FILES CLOSED FOR INCOMPLETENESS 1 $57,010 27 $96,100 190 $114,311 6 $60,213 0 $0 9 $128,349 0 $0
Aggregated Statistics For Year 2003(Based on 4 full and 10 partial tracts) A) FHA, FSA/RHS & VA B) Conventional C) Refinancings D) Home Improvement Loans E) Loans on Dwellings For 5+ Families F) Non-occupant Loans on Number Average Value Number Average Value Number Average Value Number Average Value Number Average Value Number Average Value
LOANS ORIGINATED 224 $103,115 552 $98,163 1,183 $97,719 87 $41,181 1 $5,651,490 180 $69,849 APPLICATIONS APPROVED, NOT ACCEPTED 10 $87,284 56 $94,086 140 $94,756 11 $46,661 0 $0 9 $65,032 APPLICATIONS DENIED 24 $96,376 100 $74,400 517 $91,353 79 $25,020 0 $0 32 $78,768 APPLICATIONS WITHDRAWN 38 $92,796 68 $91,393 292 $101,282 4 $65,568 0 $0 17 $63,620 FILES CLOSED FOR INCOMPLETENESS 0 $0 20 $51,561 49 $127,765 1 $22,530 0 $0 4 $19,335
Aggregated Statistics For Year 2002(Based on 4 full and 6 partial tracts) A) FHA, FSA/RHS & VA B) Conventional C) Refinancings D) Home Improvement Loans E) Loans on Dwellings For 5+ Families F) Non-occupant Loans on Number Average Value Number Average Value Number Average Value Number Average Value Number Average Value Number Average Value
LOANS ORIGINATED 193 $98,615 356 $84,476 417 $82,503 50 $31,340 4 $1,107,228 102 $60,865 APPLICATIONS APPROVED, NOT ACCEPTED 9 $86,388 53 $80,363 73 $82,470 20 $35,858 0 $0 10 $34,082 APPLICATIONS DENIED 16 $90,814 108 $68,105 156 $61,253 52 $19,803 2 $123,905 16 $48,628 APPLICATIONS WITHDRAWN 26 $88,068 74 $83,952 138 $86,790 9 $25,062 0 $0 16 $77,814 FILES CLOSED FOR INCOMPLETENESS 0 $0 13 $88,751 46 $86,675 0 $0 0 $0 1 $67,680
Aggregated Statistics For Year 2001(Based on 4 full and 6 partial tracts) A) FHA, FSA/RHS & VA B) Conventional C) Refinancings D) Home Improvement Loans E) Loans on Dwellings For 5+ Families F) Non-occupant Loans on Number Average Value Number Average Value Number Average Value Number Average Value Number Average Value Number Average Value
LOANS ORIGINATED 140 $84,709 366 $79,060 349 $79,254 83 $27,419 5 $159,770 81 $50,000 APPLICATIONS APPROVED, NOT ACCEPTED 3 $78,060 79 $58,025 45 $42,548 15 $37,619 0 $0 13 $67,605 APPLICATIONS DENIED 8 $50,451 127 $52,239 142 $59,439 65 $18,402 0 $0 8 $20,151 APPLICATIONS WITHDRAWN 35 $77,474 58 $76,684 144 $73,599 13 $25,513 0 $0 6 $73,597 FILES CLOSED FOR INCOMPLETENESS 0 $0 16 $73,586 21 $106,397 0 $0 0 $0 0 $0
Aggregated Statistics For Year 2000(Based on 4 full and 6 partial tracts) A) FHA, FSA/RHS & VA B) Conventional C) Refinancings D) Home Improvement Loans F) Non-occupant Loans on Number Average Value Number Average Value Number Average Value Number Average Value Number Average Value
LOANS ORIGINATED 142 $72,143 390 $82,719 116 $73,495 63 $29,132 64 $68,868 APPLICATIONS APPROVED, NOT ACCEPTED 26 $53,950 93 $50,110 30 $41,074 30 $21,740 6 $34,403 APPLICATIONS DENIED 31 $60,812 233 $53,150 101 $58,749 33 $20,032 21 $44,000 APPLICATIONS WITHDRAWN 15 $73,825 52 $76,930 64 $68,350 7 $16,724 10 $59,724 FILES CLOSED FOR INCOMPLETENESS 6 $61,932 13 $66,385 19 $87,739 0 $0 0 $0
Aggregated Statistics For Year 1999(Based on 2 full and 4 partial tracts) A) FHA, FSA/RHS & VA B) Conventional C) Refinancings D) Home Improvement Loans E) Loans on Dwellings For 5+ Families F) Non-occupant Loans on Number Average Value Number Average Value Number Average Value Number Average Value Number Average Value Number Average Value
LOANS ORIGINATED 85 $74,421 260 $76,474 157 $70,161 61 $22,379 2 $2,520,565 53 $59,565 APPLICATIONS APPROVED, NOT ACCEPTED 1 $39,450 72 $54,495 30 $59,321 17 $14,230 0 $0 7 $52,013 APPLICATIONS DENIED 6 $50,487 213 $55,623 63 $59,650 41 $13,393 1 $231,490 18 $56,624 APPLICATIONS WITHDRAWN 6 $78,543 29 $82,809 61 $61,408 6 $24,055 0 $0 2 $51,040 FILES CLOSED FOR INCOMPLETENESS 0 $0 4 $85,402 18 $70,083 2 $41,625 0 $0 1 $114,060
Private Mortgage Insurance Companies Aggregated Statistics For Year 2009(Based on 4 full and 10 partial tracts) A) Conventional B) Refinancings C) Non-occupant Loans on D) Loans On Manufactured Number Average Value Number Average Value Number Average Value Number Average Value
LOANS ORIGINATED 27 $164,675 22 $188,944 1 $79,970 0 $0 APPLICATIONS APPROVED, NOT ACCEPTED 4 $84,362 10 $184,293 0 $0 1 $23,480 APPLICATIONS DENIED 0 $0 4 $123,990 0 $0 0 $0 APPLICATIONS WITHDRAWN 0 $0 7 $101,860 0 $0 0 $0 FILES CLOSED FOR INCOMPLETENESS 0 $0 0 $0 0 $0 0 $0
Aggregated Statistics For Year 2008(Based on 4 full and 10 partial tracts) A) Conventional B) Refinancings C) Non-occupant Loans on Number Average Value Number Average Value Number Average Value
LOANS ORIGINATED 65 $135,959 24 $184,453 12 $108,752 APPLICATIONS APPROVED, NOT ACCEPTED 23 $130,107 6 $342,698 6 $128,183 APPLICATIONS DENIED 4 $257,578 7 $156,330 8 $225,578 APPLICATIONS WITHDRAWN 0 $0 4 $130,058 0 $0 FILES CLOSED FOR INCOMPLETENESS 1 $235,420 0 $0 0 $0
Aggregated Statistics For Year 2007(Based on 4 full and 10 partial tracts) A) Conventional B) Refinancings C) Non-occupant Loans on Number Average Value Number Average Value Number Average Value
LOANS ORIGINATED 185 $107,419 8 $146,235 18 $76,923 APPLICATIONS APPROVED, NOT ACCEPTED 12 $140,635 4 $181,295 2 $102,165 APPLICATIONS DENIED 2 $126,875 0 $0 0 $0 APPLICATIONS WITHDRAWN 5 $110,590 0 $0 0 $0 FILES CLOSED FOR INCOMPLETENESS 0 $0 0 $0 0 $0
Aggregated Statistics For Year 2006(Based on 4 full and 10 partial tracts) A) Conventional B) Refinancings C) Non-occupant Loans on Number Average Value Number Average Value Number Average Value
LOANS ORIGINATED 107 $106,105 9 $136,562 10 $83,708 APPLICATIONS APPROVED, NOT ACCEPTED 10 $85,960 1 $212,230 6 $58,565 APPLICATIONS DENIED 4 $200,788 0 $0 2 $271,640 APPLICATIONS WITHDRAWN 5 $150,918 0 $0 0 $0 FILES CLOSED FOR INCOMPLETENESS 0 $0 0 $0 0 $0
Aggregated Statistics For Year 2005(Based on 4 full and 10 partial tracts) A) Conventional B) Refinancings C) Non-occupant Loans on D) Loans On Manufactured Number Average Value Number Average Value Number Average Value Number Average Value
LOANS ORIGINATED 130 $104,696 23 $151,197 13 $82,179 4 $39,120 APPLICATIONS APPROVED, NOT ACCEPTED 10 $61,168 13 $131,378 3 $60,973 0 $0 APPLICATIONS DENIED 0 $0 1 $120,520 0 $0 0 $0 APPLICATIONS WITHDRAWN 4 $77,610 0 $0 0 $0 0 $0 FILES CLOSED FOR INCOMPLETENESS 2 $42,785 0 $0 0 $0 0 $0
Aggregated Statistics For Year 2004(Based on 4 full and 10 partial tracts) A) Conventional B) Refinancings C) Non-occupant Loans on Number Average Value Number Average Value Number Average Value
LOANS ORIGINATED 132 $104,101 21 $112,501 28 $74,709 APPLICATIONS APPROVED, NOT ACCEPTED 24 $94,454 8 $129,694 2 $32,090 APPLICATIONS DENIED 4 $55,025 0 $0 2 $35,980 APPLICATIONS WITHDRAWN 19 $94,905 5 $305,552 5 $75,178 FILES CLOSED FOR INCOMPLETENESS 0 $0 0 $0 0 $0
Aggregated Statistics For Year 2003(Based on 4 full and 10 partial tracts) A) Conventional B) Refinancings C) Non-occupant Loans on Number Average Value Number Average Value Number Average Value
LOANS ORIGINATED 141 $99,944 114 $121,118 31 $66,177 APPLICATIONS APPROVED, NOT ACCEPTED 8 $89,502 17 $122,268 2 $118,020 APPLICATIONS DENIED 3 $134,457 0 $0 2 $112,600 APPLICATIONS WITHDRAWN 10 $114,723 7 $95,163 2 $39,800 FILES CLOSED FOR INCOMPLETENESS 0 $0 2 $96,100 0 $0
Aggregated Statistics For Year 2002(Based on 4 full and 6 partial tracts) A) Conventional B) Refinancings C) Non-occupant Loans on Number Average Value Number Average Value Number Average Value
LOANS ORIGINATED 146 $100,547 45 $105,659 16 $82,128 APPLICATIONS APPROVED, NOT ACCEPTED 19 $138,986 8 $92,788 2 $77,655 APPLICATIONS DENIED 5 $96,588 1 $95,740 0 $0 APPLICATIONS WITHDRAWN 1 $126,160 0 $0 0 $0 FILES CLOSED FOR INCOMPLETENESS 0 $0 0 $0 0 $0
Aggregated Statistics For Year 2001(Based on 4 full and 6 partial tracts) A) Conventional B) Refinancings C) Non-occupant Loans on Number Average Value Number Average Value Number Average Value
LOANS ORIGINATED 139 $96,710 27 $150,128 12 $60,734 APPLICATIONS APPROVED, NOT ACCEPTED 19 $97,255 2 $118,065 0 $0 APPLICATIONS DENIED 2 $92,215 0 $0 0 $0 APPLICATIONS WITHDRAWN 2 $68,920 0 $0 0 $0 FILES CLOSED FOR INCOMPLETENESS 0 $0 0 $0 0 $0
Aggregated Statistics For Year 2000(Based on 4 full and 6 partial tracts) A) Conventional B) Refinancings C) Non-occupant Loans on Number Average Value Number Average Value Number Average Value
LOANS ORIGINATED 127 $83,117 8 $69,064 15 $60,855 APPLICATIONS APPROVED, NOT ACCEPTED 14 $111,947 0 $0 1 $46,180 APPLICATIONS DENIED 2 $67,745 2 $128,935 2 $128,935 APPLICATIONS WITHDRAWN 1 $121,650 0 $0 0 $0 FILES CLOSED FOR INCOMPLETENESS 0 $0 0 $0 0 $0
Aggregated Statistics For Year 1999(Based on 2 full and 4 partial tracts) A) Conventional B) Refinancings C) Non-occupant Loans on Number Average Value Number Average Value Number Average Value
LOANS ORIGINATED 70 $91,684 20 $102,603 5 $70,562 APPLICATIONS APPROVED, NOT ACCEPTED 5 $85,328 1 $84,540 1 $135,120 APPLICATIONS DENIED 1 $84,390 0 $0 0 $0 APPLICATIONS WITHDRAWN 1 $136,690 1 $46,120 0 $0 FILES CLOSED FOR INCOMPLETENESS 3 $48,657 1 $184,460 1 $35,800
2002 - 2018 National Fire Incident Reporting System (NFIRS) incidents See full 2006 National Fire Incident Reporting System statistics for zip code 75092, Texas
Most common first names in zip code 75092 among deceased individuals Name Count Lived (average)
Mary 66 81.3 years James 56 74.3 years John 42 76.8 years Robert 37 75.9 years William 37 81.3 years Dorothy 26 82.3 years Betty 24 72.4 years Helen 23 81.9 years Margaret 22 79.4 years Charles 22 75.4 years
Most common last names in zip code 75092 among deceased individuals Last name Count Lived (average)
Brown 23 82.6 years Smith 22 79.5 years Miller 17 82.3 years Johnson 17 82.0 years White 16 74.4 years Williams 14 81.3 years Anderson 14 78.8 years Wilson 12 75.2 years Taylor 12 75.0 years Wright 12 81.0 years
Businesses in zip code 75092
Name Count Name Count
AT&T 1 Jones New York 1 Bed Bath & Beyond 1 Lane Bryant 1 Catherines 1 McDonald's 1 Chuck E. Cheese's 1 Old Navy 1 Church's Chicken 1 RadioShack 1 Curves 1 Rue21 1 Dressbarn 1 Starbucks 1 FedEx 2 T-Mobile 2 Hobby Lobby 1 Target 1 Holiday Inn 1 U-Haul 2 Home Depot 1 UPS 3 JCPenney 1 Walmart 1 Jack In The Box 1 Wendy's 1
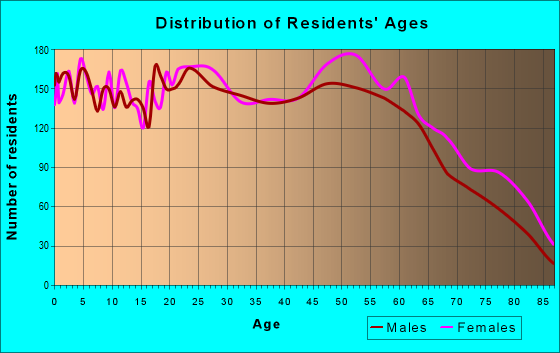
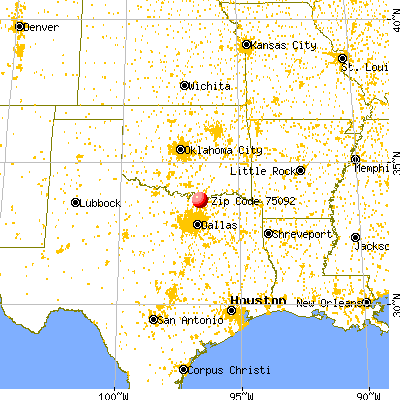


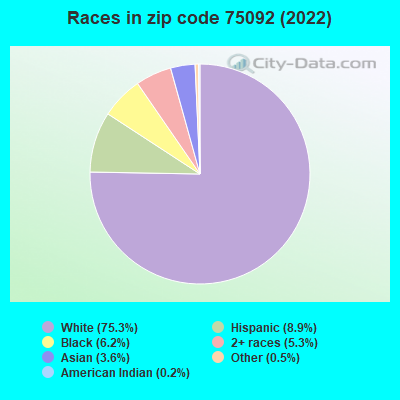


 Nearest zip codes: 76268, 75459, 75076, 75020, 76264, 75090.
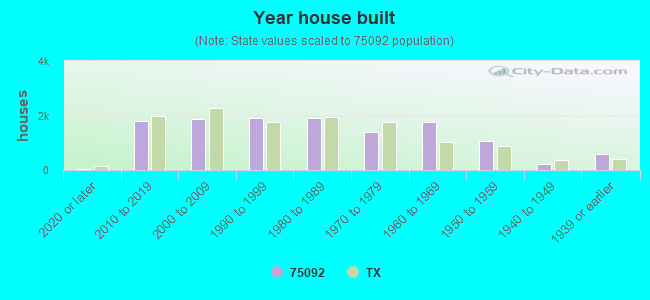
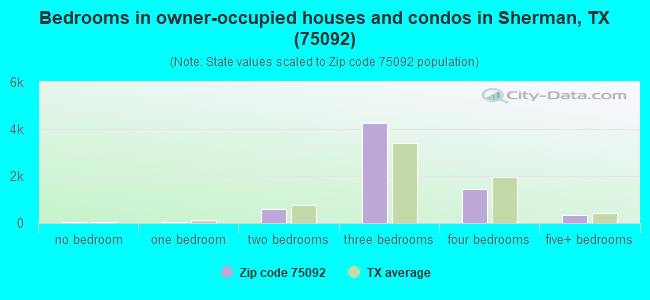
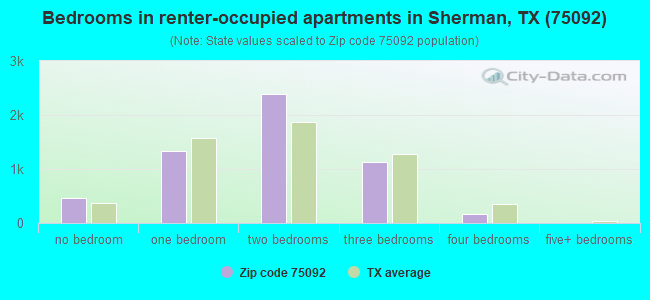
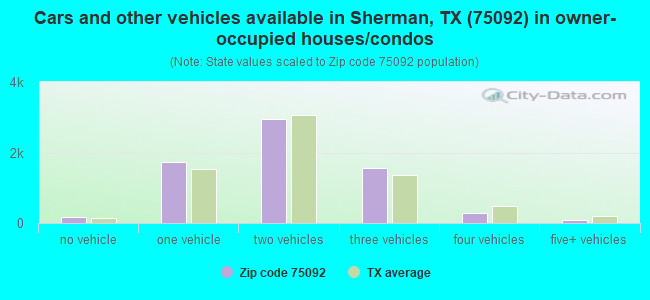
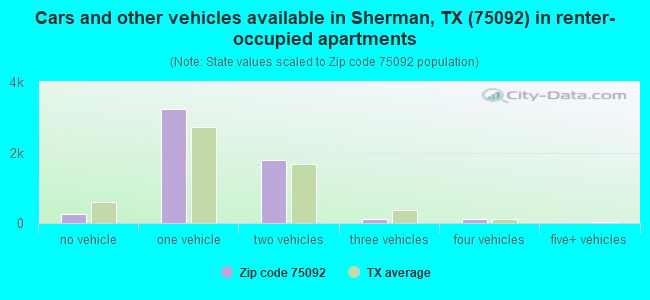


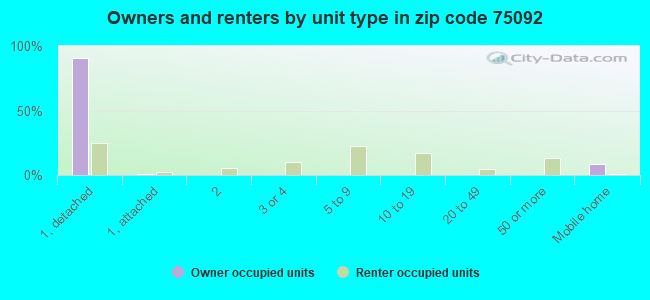
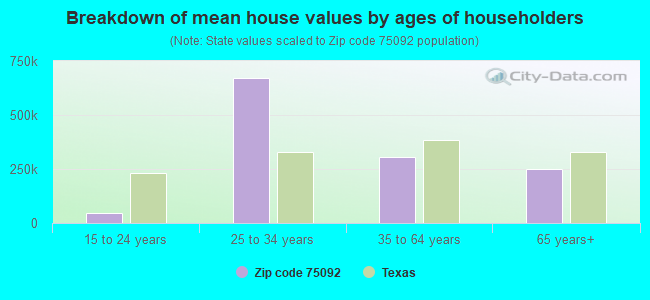


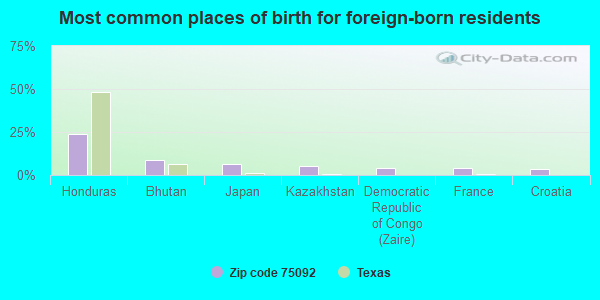
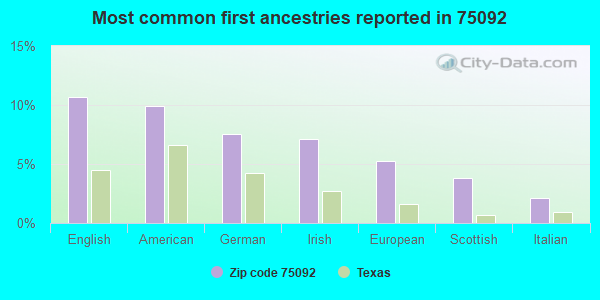
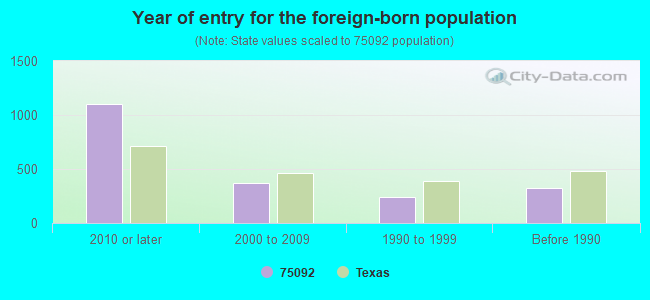

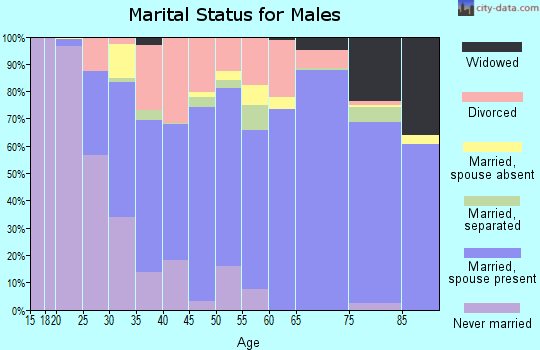
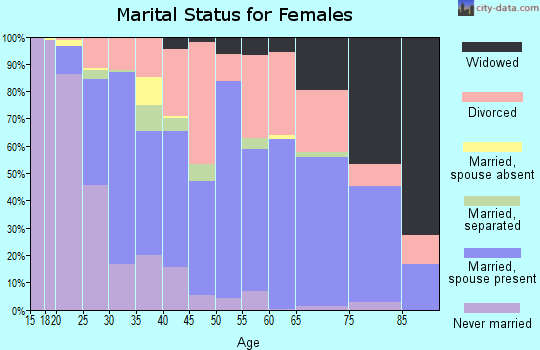
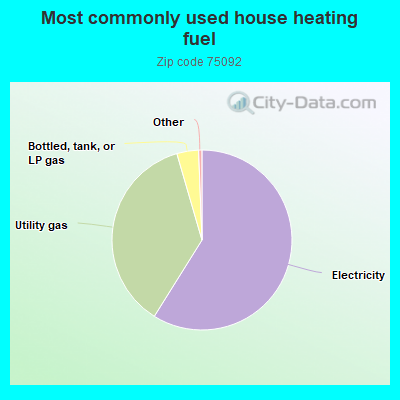
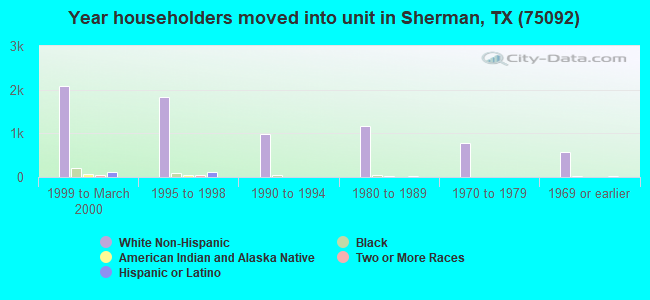
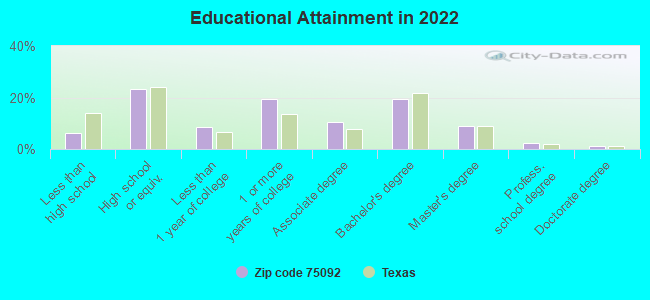
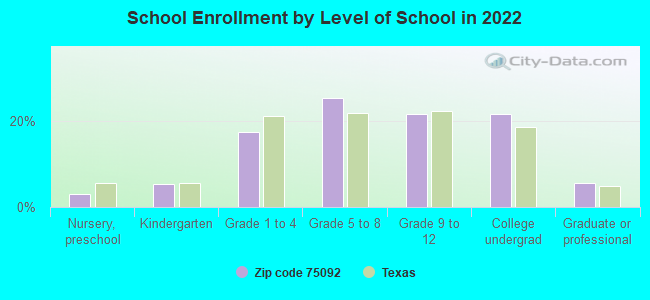
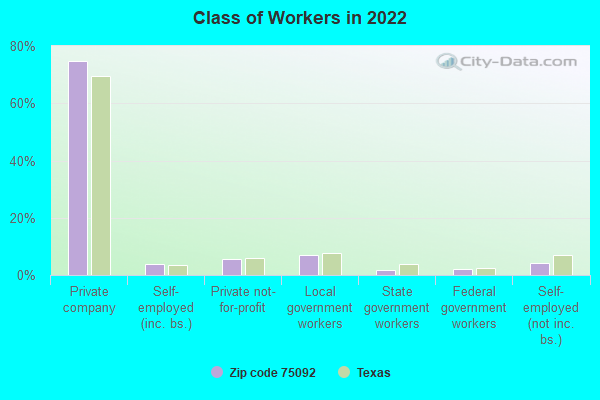
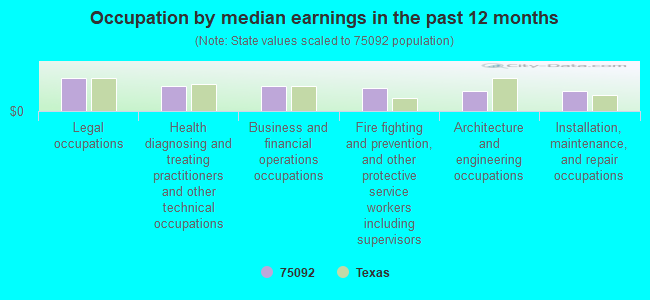
 : $230,058 in 17 contracts from 2000 to 2006
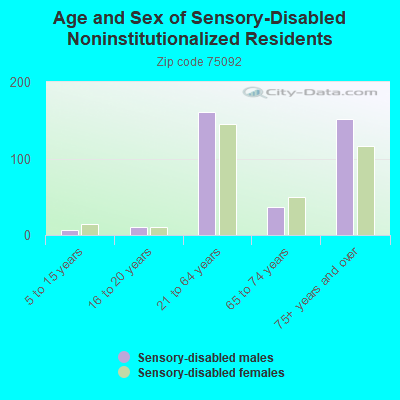
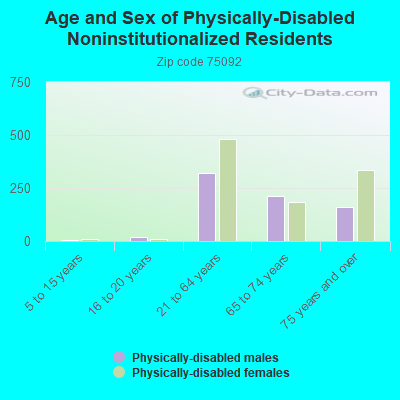
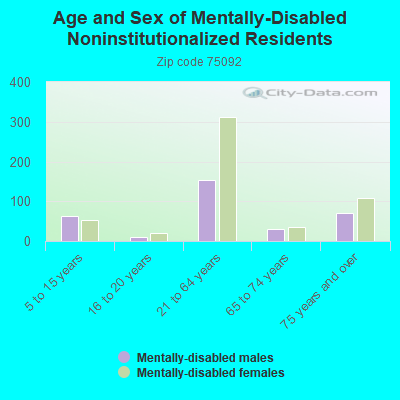
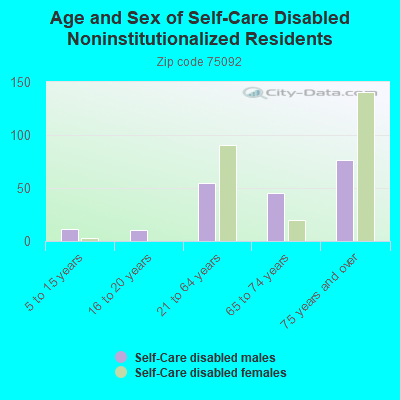
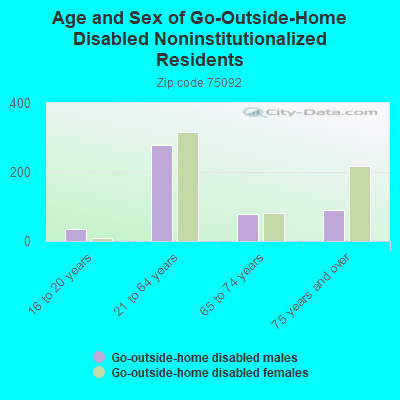
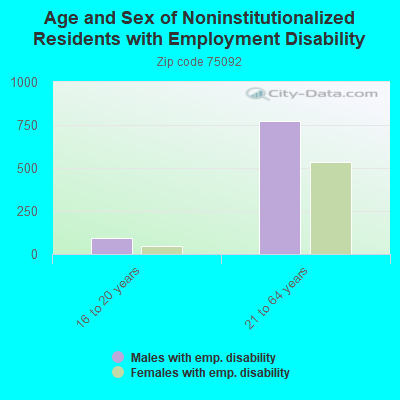
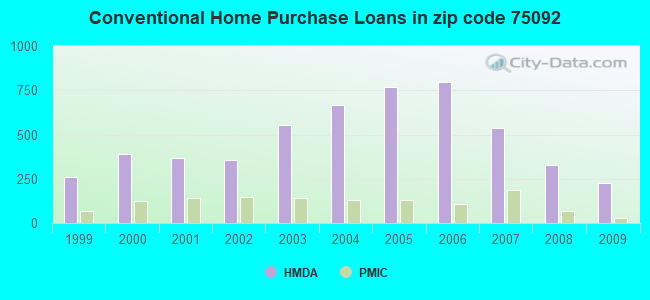
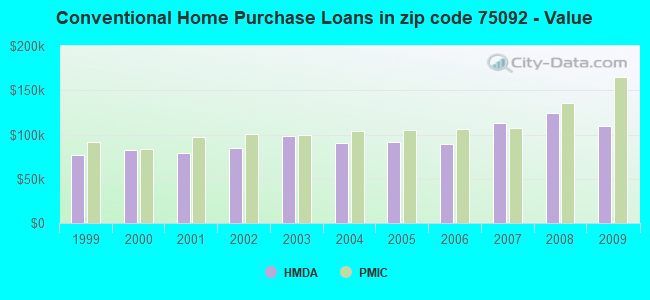
 According to the data from the years 2002 - 2018 the average number of fire incidents per year is 32. The highest number of reported fires - 86 took place in 2011, and the least - 9 in 2002. The data has a growing trend.
 When looking into fire subcategories, the most reports belonged to: Outside Fires (67.9%), and Structure Fires (18.1%).