Estimated zip code population in 2022: 25,144 Zip code population in 2010: 21,872 Zip code population in 2000: 21,740
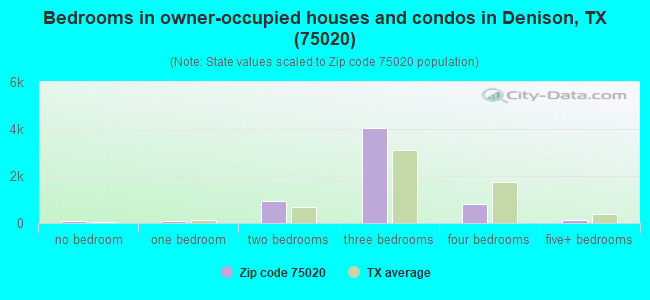
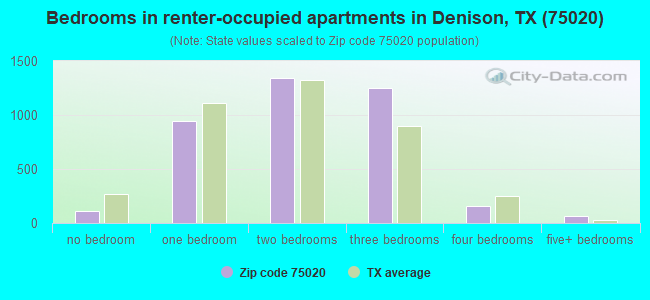
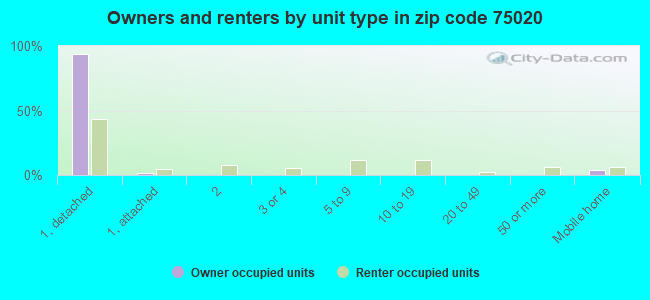
Houses and condos: 11,224 Renter-occupied apartments: 3,921
% of renters here:
39%
State:
38%
March 2022 cost of living index in zip code 75020: 84.8 (less than average, U.S. average is 100)
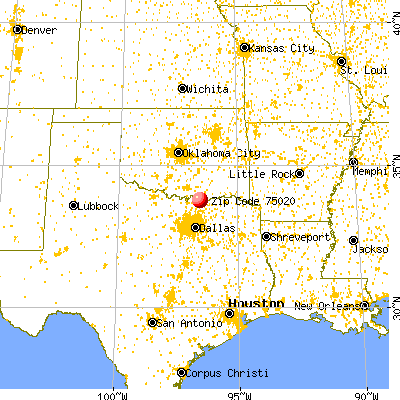
Land area: 62.6 sq. mi. Water area: 4.8 sq. mi.
Population density: 402 people per square mile
(low).
OSM Map
General Map
Google Map
MSN Map
OSM Map
General Map
Google Map
MSN Map
OSM Map
General Map
Google Map
MSN Map
OSM Map
General Map
Google Map
MSN Map
Please wait while loading the map...
Real estate property taxes paid for housing units in 2022:
This zip code:
1.2% ($2,390)
Texas:
1.5% ($4,050)
Median real estate property taxes paid for housing units with mortgages in 2022: $2,718 (1.4%) Median real estate property taxes paid for housing units with no mortgage in 2022: $2,142 (1.1%)
Averages for the 2020 tax year for zip code 75020, filed in 2021:
Average Adjusted Gross Income (AGI) in 2020: $56,806 (Individual Income Tax Returns)
Here:
$56,806
State:
$77,054
Salary/wage: $47,571 (reported on 81.6% of returns)
Here:
$47,571
State:
$62,766
(% of AGI for various income ranges: 1120.7% for AGIs below $25k, 3464.8% for AGIs $25k-50k, 6303.6% for AGIs $50k-75k, 9110.8% for AGIs $75k-100k, 15870.4% for AGIs $100k-200k, 73944.4% for AGIs over 200k)
Taxable interest for individuals: $1,458 (reported on 20.6% of returns)
This zip code:
$1,458
Texas:
$2,665
(% of AGI for various income ranges: 13.4% for AGIs below $25k, 15.0% for AGIs $25k-50k, 38.9% for AGIs $50k-75k, 66.1% for AGIs $75k-100k, 121.8% for AGIs $100k-200k, 905.6% for AGIs over 200k)
Ordinary dividends: $6,062 (reported on 11.9% of returns)
Here:
$6,062
State:
$10,044
(% of AGI for various income ranges: 16.7% for AGIs below $25k, 21.0% for AGIs $25k-50k, 87.9% for AGIs $50k-75k, 86.6% for AGIs $75k-100k, 309.3% for AGIs $100k-200k, 3582.2% for AGIs over 200k)
Net capital gain/loss in AGI: +$24,227 (reported on 11.6% of returns)
Here:
+$24,227
State:
+$39,590
(% of AGI for various income ranges: 8.1% for AGIs below $25k, 16.2% for AGIs $25k-50k, 82.1% for AGIs $50k-75k, 104.7% for AGIs $75k-100k, 642.8% for AGIs $100k-200k, 26912.2% for AGIs over 200k)
Profit/loss from business: +$10,360 (reported on 14.9% of returns)
Here:
+$10,360
State:
+$10,888
(% of AGI for various income ranges: 114.7% for AGIs below $25k, 118.2% for AGIs $25k-50k, 116.2% for AGIs $50k-75k, 255.3% for AGIs $75k-100k, 494.0% for AGIs $100k-200k, 4540.0% for AGIs over 200k)
Taxable individual retirement arrangement distribution: $20,049 (reported on 8.4% of returns)
75020:
$20,049
Texas:
$24,740
(% of AGI for various income ranges: 51.2% for AGIs below $25k, 88.9% for AGIs $25k-50k, 160.0% for AGIs $50k-75k, 389.8% for AGIs $75k-100k, 1049.9% for AGIs $100k-200k, 3675.6% for AGIs over 200k)
Self-employed (Keogh) retirement plans: $27,450 (reported on 0.2% of returns)
75020:
$27,450
Texas:
$29,298
(% of AGI for various income ranges: 81.9% for AGIs $100k-200k)
Total itemized deductions: $45,884 (reported on 5.2% of returns)
Here:
$45,884
State:
$40,428
(% of AGI for various income ranges: 27.4% for AGIs below $25k, 74.3% for AGIs $25k-50k, 246.1% for AGIs $50k-75k, 233.5% for AGIs $75k-100k, 1066.4% for AGIs $100k-200k, 13361.1% for AGIs over 200k)
Charity contributions: $12,252 (reported on 4.2% of returns)
Here:
$12,252
State:
$18,201
(% of AGI for various income ranges: 10.0% for AGIs $25k-50k, 39.0% for AGIs $50k-75k, 63.1% for AGIs $75k-100k, 261.8% for AGIs $100k-200k, 3103.3% for AGIs over 200k)
Taxes paid: $6,604 (reported on 5.1% of returns)
75020:
$6,604
State:
$7,821
(% of AGI for various income ranges: 3.2% for AGIs below $25k, 11.1% for AGIs $25k-50k, 42.3% for AGIs $50k-75k, 50.5% for AGIs $75k-100k, 189.4% for AGIs $100k-200k, 1394.4% for AGIs over 200k)
Earned income credit: $2,451 (reported on 21.5% of returns)
Here:
$2,451
State:
$2,584
(% of AGI for various income ranges: 119.1% for AGIs below $25k, 80.1% for AGIs $25k-50k, 1.2% for AGIs $50k-75k)
Percentage of individuals using paid preparers for their 2020 taxes: 93.2%
Here:
93%
State:
92%
(% for various income ranges: 92.4% for AGIs below $25k, 94.9% for AGIs $25k-50k, 92.1% for AGIs $50k-75k, 93.1% for AGIs $75k-100k, 93.1% for AGIs $100k-200k, 93.5% for AGIs over 200k)
Averages for the 2012 tax year for zip code 75020, filed in 2013:
Average Adjusted Gross Income (AGI) in 2012: $45,733 (Individual Income Tax Returns)
Here:
$45,733
State:
$65,384
Salary/wage: $37,759 (reported on 82.9% of returns)
Here:
$37,759
State:
$52,524
(% of AGI for various income ranges: 76.1% for AGIs below $25k, 78.8% for AGIs $25k-50k, 74.5% for AGIs $50k-75k, 73.1% for AGIs $75k-100k, 69.8% for AGIs $100k-200k, 39.6% for AGIs over 200k)
Taxable interest for individuals: $1,632 (reported on 22.4% of returns)
This zip code:
$1,632
Texas:
$2,372
(% of AGI for various income ranges: 1.0% for AGIs below $25k, 0.7% for AGIs $25k-50k, 0.7% for AGIs $50k-75k, 0.7% for AGIs $75k-100k, 1.2% for AGIs $100k-200k, 0.5% for AGIs over 200k)
Ordinary dividends: $5,098 (reported on 12.6% of returns)
Here:
$5,098
State:
$9,721
(% of AGI for various income ranges: 1.0% for AGIs below $25k, 0.6% for AGIs $25k-50k, 0.8% for AGIs $50k-75k, 1.0% for AGIs $75k-100k, 1.9% for AGIs $100k-200k, 3.0% for AGIs over 200k)
Net capital gain/loss in AGI: +$6,341 (reported on 10.8% of returns)
Here:
+$6,341
State:
+$35,319
(% of AGI for various income ranges: 0.3% for AGIs $25k-50k, 0.4% for AGIs $50k-75k, 0.5% for AGIs $75k-100k, 1.9% for AGIs $100k-200k, 5.6% for AGIs over 200k)
Profit/loss from business: +$12,152 (reported on 14.3% of returns)
Here:
+$12,152
State:
+$13,732
(% of AGI for various income ranges: 7.1% for AGIs below $25k, 2.1% for AGIs $25k-50k, 2.5% for AGIs $50k-75k, 1.5% for AGIs $75k-100k, 3.9% for AGIs $100k-200k, 6.4% for AGIs over 200k)
Taxable individual retirement arrangement distribution: $16,189 (reported on 9.7% of returns)
75020:
$16,189
Texas:
$19,511
(% of AGI for various income ranges: 2.7% for AGIs below $25k, 2.0% for AGIs $25k-50k, 2.9% for AGIs $50k-75k, 4.3% for AGIs $75k-100k, 3.9% for AGIs $100k-200k, 5.0% for AGIs over 200k)
Self-employment retirement plans: $19,400 (reported on 0.2% of returns)
75020:
$19,400
Texas:
$23,938
(% of AGI for various income ranges: 0.7% for AGIs $75k-100k)
Total itemized deductions: $24,641 (23% of AGI, reported on 17.1% of returns)
Here:
$24,641
State:
$24,724
Here:
22.7% of AGI
State:
15.9% of AGI
(% of AGI for various income ranges: 5.5% for AGIs below $25k, 5.8% for AGIs $25k-50k, 8.7% for AGIs $50k-75k, 9.2% for AGIs $75k-100k, 11.3% for AGIs $100k-200k, 14.1% for AGIs over 200k)
Charity contributions: $5,737 (reported on 12.7% of returns)
Here:
$5,737
State:
$6,808
(% of AGI for various income ranges: 0.5% for AGIs below $25k, 0.8% for AGIs $25k-50k, 1.4% for AGIs $50k-75k, 1.7% for AGIs $75k-100k, 2.6% for AGIs $100k-200k, 2.2% for AGIs over 200k)
Taxes paid: $4,971 (reported on 16.8% of returns)
75020:
$4,971
State:
$6,921
(% of AGI for various income ranges: 0.9% for AGIs below $25k, 1.1% for AGIs $25k-50k, 1.8% for AGIs $50k-75k, 1.9% for AGIs $75k-100k, 3.0% for AGIs $100k-200k, 2.0% for AGIs over 200k)
Earned income credit: $2,365 (reported on 25.3% of returns)
Here:
$2,365
State:
$2,570
(% of AGI for various income ranges: 8.0% for AGIs below $25k, 1.4% for AGIs $25k-50k)
Percentage of individuals using paid preparers for their 2012 taxes: 51.8%
Here:
52%
State:
51%
(% for various income ranges: 48.3% for AGIs below $25k, 50.2% for AGIs $25k-50k, 55.3% for AGIs $50k-75k, 56.5% for AGIs $75k-100k, 61.9% for AGIs $100k-200k, 86.7% for AGIs over 200k)
Averages for the 2004 tax year for zip code 75020, filed in 2005:
Average Adjusted Gross Income (AGI) in 2004: $37,289 (Individual Income Tax Returns)
Here:
$37,289
State:
$47,881
Salary/wage: $34,052 (reported on 80.8% of returns)
Here:
$34,052
State:
$41,947
(% of AGI for various income ranges: 103.9% for AGIs below $10k, 75.2% for AGIs $10k-25k, 77.3% for AGIs $25k-50k, 78.3% for AGIs $50k-75k, 75.4% for AGIs $75k-100k, 63.1% for AGIs over 100k)
Taxable interest for individuals: $2,033 (reported on 34.4% of returns)
This zip code:
$2,033
Texas:
$2,255
(% of AGI for various income ranges: 6.1% for AGIs below $10k, 2.3% for AGIs $10k-25k, 1.5% for AGIs $25k-50k, 1.7% for AGIs $50k-75k, 1.4% for AGIs $75k-100k, 2.0% for AGIs over 100k)
Taxable dividends: $2,461 (reported on 16.8% of returns)
Here:
$2,461
State:
$4,261
(% of AGI for various income ranges: 3.0% for AGIs below $10k, 0.8% for AGIs $10k-25k, 0.6% for AGIs $25k-50k, 0.7% for AGIs $50k-75k, 0.7% for AGIs $75k-100k, 2.1% for AGIs over 100k)
Net capital gain/loss: +$6,846 (reported on 14.6% of returns)
Here:
+$6,846
State:
+$16,110
(% of AGI for various income ranges: -2.1% for AGIs below $10k, 0.2% for AGIs $10k-25k, 0.3% for AGIs $25k-50k, 0.7% for AGIs $50k-75k, 1.0% for AGIs $75k-100k, 8.9% for AGIs over 100k)
Profit/loss from business: +$9,479 (reported on 17.0% of returns)
Here:
+$9,479
State:
+$11,013
(% of AGI for various income ranges: 4.9% for AGIs below $10k, 5.8% for AGIs $10k-25k, 3.1% for AGIs $25k-50k, 1.8% for AGIs $50k-75k, 2.1% for AGIs $75k-100k, 7.8% for AGIs over 100k)
IRA payment deduction: $3,251 (reported on 1.9% of returns)
75020:
$3,251
Texas:
$3,120
(% of AGI for various income ranges: 0.1% for AGIs $10k-25k, 0.2% for AGIs $25k-50k, 0.1% for AGIs $50k-75k, 0.2% for AGIs $75k-100k, 0.2% for AGIs over 100k)
Self-employed pension: $12,828 (reported on 0.3% of returns)
Here:
$12,828
Texas:
$16,401
Total itemized deductions: $17,538 (22% of AGI, reported on 17.3% of returns)
Here:
$17,538
State:
$19,631
Here:
21.7% of AGI
State:
18.9% of AGI
(% of AGI for various income ranges: 8.8% for AGIs below $10k, 5.0% for AGIs $10k-25k, 6.1% for AGIs $25k-50k, 8.4% for AGIs $50k-75k, 10.6% for AGIs $75k-100k, 10.2% for AGIs over 100k)
Charity contributions deductions: $4,708 (5% of AGI, reported on 14.1% of returns)
Here:
$4,708
State:
$4,753
Here:
5.5% of AGI
State:
4.2% of AGI
(% of AGI for various income ranges: 0.5% for AGIs below $10k, 0.8% for AGIs $10k-25k, 0.9% for AGIs $25k-50k, 1.7% for AGIs $50k-75k, 2.4% for AGIs $75k-100k, 2.9% for AGIs over 100k)
Total tax: $5,629 (reported on 70.5% of returns)
75020:
$5,629
State:
$9,058
(% of AGI for various income ranges: 4.0% for AGIs below $10k, 3.9% for AGIs $10k-25k, 6.6% for AGIs $25k-50k, 8.8% for AGIs $50k-75k, 11.0% for AGIs $75k-100k, 19.7% for AGIs over 100k)
Earned income credit: $1,816 (reported on 22.4% of returns)
Here:
$1,816
State:
$2,024
Percentage of individuals using paid preparers for their 2004 taxes: 60.1%
Here:
60%
State:
57%
(% for various income ranges: 53.8% for AGIs below $10k, 62.2% for AGIs $10k-25k, 61.1% for AGIs $25k-50k, 58.4% for AGIs $50k-75k, 59.8% for AGIs $75k-100k, 74.3% for AGIs over 100k)
Likely homosexual households (counted as self-reported same-sex unmarried-partner households)
Lesbian couples: 0.7% of all households
Gay men: 0.1% of all households
Household received Food Stamps/SNAP in the past 12 months: 1,158 Household did not receive Food Stamps/SNAP in the past 12 months: 8,888
Women who had a birth in the past 12 months: 316 (192 now married, 122 unmarried) Women who did not have a birth in the past 12 months: 5,087 (2,329 now married, 2,755 unmarried)
Housing units in zip code 75020 with a mortgage: 3,014 (71 second mortgage, 77 both second mortgage and home equity loan) Houses without a mortgage: 18
Median monthly owner costs for units with a mortgage: $1,342 Median monthly owner costs for units without a mortgage: $573
Residents with income below the poverty level in 2022:
This zip code:
16.4%
Whole state:
14.0%
Residents with income below 50% of the poverty level in 2022:
This zip code:
9.2%
Whole state:
7.4%
Median number of rooms in houses and condos:
Here:
6.1
State:
6.3
Median number of rooms in apartments:
Here:
4.2
State:
4.0
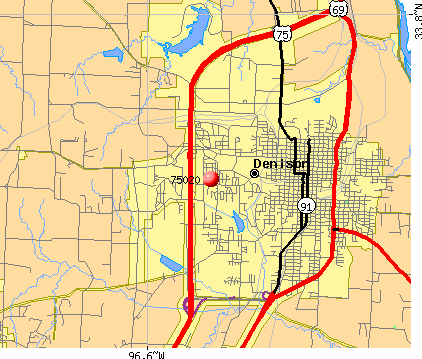
Notable locations in this zip code not listed on our city pages
Notable locations in zip code 75020: Denison Commercial Historic District (A), George Braun House (B), North Texas Regional Airport Fire Department (C), Denison Fire Department West Side Station (D), Denison Fire Department South Side Station (E), Denison Fire Department Central Station (F), Clifton House Hotel (G). Display/hide their locations on the map
Churches in zip code 75020 include: College Boulevard Baptist Church (A), Bethel Community Baptist Church (B), Antioch Baptist Church (C), First Baptist Church (D), Faith Fellowship Baptist Church (E), Emmanuel Baptist Church (F), Grace Church (G), Saint Luke Church (H), Hyde Park Presbyterian Church (I). Display/hide their locations on the map
Lakes and reservoirs: R and G Club Lake (A), Waterloo Lake (B), Loy Lake (C), Randell Lake (D), Dennison Club Lake (E). Display/hide their locations on the map
Parks in zip code 75020 include: Jones Park (1), Waterloo Park (2), Jones Park (3), Forest Park (4), Loy Park (5), Eisenhower State Park (6), Grandpappy Point Park (7), Forest Park (8), Munson Park (9). Display/hide their locations on the map
In group quarters: 456 (-1 institutionalized population)
Size of family households: 2,639 2-persons, 1,846 3-persons, 1,232 4-persons, 496 5-persons, 271 6-persons, 72 7-or-more-persons
Size of nonfamily households: 2,920 1-person, 567 2-persons, 26 3-persons
3,909 married couples with children.
1,545 single-parent households (269 men, 1,276 women).
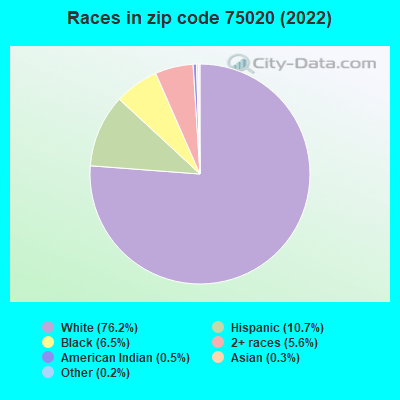
94.3% of residents of 75020 zip code speak English at home.
5.3% of residents speak Spanish at home (61% very well, 10% well, 21% not well, 8% not at all).
0.2% of residents speak other Indo-European language at home (100% very well).
0.2% of residents speak Asian or Pacific Island language at home (84% very well, 16% not at all).
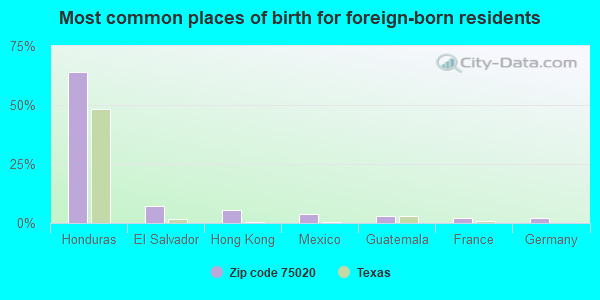
Foreign born population: 680 (2.7%) (24.0% of them are naturalized citizens)
This zip code:
2.7%
Whole state:
17.2%
64%Honduras
7%El Salvador
5%Hong Kong
4%Mexico
3%Guatemala
2%France
2%Germany
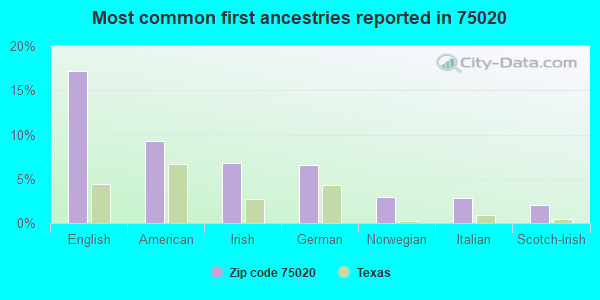
17%English
9%American
7%Irish
7%German
3%Norwegian
3%Italian
2%Scotch-Irish
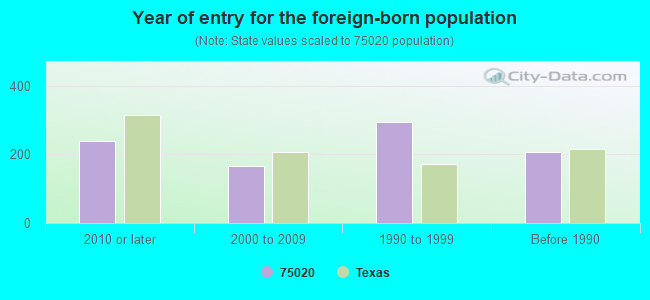
Year of entry for the foreign-born population
2402010 or later
1672000 to 2009
2951990 to 1999
208Before 1990
Facilities with environmental interests located in this zip code:
B MCDANIEL MIDDLE (400 N LILLIS LN in DENISON, TX)
(National Center for Education Statistics) - STATE ID-091903041 Organizations: DENISON ISD (SCHOOL DISTRICT)
ABC AUTO & SALVAGE (125 LAZY RIVER TRAIL in DENISON, TX)
(Integrated Compliance Information System) - ICIS-06-2000-0205, FORMAL ENFORCEMENT ACTION Business SIC classification: MOTOR VEHICLE SUPPLIES AND NEW PARTS; MOTOR VEHICLE PARTS, USED
ALCOA HOME EXTERIORS INC. DENISON TEXAS (1601 COMMERCE BOULEVARD in DENISON, TX)
CRITERIA AND HAZARDOUS AIR POLLUTANT INVENTORY (Inventory of air pollution sources) Conditionally Exempt Small Quantity Generators, less than 100 kg/month of hazardous waste (Resource Conservation and Recovery Act (tracking hazardous waste)) - notification TRI REPORTER (Tracking of toxic chemicals releasing facilities) Business SIC classification: PLASTICS PRODUCTS Business NAICS classification: ALL OTHER PLASTICS PRODUCT MANUFACTURING. Alternative names: ALCOA BUILDING PRODS., ALCOA BUILDING PRODS. INC., ALUMINUM COMPANY OF AMERICA BUILDING PRODUCTS
AG PROCESSING INCORPORATED (1405 W. WASHINGTON in DENISON, TX)
AIR MINOR (AIRS/AFS) TRI REPORTER (Tracking of toxic chemicals releasing facilities) Business SIC classification: SHORTENING, TABLE OILS, MARGARINE, AND OTHER EDIBLE FATS AND OILS Alternative names: AGP REFINERIES L.C.
ALCOA BUILDING PRODUCTS (2011 MCGREGOR DRIVE in DENISON, TX)
Small Quantity Generators, between 100 kg and 1000 kg of hazardous waste/month (Resource Conservation and Recovery Act (tracking hazardous waste)) - notification Organizations: THE WINDSOR CORPORATION (CONTACT/OWNER)
Housing units lacking complete plumbing facilities: 0.6% Housing units lacking complete kitchen facilities: 2.3%
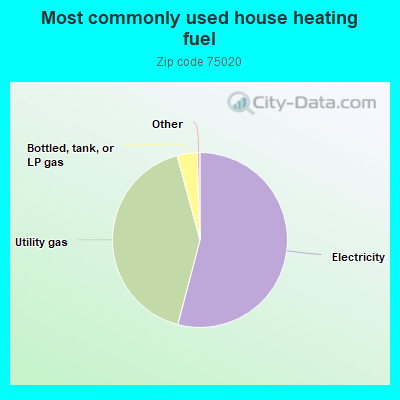
54.1%Electricity
41.7%Utility gas
3.7%Bottled, tank, or LP gas
Population in 1990: 27,172.
Place of birth for U.S.-born residents:
This state: 17,037
Northeast: 562
Midwest: 2,064
South: 2,738
West: 1,758
54% of the 75020 zip code residents lived in the same house 5 years ago. Out of people who lived in different houses, 61% lived in this county. Out of people who lived in different counties, 50% lived in Texas.
87% of the 75020 zip code residents lived in the same house 1 year ago. Out of people who lived in different houses, 56% moved from this county. Out of people who lived in different houses, 26% moved from different county within same state. Out of people who lived in different houses, 15% moved from different state. Out of people who lived in different houses, 2% moved from abroad.
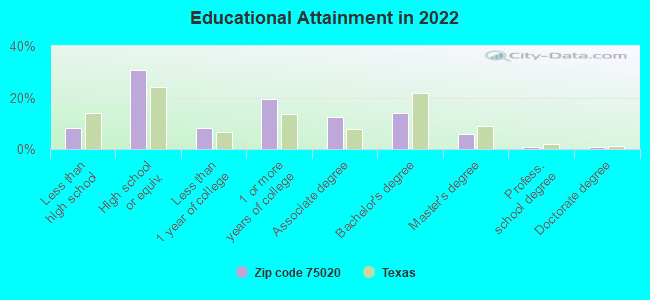
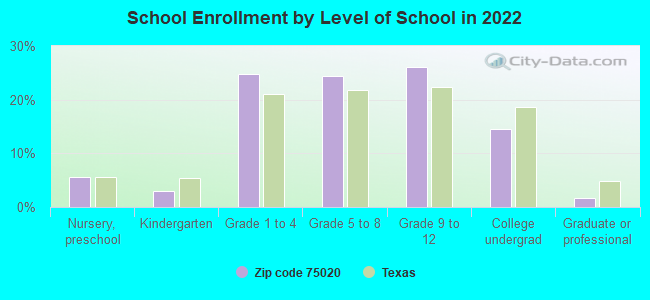
Private vs. public school enrollment:
Students in private schools in grades 1 to 8 (elementary and middle school): 116
Here:
3.9%
Texas:
8.8%
Students in private schools in grades 9 to 12 (high school): 161
Here:
10.2%
Texas:
8.0%
Students in private undergraduate colleges: 82
Here:
9.3%
Texas:
16.2%
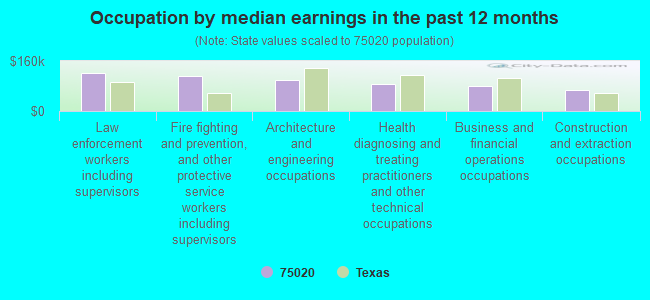
Occupation by median earnings in the past 12 months ($)
120,058Law enforcement workers including supervisors
111,105Fire fighting and prevention, and other protective service workers including supervisors
98,877Architecture and engineering occupations
84,970Health diagnosing and treating practitioners and other technical occupations
79,422Business and financial operations occupations
68,299Construction and extraction occupations
Companies with federal contracts located in this zip code:
NORTHWESTERN DEVELOPMENT COMPA (P PAR in PARIS, In) : $5,428,587 in 13 contractsfrom 2001 to 2003
Contracts for Lease or Rental of Facilities -- Office Buildings by Public Buildings Service Signed by year:2000: $0; 2001: $878,000; 2002: $2,200,342; 2003: $2,350,245; 2004: $0; 2005: $0; 2006: $0.
Biggest contracts:
$441,000 with Public Buildings Service for Lease or Rental of Facilities -- Office Buildings. Taking place in DC. Signed on 2002-09-15. Completion date: 2002-09-15.
$440,671, same as above.Signed on 2002-12-15. Completion date: 2002-12-15.
$440,671, same as above.Signed on 2003-09-15. Completion date: 2003-09-15.
$440,671, same as above.Signed on 2003-06-15. Completion date: 2003-06-15.
SUPERIOR MAGNETICS (3401 TEXOMA DRIVE in DENISON, TX; small business) : $207,238 in 5 contractsin 2000
Contracts for Radar Equipment, Airborne, Coils and Transformers, Amplifiers by Defense Logistics Agency Signed by year:2000: $207,238; 2001: $0; 2002: $0; 2003: $0; 2004: $0; 2005: $0; 2006: $0.
Biggest contracts:
$73,425 with Defense Logistics Agency for Radar Equipment, Airborne. Signed on 2000-11-16. Completion date: 2001-04-05.
$50,060, same as above.Signed on 2000-05-30. Completion date: 2000-09-19.
$29,821 with Defense Logistics Agency for Coils and Transformers. Signed on 2000-03-31. Completion date: 2000-09-15.
$26,966 with Defense Logistics Agency for Amplifiers. Signed on 2000-03-10. Completion date: 2000-06-10.
LAWRENCE, TOMMY L (618 W BAKER in DENISON, TX; small business) : $106,551 in 6 contractsfrom 2004 to 2006
Contracts for Trash/Garbage Collection Services - Including Portable Sanitation Services by Army, U.S. Army Corps of Engineers - civil program financing only Signed by year:2000: $0; 2001: $0; 2002: $0; 2003: $0; 2004: $42,000; 2005: $42,200; 2006: $22,351.
Biggest contracts:
$22,351 with Army for Trash/Garbage Collection Services - Including Portable Sanitation Services. Signed on 2006-03-31. Completion date: 2007-03-31.
$21,000, same as above.Signed on 2005-03-07. Completion date: 2004-04-01.
$21,000 with U.S. Army Corps of Engineers - civil program financing only for Trash/Garbage Collection Services - Including Portable Sanitation Services. Signed on 2005-03-07. Completion date: 2004-04-01.
$21,000 with Army for Trash/Garbage Collection Services - Including Portable Sanitation Services. Signed on 2004-03-18. Completion date: 2004-04-01.
LANHAM, STEVEN M (524 W HERON ST in DENISON, TX; small business) : $32,324 in 3 contractsfrom 2005 to 2006
$10,988 with Army for Trash/Garbage Collection Services - Including Portable Sanitation Services. Signed on 2006-03-31. Completion date: 2007-03-31.
$10,668, same as above.Signed on 2005-03-25. Completion date: 2005-01-10.
$10,668 with U.S. Army Corps of Engineers - civil program financing only for Trash/Garbage Collection Services - Including Portable Sanitation Services. Signed on 2005-03-25. Completion date: 2005-01-10.
SMITH, LARRY D (705 W CRAWFORD ST in DENISON, TX; small business) : $30,000 in 2 contractsin 2000
$30,000 with Air Force for Other Housekeeping Services. Signed on 2000-02-22. Completion date: 2000-09-30.
$0, same as above.Signed on 2000-02-22. Completion date: 2000-09-30.
MORALES, MARIA G (1306 W WOODARD ST in DENISON, TX; small business) : $17,707 in 3 contractsin 2005
$9,975 with Army for Custodial Janitorial Services. Signed on 2005-12-22. Completion date: 2006-10-31.
$3,866, same as above.Signed on 2005-08-25. Completion date: 2005-11-30.
$3,866 with U.S. Army Corps of Engineers - civil program financing only for Custodial Janitorial Services. Signed on 2005-08-25. Completion date: 2005-11-30.
GRAYSON PRO-TECH, INC (3729 N HWY91 in DENISON, TX; small business) : $12,196 in 2 contractsin 2004
$6,098 with Army for Surveillance Services. Signed on 2004-07-23. Completion date: 2004-08-31.
$6,098 with U.S. Army Corps of Engineers - civil program financing only for Surveillance Services. Signed on 2004-07-23. Completion date: 2004-08-31.
Top industries in this zip code by the number of employees in 2005:
Health Care and Social Assistance: General Medical and Surgical Hospitals (over 1000 employees: 1 establishment)
2002 - 2018 National Fire Incident Reporting System (NFIRS) incidents
Based on the data from the years 2002 - 2018 the average number of fire incidents per year is 159. The highest number of fires - 271 took place in 2006, and the least - 44 in 2009. The data has an increasing trend.
When looking into fire subcategories, the most reports belonged to: Outside Fires (53.1%), and Structure Fires (29.1%).
Fire incident types reported to NFIRS in Zip Code 75020


 Nearest zip codes: 74731, 75076, 75021, 74733, 75092, 74753.


 Based on the data from the years 2002 - 2018 the average number of fire incidents per year is 159. The highest number of fires - 271 took place in 2006, and the least - 44 in 2009. The data has an increasing trend.
 When looking into fire subcategories, the most reports belonged to: Outside Fires (53.1%), and Structure Fires (29.1%).