Estimated zip code population in 2022: 69,676 Zip code population in 2010: 33,396 Zip code population in 2000: 10,696
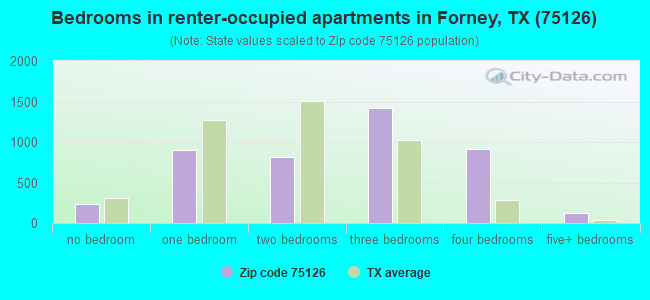
Houses and condos: 22,965 Renter-occupied apartments: 4,416
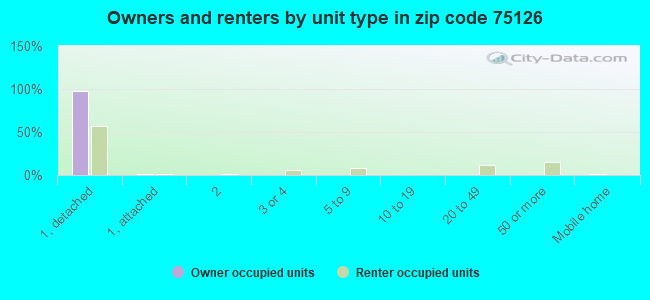
% of renters here:
20%
State:
38%
March 2022 cost of living index in zip code 75126: 95.8 (near average, U.S. average is 100)
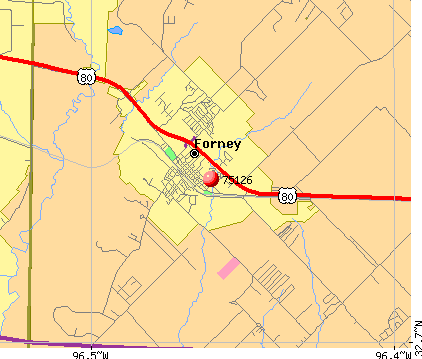
Land area: 77.3 sq. mi. Water area: 0.9 sq. mi.
Population density: 901 people per square mile
(low).
OSM Map
General Map
Google Map
MSN Map
OSM Map
General Map
Google Map
MSN Map
OSM Map
General Map
Google Map
MSN Map
OSM Map
General Map
Google Map
MSN Map
Please wait while loading the map...
Real estate property taxes paid for housing units in 2022:
This zip code:
1.9% ($6,700)
Texas:
1.5% ($4,050)
Median real estate property taxes paid for housing units with mortgages in 2022: $6,914 (2.0%) Median real estate property taxes paid for housing units with no mortgage in 2022: $6,047 (1.7%)
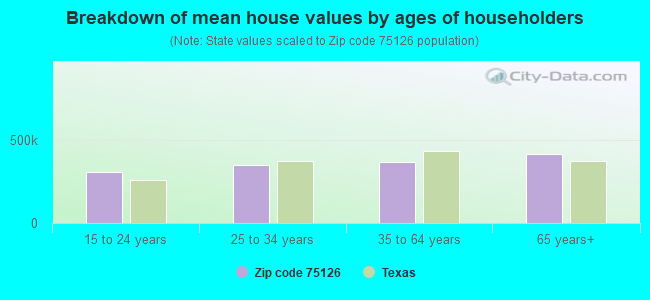
Estimated median house/condo value in 2022: $348,879
75126:
$348,879
Texas:
$275,400
According to our research of Texas and other state lists, there were 67 registered sex offenders living in 75126 zip code as of April 26, 2024. The ratio of all residents to sex offenders in zip code 75126 is 602 to 1. The ratio of registered sex offenders to all residents in this zip code is lower than the state average.
Median resident age:
This zip code:
32.5 years
Texas median age:
35.6 years
Average household size:
This zip code:
3.1 people
Texas:
2.6 people
Averages for the 2020 tax year for zip code 75126, filed in 2021:
Average Adjusted Gross Income (AGI) in 2020: $73,273 (Individual Income Tax Returns)
Here:
$73,273
State:
$77,054
Salary/wage: $66,495 (reported on 89.5% of returns)
Here:
$66,495
State:
$62,766
(% of AGI for various income ranges: 1270.2% for AGIs below $25k, 3831.5% for AGIs $25k-50k, 6857.8% for AGIs $50k-75k, 9958.8% for AGIs $75k-100k, 18016.3% for AGIs $100k-200k, 57521.5% for AGIs over 200k)
Taxable interest for individuals: $1,050 (reported on 16.8% of returns)
This zip code:
$1,050
Texas:
$2,665
(% of AGI for various income ranges: 6.3% for AGIs below $25k, 8.3% for AGIs $25k-50k, 14.1% for AGIs $50k-75k, 18.7% for AGIs $75k-100k, 30.3% for AGIs $100k-200k, 518.7% for AGIs over 200k)
Ordinary dividends: $3,053 (reported on 10.0% of returns)
Here:
$3,053
State:
$10,044
(% of AGI for various income ranges: 6.2% for AGIs below $25k, 10.6% for AGIs $25k-50k, 17.8% for AGIs $50k-75k, 22.7% for AGIs $75k-100k, 69.8% for AGIs $100k-200k, 988.5% for AGIs over 200k)
Net capital gain/loss in AGI: +$14,408 (reported on 10.4% of returns)
Here:
+$14,408
State:
+$39,590
(% of AGI for various income ranges: 1.7% for AGIs below $25k, 6.3% for AGIs $25k-50k, 25.7% for AGIs $50k-75k, 45.9% for AGIs $75k-100k, 160.2% for AGIs $100k-200k, 8584.3% for AGIs over 200k)
Profit/loss from business: +$5,090 (reported on 23.5% of returns)
Here:
+$5,090
State:
+$10,888
(% of AGI for various income ranges: 25.7% for AGIs below $25k, 5.5% for AGIs $25k-50k, 121.0% for AGIs $50k-75k, 210.8% for AGIs $75k-100k, 295.4% for AGIs $100k-200k, 2810.9% for AGIs over 200k)
Taxable individual retirement arrangement distribution: $19,453 (reported on 4.9% of returns)
75126:
$19,453
Texas:
$24,740
(% of AGI for various income ranges: 25.4% for AGIs below $25k, 42.5% for AGIs $25k-50k, 84.6% for AGIs $50k-75k, 146.8% for AGIs $75k-100k, 295.2% for AGIs $100k-200k, 1399.1% for AGIs over 200k)
Self-employed (Keogh) retirement plans: $20,350 (reported on 0.2% of returns)
75126:
$20,350
Texas:
$29,298
(% of AGI for various income ranges: 11.5% for AGIs $75k-100k, 188.7% for AGIs over 200k)
Total itemized deductions: $30,903 (reported on 12.0% of returns)
Here:
$30,903
State:
$40,428
(% of AGI for various income ranges: 46.7% for AGIs below $25k, 191.4% for AGIs $25k-50k, 486.9% for AGIs $50k-75k, 639.4% for AGIs $75k-100k, 981.3% for AGIs $100k-200k, 5296.3% for AGIs over 200k)
Charity contributions: $10,997 (reported on 9.5% of returns)
Here:
$10,997
State:
$18,201
(% of AGI for various income ranges: 5.7% for AGIs below $25k, 32.4% for AGIs $25k-50k, 94.9% for AGIs $50k-75k, 138.5% for AGIs $75k-100k, 292.8% for AGIs $100k-200k, 2464.3% for AGIs over 200k)
Taxes paid: $7,635 (reported on 11.8% of returns)
75126:
$7,635
State:
$7,821
(% of AGI for various income ranges: 12.2% for AGIs below $25k, 46.2% for AGIs $25k-50k, 132.0% for AGIs $50k-75k, 169.4% for AGIs $75k-100k, 256.5% for AGIs $100k-200k, 907.8% for AGIs over 200k)
Earned income credit: $2,694 (reported on 16.4% of returns)
Here:
$2,694
State:
$2,584
(% of AGI for various income ranges: 132.4% for AGIs below $25k, 91.0% for AGIs $25k-50k, 1.7% for AGIs $50k-75k)
Percentage of individuals using paid preparers for their 2020 taxes: 94.2%
Here:
94%
State:
92%
(% for various income ranges: 93.3% for AGIs below $25k, 94.2% for AGIs $25k-50k, 94.4% for AGIs $50k-75k, 94.8% for AGIs $75k-100k, 94.7% for AGIs $100k-200k, 94.9% for AGIs over 200k)
Averages for the 2012 tax year for zip code 75126, filed in 2013:
Average Adjusted Gross Income (AGI) in 2012: $66,738 (Individual Income Tax Returns)
Here:
$66,738
State:
$65,384
Salary/wage: $60,800 (reported on 90.1% of returns)
Here:
$60,800
State:
$52,524
(% of AGI for various income ranges: 78.3% for AGIs below $25k, 88.0% for AGIs $25k-50k, 87.2% for AGIs $50k-75k, 89.0% for AGIs $75k-100k, 87.6% for AGIs $100k-200k, 50.9% for AGIs over 200k)
Taxable interest for individuals: $1,800 (reported on 24.8% of returns)
This zip code:
$1,800
Texas:
$2,372
(% of AGI for various income ranges: 0.8% for AGIs below $25k, 0.3% for AGIs $25k-50k, 0.4% for AGIs $50k-75k, 0.3% for AGIs $75k-100k, 0.2% for AGIs $100k-200k, 2.7% for AGIs over 200k)
Ordinary dividends: $2,878 (reported on 11.6% of returns)
Here:
$2,878
State:
$9,721
(% of AGI for various income ranges: 1.1% for AGIs below $25k, 0.4% for AGIs $25k-50k, 0.2% for AGIs $50k-75k, 0.3% for AGIs $75k-100k, 0.3% for AGIs $100k-200k, 1.3% for AGIs over 200k)
Net capital gain/loss in AGI: +$10,592 (reported on 9.1% of returns)
Here:
+$10,592
State:
+$35,319
(% of AGI for various income ranges: 0.2% for AGIs $75k-100k, 0.4% for AGIs $100k-200k, 8.7% for AGIs over 200k)
Profit/loss from business: +$9,384 (reported on 20.6% of returns)
Here:
+$9,384
State:
+$13,732
(% of AGI for various income ranges: 9.1% for AGIs below $25k, 2.7% for AGIs $25k-50k, 2.2% for AGIs $50k-75k, 1.9% for AGIs $75k-100k, 2.2% for AGIs $100k-200k, 4.8% for AGIs over 200k)
Taxable individual retirement arrangement distribution: $14,839 (reported on 6.5% of returns)
75126:
$14,839
Texas:
$19,511
(% of AGI for various income ranges: 2.7% for AGIs below $25k, 1.5% for AGIs $25k-50k, 1.4% for AGIs $50k-75k, 1.3% for AGIs $75k-100k, 1.5% for AGIs $100k-200k, 1.1% for AGIs over 200k)
Self-employment retirement plans: $17,425 (reported on 0.2% of returns)
75126:
$17,425
Texas:
$23,938
Total itemized deductions: $20,031 (21% of AGI, reported on 44.5% of returns)
Here:
$20,031
State:
$24,724
Here:
20.6% of AGI
State:
15.9% of AGI
(% of AGI for various income ranges: 11.5% for AGIs below $25k, 15.2% for AGIs $25k-50k, 15.8% for AGIs $50k-75k, 14.5% for AGIs $75k-100k, 13.5% for AGIs $100k-200k, 7.8% for AGIs over 200k)
Charity contributions: $4,220 (reported on 33.8% of returns)
Here:
$4,220
State:
$6,808
(% of AGI for various income ranges: 1.0% for AGIs below $25k, 1.7% for AGIs $25k-50k, 2.2% for AGIs $50k-75k, 2.2% for AGIs $75k-100k, 2.4% for AGIs $100k-200k, 2.1% for AGIs over 200k)
Taxes paid: $5,761 (reported on 43.9% of returns)
75126:
$5,761
State:
$6,921
(% of AGI for various income ranges: 2.7% for AGIs below $25k, 3.9% for AGIs $25k-50k, 4.4% for AGIs $50k-75k, 4.1% for AGIs $75k-100k, 4.1% for AGIs $100k-200k, 2.1% for AGIs over 200k)
Earned income credit: $2,251 (reported on 14.9% of returns)
Here:
$2,251
State:
$2,570
(% of AGI for various income ranges: 7.1% for AGIs below $25k, 1.3% for AGIs $25k-50k)
Percentage of individuals using paid preparers for their 2012 taxes: 46.3%
Here:
46%
State:
51%
(% for various income ranges: 43.4% for AGIs below $25k, 45.6% for AGIs $25k-50k, 46.6% for AGIs $50k-75k, 45.5% for AGIs $75k-100k, 48.9% for AGIs $100k-200k, 71.4% for AGIs over 200k)
Averages for the 2004 tax year for zip code 75126, filed in 2005:
Average Adjusted Gross Income (AGI) in 2004: $57,302 (Individual Income Tax Returns)
Here:
$57,302
State:
$47,881
Salary/wage: $53,875 (reported on 89.7% of returns)
Here:
$53,875
State:
$41,947
(% of AGI for various income ranges: 123.9% for AGIs below $10k, 78.9% for AGIs $10k-25k, 88.3% for AGIs $25k-50k, 89.3% for AGIs $50k-75k, 90.6% for AGIs $75k-100k, 75.6% for AGIs over 100k)
Taxable interest for individuals: $1,601 (reported on 37.2% of returns)
This zip code:
$1,601
Texas:
$2,255
(% of AGI for various income ranges: 8.5% for AGIs below $10k, 1.8% for AGIs $10k-25k, 0.8% for AGIs $25k-50k, 0.5% for AGIs $50k-75k, 0.4% for AGIs $75k-100k, 1.6% for AGIs over 100k)
Taxable dividends: $1,154 (reported on 17.0% of returns)
Here:
$1,154
State:
$4,261
(% of AGI for various income ranges: 3.5% for AGIs below $10k, 0.8% for AGIs $10k-25k, 0.3% for AGIs $25k-50k, 0.2% for AGIs $50k-75k, 0.2% for AGIs $75k-100k, 0.4% for AGIs over 100k)
Net capital gain/loss: +$12,437 (reported on 14.3% of returns)
Here:
+$12,437
State:
+$16,110
(% of AGI for various income ranges: -1.1% for AGIs below $10k, 0.0% for AGIs $10k-25k, 0.2% for AGIs $25k-50k, 0.5% for AGIs $50k-75k, 0.7% for AGIs $75k-100k, 7.9% for AGIs over 100k)
Profit/loss from business: +$9,126 (reported on 21.2% of returns)
Here:
+$9,126
State:
+$11,013
(% of AGI for various income ranges: 11.6% for AGIs below $10k, 7.9% for AGIs $10k-25k, 3.5% for AGIs $25k-50k, 2.5% for AGIs $50k-75k, 2.3% for AGIs $75k-100k, 3.7% for AGIs over 100k)
IRA payment deduction: $3,005 (reported on 2.3% of returns)
75126:
$3,005
Texas:
$3,120
(% of AGI for various income ranges: 0.2% for AGIs $10k-25k, 0.1% for AGIs $25k-50k, 0.1% for AGIs $50k-75k, 0.1% for AGIs $75k-100k, 0.1% for AGIs over 100k)
Self-employed pension: $13,590 (reported on 0.5% of returns)
Here:
$13,590
Texas:
$16,401
Total itemized deductions: $18,079 (22% of AGI, reported on 48.1% of returns)
Here:
$18,079
State:
$19,631
Here:
22.2% of AGI
State:
18.9% of AGI
(% of AGI for various income ranges: 17.0% for AGIs below $10k, 13.0% for AGIs $10k-25k, 16.5% for AGIs $25k-50k, 16.4% for AGIs $50k-75k, 16.8% for AGIs $75k-100k, 13.1% for AGIs over 100k)
Charity contributions deductions: $3,562 (4% of AGI, reported on 38.1% of returns)
Here:
$3,562
State:
$4,753
Here:
4.2% of AGI
State:
4.2% of AGI
(% of AGI for various income ranges: 0.9% for AGIs below $10k, 1.5% for AGIs $10k-25k, 2.0% for AGIs $25k-50k, 2.2% for AGIs $50k-75k, 2.4% for AGIs $75k-100k, 2.7% for AGIs over 100k)
Total tax: $7,798 (reported on 81.2% of returns)
75126:
$7,798
State:
$9,058
(% of AGI for various income ranges: 4.8% for AGIs below $10k, 4.5% for AGIs $10k-25k, 6.1% for AGIs $25k-50k, 7.9% for AGIs $50k-75k, 9.7% for AGIs $75k-100k, 16.9% for AGIs over 100k)
Earned income credit: $1,801 (reported on 10.8% of returns)
Here:
$1,801
State:
$2,024
Percentage of individuals using paid preparers for their 2004 taxes: 53.5%
Here:
53%
State:
57%
(% for various income ranges: 44.5% for AGIs below $10k, 58.2% for AGIs $10k-25k, 53.1% for AGIs $25k-50k, 54.3% for AGIs $50k-75k, 53.0% for AGIs $75k-100k, 57.5% for AGIs over 100k)
Likely homosexual households (counted as self-reported same-sex unmarried-partner households)
Lesbian couples: 0.1% of all households
Gay men: 0.1% of all households
Household received Food Stamps/SNAP in the past 12 months: 1,965 Household did not receive Food Stamps/SNAP in the past 12 months: 20,492
Women who had a birth in the past 12 months: 1,380 (988 now married, 393 unmarried) Women who did not have a birth in the past 12 months: 17,376 (8,741 now married, 8,600 unmarried)
Housing units in zip code 75126 with a mortgage: 13,674 (666 second mortgage, 371 both second mortgage and home equity loan) Houses without a mortgage: 111
Median monthly owner costs for units with a mortgage: $2,223 Median monthly owner costs for units without a mortgage: $944
Residents with income below the poverty level in 2022:
This zip code:
7.4%
Whole state:
14.0%
Residents with income below 50% of the poverty level in 2022:
This zip code:
3.9%
Whole state:
7.4%
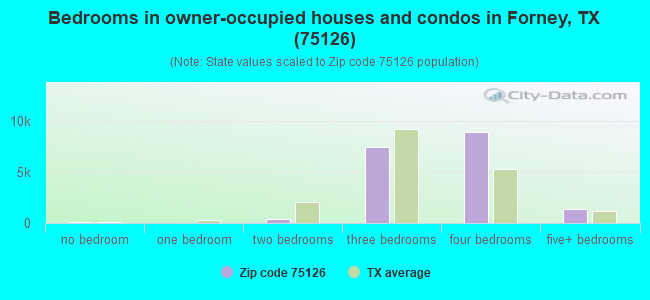
Median number of rooms in houses and condos:
Here:
7.0
State:
6.3
Median number of rooms in apartments:
Here:
4.7
State:
4.0
Notable locations in this zip code not listed on our city pages
Notable locations in zip code 75126: City of Garland Duck Creek Wastewater Treatment Plant (A), Forney Fire Department (B), Forney Emergency Medical Service (C), William and Blanche Brooks House (D). Display/hide their locations on the map
Churches in zip code 75126 include: Friendship Church (A), First Presbyterian Church (B), Little Flock Baptist Church (C), Mount Rose Church (D). Display/hide their locations on the map
Cemeteries: Newton Cemetery (1), Prairie View Cemetery (2), Pleasant Spring Cemetery (3), Shipley Cemetery (4), Hillcrest Cemetery (5). Display/hide their locations on the map
Lakes and reservoirs: Daugherty Lake (A), Thompson Slough (B), University Park Lake (C), Lower East Fork Lateral Site Number One (D), Soil Conservation Service Site 19 Reservoir (E), Soil Conservation Service Site 18 Reservoir (F), Soil Conservation Service Site 21a Reservoir (G), Soil Conservation Service Site 9 Reservoir (H). Display/hide their locations on the map
Streams, rivers, and creeks: Duck Creek (A), High Point Creek (B), Long Branch (C), Long Creek (D), Buffalo Creek (E). Display/hide their locations on the map
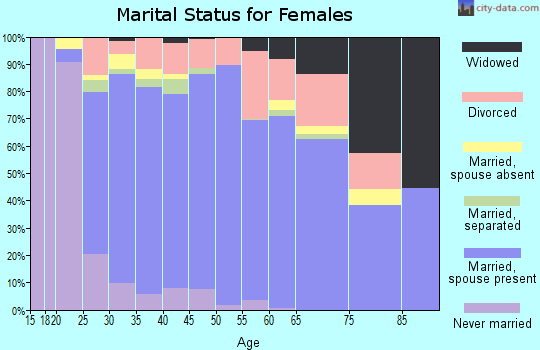
14,446 married couples with children.
4,214 single-parent households (1,089 men, 3,125 women).
80.6% of residents of 75126 zip code speak English at home.
11.9% of residents speak Spanish at home (75% very well, 20% well, 3% not well, 1% not at all).
1.8% of residents speak other Indo-European language at home (66% very well, 21% well, 7% not well, 7% not at all).
1.8% of residents speak Asian or Pacific Island language at home (61% very well, 34% well, 5% not well).
3.7% of residents speak other language at home (87% very well, 13% well, 1% not well).
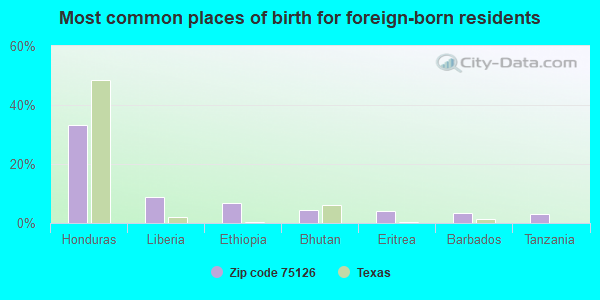
Foreign born population: 7,350 (10.5%) (59.1% of them are naturalized citizens)
This zip code:
10.5%
Whole state:
17.2%
33%Honduras
9%Liberia
7%Ethiopia
4%Bhutan
4%Eritrea
3%Barbados
3%Tanzania
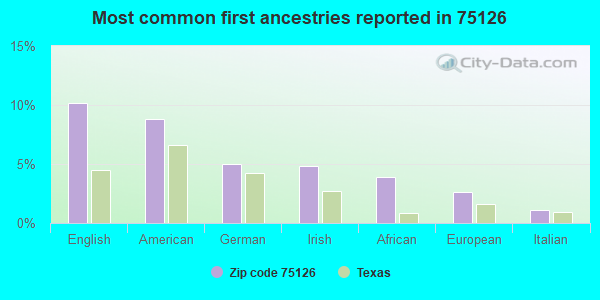
10%English
9%American
5%German
5%Irish
4%African
3%European
1%Italian
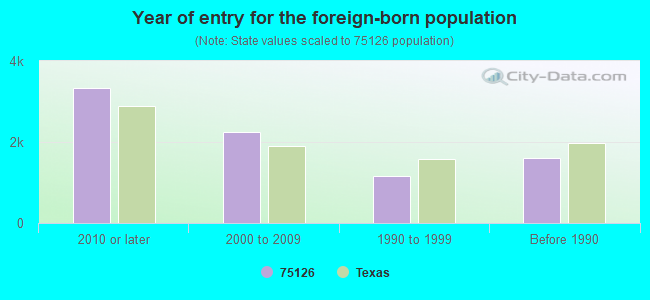
Year of entry for the foreign-born population
3,3362010 or later
2,2552000 to 2009
1,1721990 to 1999
1,594Before 1990
Facilities with environmental interests located in this zip code:
A E P (600 S BOIS D'ARC ST in FORNEY, TX)
(National Center for Education Statistics) - STATE ID-129902002 Organizations: FORNEY ISD (SCHOOL DISTRICT)
Housing units lacking complete plumbing facilities: 0.3% Housing units lacking complete kitchen facilities: 0.3%
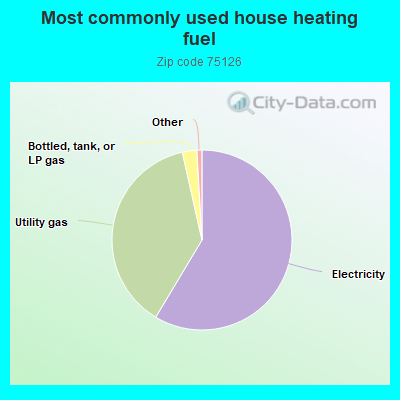
58.6%Electricity
37.9%Utility gas
2.6%Bottled, tank, or LP gas
Population in 1990: 6,803. Population change in the 1990s: +3,893 (+57.2%).
Place of birth for U.S.-born residents:
This state: 43,656
Northeast: 1,564
Midwest: 4,624
South: 6,398
West: 5,148
49% of the 75126 zip code residents lived in the same house 5 years ago. Out of people who lived in different houses, 26% lived in this county. Out of people who lived in different counties, 50% lived in Texas.
81% of the 75126 zip code residents lived in the same house 1 year ago. Out of people who lived in different houses, 21% moved from this county. Out of people who lived in different houses, 65% moved from different county within same state. Out of people who lived in different houses, 14% moved from different state. Out of people who lived in different houses, 2% moved from abroad.
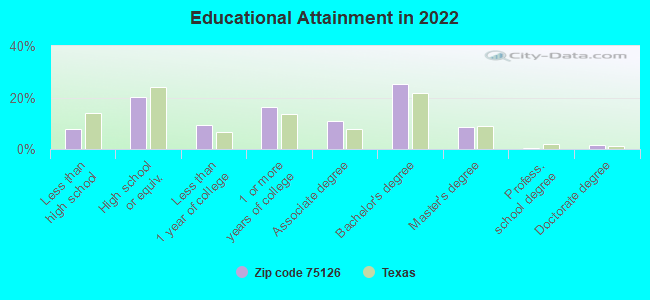
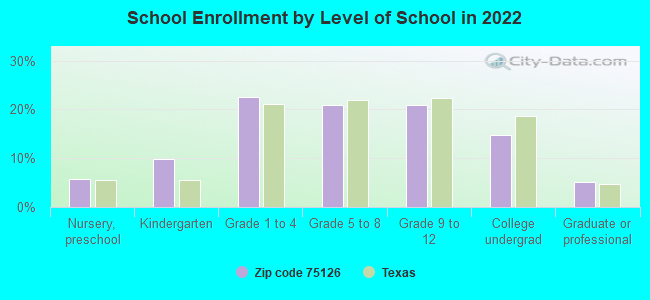
Private vs. public school enrollment:
Students in private schools in grades 1 to 8 (elementary and middle school): 1,185
Here:
13.0%
Texas:
8.8%
Students in private schools in grades 9 to 12 (high school): 314
Here:
7.2%
Texas:
8.0%
Students in private undergraduate colleges: 635
Here:
20.4%
Texas:
16.2%
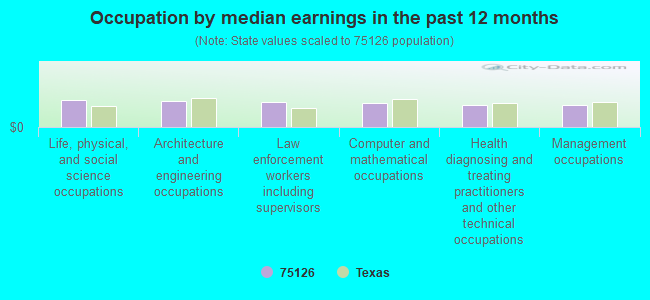
Occupation by median earnings in the past 12 months ($)
99,890Life, physical, and social science occupations
96,250Architecture and engineering occupations
92,879Law enforcement workers including supervisors
87,195Computer and mathematical occupations
81,556Health diagnosing and treating practitioners and other technical occupations
81,200Management occupations
Companies with federal contracts located in this zip code:
AIRCRAFT DUCTING REPAIR INCORP (101 HUNTERS CIRCLE in FORNEY, TX; small business) : $45,643 in 10 contractsfrom 2004 to 2006
Contracts for Hose and Flexible Tubing, Miscellaneous Aircraft Accessories and Components, Aircraft Air Conditioning, Heating, and Pressurizing Equipment, Airframe Structural Components by Army, Air Force Signed by year:2000: $0; 2001: $0; 2002: $0; 2003: $0; 2004: $15,731; 2005: $16,640; 2006: $13,272.
Biggest contracts:
$8,180 with Army for Hose and Flexible Tubing. Taking place in NM. Signed on 2004-08-31. Completion date: 2004-09-30.
$7,365 with Army for Miscellaneous Aircraft Accessories and Components. Signed on 2005-12-13. Completion date: 2005-12-13.
$5,760 with Air Force for Aircraft Air Conditioning, Heating, and Pressurizing Equipment. Signed on 2004-04-28. Completion date: 2004-05-03.
$4,900 with Army for Airframe Structural Components. Signed on 2006-02-08. Completion date: 2006-02-28.
THERMA DATA, INC. (P.O. BOX 579 in FORNEY, TX; small business) : $4,070 in 2 contractsin 2005
$3,996 with Bureau of Prisoners/Federal Prison System for Notions and Apparel Findings. Signed on 2005-07-14. Completion date: 2005-08-15.
$74, same as above.Signed on 2005-08-11. Completion date: 2005-08-31.
Top industries in this zip code by the number of employees in 2005:
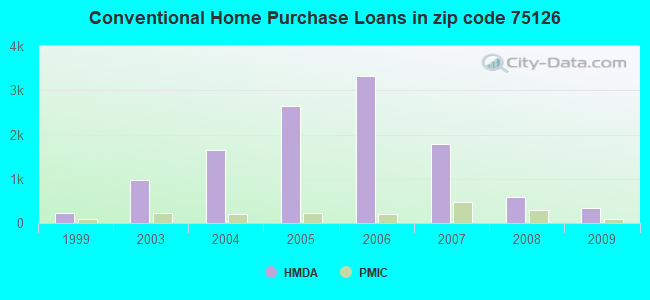
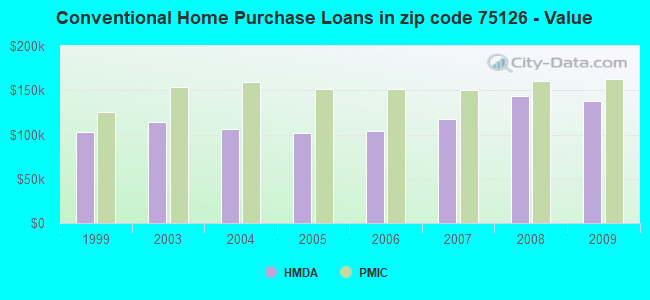
Detailed PMIC statistics for the following Tracts:0502.01
, 0502.02
2004 - 2018 National Fire Incident Reporting System (NFIRS) incidents
Based on the data from the years 2004 - 2018 the average number of fire incidents per year is 112. The highest number of fire incidents - 164 took place in 2005, and the least - 45 in 2007. The data has a growing trend.
When looking into fire subcategories, the most incidents belonged to: Outside Fires (58.7%), and Structure Fires (19.6%).
Fire incident types reported to NFIRS in Zip Code 75126


 Nearest zip codes: 75181, 75182, 75032, 75114, 75160, 75159.


 Based on the data from the years 2004 - 2018 the average number of fire incidents per year is 112. The highest number of fire incidents - 164 took place in 2005, and the least - 45 in 2007. The data has a growing trend.
 When looking into fire subcategories, the most incidents belonged to: Outside Fires (58.7%), and Structure Fires (19.6%).