Cities: Seagoville, TX (29.06%) ,
Combine, TX (10.74%) ,
Dallas, TX (0.70%) ,
Mesquite, TX (0.04%) Counties: Dallas County, TX (64.27%) ,
Kaufman County, TX (35.73%) Estimated zip code population in 2022: 23,362
Zip code population in 2010: 18,339
Zip code population in 2000: 14,381
Houses and condos: 7,258
Renter-occupied apartments: 1,390
% of renters here:
20%State:
38%
March 2022 cost of living index in zip code 75159: 94.0
(less than average, U.S. average is 100)
Land area: 59.8
sq. mi.
Water area: 5.1
sq. mi.
Population density: 391 people per square mile (very low).
OSM Map
General Map
Google Map
MSN Map
OSM Map
General Map
Google Map
MSN Map
OSM Map
General Map
Google Map
MSN Map
OSM Map
General Map
Google Map
MSN Map
Please wait while loading the map...
Real estate property taxes paid for housing units in 2022:
This zip code:
1.4% ($3,303)Texas:
1.5% ($4,050)
Median real estate property taxes paid for housing units with mortgages in 2022: $3,982 (1.6%)
Median real estate property taxes paid for housing units with no mortgage in 2022: $2,265 (1.2%)
Profiles of local businesses
Business Search - 14 Million verified businesses
Males: 12,788 Females: 10,574
For population 25 years and over in 75159:
High school or higher: 74.2%Bachelor's degree or higher: 14.3%Graduate or professional degree: 3.5%Unemployed: 6.1%Mean travel time to work (commute): 39.0 minutes
For population 15 years and over in 75159:
Never married: 39.7%Now married: 41.8%Separated: 1.2%Widowed: 5.0%Divorced: 12.2%
Zip code 75159 compared to state average:
Renting percentage below state average. Length of stay since moving in significantly above state average. Percentage of population with a bachelor's degree or higher significantly below state average. 11,128 47.6% Hispanic or Latino 7,923 33.9% White 3,344 14.3% Black 627 2.7% Two or more races 138 0.6% American Indian 147 0.6% Asian 37 0.2% Some other race 14 0.06% Native Hawaiian and Other
Data:
Median household income ($)
Median household income (% change since 2000)
Household income diversity
Ratio of average income to average house value (%)
Ratio of average income to average rent
Median household income ($) - White
Median household income ($) - Black or African American
Median household income ($) - Asian
Median household income ($) - Hispanic or Latino
Median household income ($) - American Indian and Alaska Native
Median household income ($) - Multirace
Median household income ($) - Other Race
Median household income for houses/condos with a mortgage ($)
Median household income for apartments without a mortgage ($)
Races - White alone (%)
Races - White alone (% change since 2000)
Races - Black alone (%)
Races - Black alone (% change since 2000)
Races - American Indian alone (%)
Races - American Indian alone (% change since 2000)
Races - Asian alone (%)
Races - Asian alone (% change since 2000)
Races - Hispanic (%)
Races - Hispanic (% change since 2000)
Races - Native Hawaiian and Other Pacific Islander alone (%)
Races - Native Hawaiian and Other Pacific Islander alone (% change since 2000)
Races - Two or more races (%)
Races - Two or more races (% change since 2000)
Races - Other race alone (%)
Races - Other race alone (% change since 2000)
Racial diversity
Unemployment (%)
Unemployment (% change since 2000)
Unemployment (%) - White
Unemployment (%) - Black or African American
Unemployment (%) - Asian
Unemployment (%) - Hispanic or Latino
Unemployment (%) - American Indian and Alaska Native
Unemployment (%) - Multirace
Unemployment (%) - Other Race
Population density (people per square mile)
Population - Males (%)
Population - Females (%)
Population - Males (%) - White
Population - Males (%) - Black or African American
Population - Males (%) - Asian
Population - Males (%) - Hispanic or Latino
Population - Males (%) - American Indian and Alaska Native
Population - Males (%) - Multirace
Population - Males (%) - Other Race
Population - Females (%) - White
Population - Females (%) - Black or African American
Population - Females (%) - Asian
Population - Females (%) - Hispanic or Latino
Population - Females (%) - American Indian and Alaska Native
Population - Females (%) - Multirace
Population - Females (%) - Other Race
Coronavirus confirmed cases (Apr 27, 2024)
Deaths caused by coronavirus (Apr 27, 2024)
Coronavirus confirmed cases (per 100k population) (Apr 27, 2024)
Deaths caused by coronavirus (per 100k population) (Apr 27, 2024)
Daily increase in number of cases (Apr 27, 2024)
Weekly increase in number of cases (Apr 27, 2024)
Cases doubled (in days) (Apr 27, 2024)
Hospitalized patients (Apr 18, 2022)
Negative test results (Apr 18, 2022)
Total test results (Apr 18, 2022)
COVID Vaccine doses distributed (per 100k population) (Sep 19, 2023)
COVID Vaccine doses administered (per 100k population) (Sep 19, 2023)
COVID Vaccine doses distributed (Sep 19, 2023)
COVID Vaccine doses administered (Sep 19, 2023)
Likely homosexual households (%)
Likely homosexual households (% change since 2000)
Likely homosexual households - Lesbian couples (%)
Likely homosexual households - Lesbian couples (% change since 2000)
Likely homosexual households - Gay men (%)
Likely homosexual households - Gay men (% change since 2000)
Cost of living index
Median gross rent ($)
Median contract rent ($)
Median monthly housing costs ($)
Median house or condo value ($)
Median house or condo value ($ change since 2000)
Mean house or condo value by units in structure - 1, detached ($)
Mean house or condo value by units in structure - 1, attached ($)
Mean house or condo value by units in structure - 2 ($)
Mean house or condo value by units in structure by units in structure - 3 or 4 ($)
Mean house or condo value by units in structure - 5 or more ($)
Mean house or condo value by units in structure - Boat, RV, van, etc. ($)
Mean house or condo value by units in structure - Mobile home ($)
Median house or condo value ($) - White
Median house or condo value ($) - Black or African American
Median house or condo value ($) - Asian
Median house or condo value ($) - Hispanic or Latino
Median house or condo value ($) - American Indian and Alaska Native
Median house or condo value ($) - Multirace
Median house or condo value ($) - Other Race
Median resident age
Resident age diversity
Median resident age - Males
Median resident age - Females
Median resident age - White
Median resident age - Black or African American
Median resident age - Asian
Median resident age - Hispanic or Latino
Median resident age - American Indian and Alaska Native
Median resident age - Multirace
Median resident age - Other Race
Median resident age - Males - White
Median resident age - Males - Black or African American
Median resident age - Males - Asian
Median resident age - Males - Hispanic or Latino
Median resident age - Males - American Indian and Alaska Native
Median resident age - Males - Multirace
Median resident age - Males - Other Race
Median resident age - Females - White
Median resident age - Females - Black or African American
Median resident age - Females - Asian
Median resident age - Females - Hispanic or Latino
Median resident age - Females - American Indian and Alaska Native
Median resident age - Females - Multirace
Median resident age - Females - Other Race
Commute - mean travel time to work (minutes)
Travel time to work - Less than 5 minutes (%)
Travel time to work - Less than 5 minutes (% change since 2000)
Travel time to work - 5 to 9 minutes (%)
Travel time to work - 5 to 9 minutes (% change since 2000)
Travel time to work - 10 to 19 minutes (%)
Travel time to work - 10 to 19 minutes (% change since 2000)
Travel time to work - 20 to 29 minutes (%)
Travel time to work - 20 to 29 minutes (% change since 2000)
Travel time to work - 30 to 39 minutes (%)
Travel time to work - 30 to 39 minutes (% change since 2000)
Travel time to work - 40 to 59 minutes (%)
Travel time to work - 40 to 59 minutes (% change since 2000)
Travel time to work - 60 to 89 minutes (%)
Travel time to work - 60 to 89 minutes (% change since 2000)
Travel time to work - 90 or more minutes (%)
Travel time to work - 90 or more minutes (% change since 2000)
Marital status - Never married (%)
Marital status - Now married (%)
Marital status - Separated (%)
Marital status - Widowed (%)
Marital status - Divorced (%)
Median family income ($)
Median family income (% change since 2000)
Median non-family income ($)
Median non-family income (% change since 2000)
Median per capita income ($)
Median per capita income (% change since 2000)
Median family income ($) - White
Median family income ($) - Black or African American
Median family income ($) - Asian
Median family income ($) - Hispanic or Latino
Median family income ($) - American Indian and Alaska Native
Median family income ($) - Multirace
Median family income ($) - Other Race
Median year house/condo built
Median year apartment built
Year house built - Built 2005 or later (%)
Year house built - Built 2000 to 2004 (%)
Year house built - Built 1990 to 1999 (%)
Year house built - Built 1980 to 1989 (%)
Year house built - Built 1970 to 1979 (%)
Year house built - Built 1960 to 1969 (%)
Year house built - Built 1950 to 1959 (%)
Year house built - Built 1940 to 1949 (%)
Year house built - Built 1939 or earlier (%)
Average household size
Household density (households per square mile)
Average household size - White
Average household size - Black or African American
Average household size - Asian
Average household size - Hispanic or Latino
Average household size - American Indian and Alaska Native
Average household size - Multirace
Average household size - Other Race
Occupied housing units (%)
Vacant housing units (%)
Owner occupied housing units (%)
Renter occupied housing units (%)
Vacancy status - For rent (%)
Vacancy status - For sale only (%)
Vacancy status - Rented or sold, not occupied (%)
Vacancy status - For seasonal, recreational, or occasional use (%)
Vacancy status - For migrant workers (%)
Vacancy status - Other vacant (%)
Residents with income below the poverty level (%)
Residents with income below 50% of the poverty level (%)
Children below poverty level (%)
Poor families by family type - Married-couple family (%)
Poor families by family type - Male, no wife present (%)
Poor families by family type - Female, no husband present (%)
Poverty status for native-born residents (%)
Poverty status for foreign-born residents (%)
Poverty among high school graduates not in families (%)
Poverty among people who did not graduate high school not in families (%)
Residents with income below the poverty level (%) - White
Residents with income below the poverty level (%) - Black or African American
Residents with income below the poverty level (%) - Asian
Residents with income below the poverty level (%) - Hispanic or Latino
Residents with income below the poverty level (%) - American Indian and Alaska Native
Residents with income below the poverty level (%) - Multirace
Residents with income below the poverty level (%) - Other Race
Air pollution - Air Quality Index (AQI)
Air pollution - CO
Air pollution - NO2
Air pollution - SO2
Air pollution - Ozone
Air pollution - PM10
Air pollution - PM25
Air pollution - Pb
Crime - Murders per 100,000 population
Crime - Rapes per 100,000 population
Crime - Robberies per 100,000 population
Crime - Assaults per 100,000 population
Crime - Burglaries per 100,000 population
Crime - Thefts per 100,000 population
Crime - Auto thefts per 100,000 population
Crime - Arson per 100,000 population
Crime - City-data.com crime index
Crime - Violent crime index
Crime - Property crime index
Crime - Murders per 100,000 population (5 year average)
Crime - Rapes per 100,000 population (5 year average)
Crime - Robberies per 100,000 population (5 year average)
Crime - Assaults per 100,000 population (5 year average)
Crime - Burglaries per 100,000 population (5 year average)
Crime - Thefts per 100,000 population (5 year average)
Crime - Auto thefts per 100,000 population (5 year average)
Crime - Arson per 100,000 population (5 year average)
Crime - City-data.com crime index (5 year average)
Crime - Violent crime index (5 year average)
Crime - Property crime index (5 year average)
1996 Presidential Elections Results (%) - Democratic Party (Clinton)
1996 Presidential Elections Results (%) - Republican Party (Dole)
1996 Presidential Elections Results (%) - Other
2000 Presidential Elections Results (%) - Democratic Party (Gore)
2000 Presidential Elections Results (%) - Republican Party (Bush)
2000 Presidential Elections Results (%) - Other
2004 Presidential Elections Results (%) - Democratic Party (Kerry)
2004 Presidential Elections Results (%) - Republican Party (Bush)
2004 Presidential Elections Results (%) - Other
2008 Presidential Elections Results (%) - Democratic Party (Obama)
2008 Presidential Elections Results (%) - Republican Party (McCain)
2008 Presidential Elections Results (%) - Other
2012 Presidential Elections Results (%) - Democratic Party (Obama)
2012 Presidential Elections Results (%) - Republican Party (Romney)
2012 Presidential Elections Results (%) - Other
2016 Presidential Elections Results (%) - Democratic Party (Clinton)
2016 Presidential Elections Results (%) - Republican Party (Trump)
2016 Presidential Elections Results (%) - Other
2020 Presidential Elections Results (%) - Democratic Party (Biden)
2020 Presidential Elections Results (%) - Republican Party (Trump)
2020 Presidential Elections Results (%) - Other
Ancestries Reported - Arab (%)
Ancestries Reported - Czech (%)
Ancestries Reported - Danish (%)
Ancestries Reported - Dutch (%)
Ancestries Reported - English (%)
Ancestries Reported - French (%)
Ancestries Reported - French Canadian (%)
Ancestries Reported - German (%)
Ancestries Reported - Greek (%)
Ancestries Reported - Hungarian (%)
Ancestries Reported - Irish (%)
Ancestries Reported - Italian (%)
Ancestries Reported - Lithuanian (%)
Ancestries Reported - Norwegian (%)
Ancestries Reported - Polish (%)
Ancestries Reported - Portuguese (%)
Ancestries Reported - Russian (%)
Ancestries Reported - Scotch-Irish (%)
Ancestries Reported - Scottish (%)
Ancestries Reported - Slovak (%)
Ancestries Reported - Subsaharan African (%)
Ancestries Reported - Swedish (%)
Ancestries Reported - Swiss (%)
Ancestries Reported - Ukrainian (%)
Ancestries Reported - United States (%)
Ancestries Reported - Welsh (%)
Ancestries Reported - West Indian (%)
Ancestries Reported - Other (%)
Educational Attainment - No schooling completed (%)
Educational Attainment - Less than high school (%)
Educational Attainment - High school or equivalent (%)
Educational Attainment - Less than 1 year of college (%)
Educational Attainment - 1 or more years of college (%)
Educational Attainment - Associate degree (%)
Educational Attainment - Bachelor's degree (%)
Educational Attainment - Master's degree (%)
Educational Attainment - Professional school degree (%)
Educational Attainment - Doctorate degree (%)
School Enrollment - Nursery, preschool (%)
School Enrollment - Kindergarten (%)
School Enrollment - Grade 1 to 4 (%)
School Enrollment - Grade 5 to 8 (%)
School Enrollment - Grade 9 to 12 (%)
School Enrollment - College undergrad (%)
School Enrollment - Graduate or professional (%)
School Enrollment - Not enrolled in school (%)
School enrollment - Public schools (%)
School enrollment - Private schools (%)
School enrollment - Not enrolled (%)
Median number of rooms in houses and condos
Median number of rooms in apartments
Housing units lacking complete plumbing facilities (%)
Housing units lacking complete kitchen facilities (%)
Density of houses
Urban houses (%)
Rural houses (%)
Households with people 60 years and over (%)
Households with people 65 years and over (%)
Households with people 75 years and over (%)
Households with one or more nonrelatives (%)
Households with no nonrelatives (%)
Population in households (%)
Family households (%)
Nonfamily households (%)
Population in families (%)
Family households with own children (%)
Median number of bedrooms in owner occupied houses
Mean number of bedrooms in owner occupied houses
Median number of bedrooms in renter occupied houses
Mean number of bedrooms in renter occupied houses
Median number of vehichles in owner occupied houses
Mean number of vehichles in owner occupied houses
Median number of vehichles in renter occupied houses
Mean number of vehichles in renter occupied houses
Mortgage status - with mortgage (%)
Mortgage status - with second mortgage (%)
Mortgage status - with home equity loan (%)
Mortgage status - with both second mortgage and home equity loan (%)
Mortgage status - without a mortgage (%)
Average family size
Average family size - White
Average family size - Black or African American
Average family size - Asian
Average family size - Hispanic or Latino
Average family size - American Indian and Alaska Native
Average family size - Multirace
Average family size - Other Race
Geographical mobility - Same house 1 year ago (%)
Geographical mobility - Moved within same county (%)
Geographical mobility - Moved from different county within same state (%)
Geographical mobility - Moved from different state (%)
Geographical mobility - Moved from abroad (%)
Place of birth - Born in state of residence (%)
Place of birth - Born in other state (%)
Place of birth - Native, outside of US (%)
Place of birth - Foreign born (%)
Housing units in structures - 1, detached (%)
Housing units in structures - 1, attached (%)
Housing units in structures - 2 (%)
Housing units in structures - 3 or 4 (%)
Housing units in structures - 5 to 9 (%)
Housing units in structures - 10 to 19 (%)
Housing units in structures - 20 to 49 (%)
Housing units in structures - 50 or more (%)
Housing units in structures - Mobile home (%)
Housing units in structures - Boat, RV, van, etc. (%)
House/condo owner moved in on average (years ago)
Renter moved in on average (years ago)
Year householder moved into unit - Moved in 1999 to March 2000 (%)
Year householder moved into unit - Moved in 1995 to 1998 (%)
Year householder moved into unit - Moved in 1990 to 1994 (%)
Year householder moved into unit - Moved in 1980 to 1989 (%)
Year householder moved into unit - Moved in 1970 to 1979 (%)
Year householder moved into unit - Moved in 1969 or earlier (%)
Means of transportation to work - Drove car alone (%)
Means of transportation to work - Carpooled (%)
Means of transportation to work - Public transportation (%)
Means of transportation to work - Bus or trolley bus (%)
Means of transportation to work - Streetcar or trolley car (%)
Means of transportation to work - Subway or elevated (%)
Means of transportation to work - Railroad (%)
Means of transportation to work - Ferryboat (%)
Means of transportation to work - Taxicab (%)
Means of transportation to work - Motorcycle (%)
Means of transportation to work - Bicycle (%)
Means of transportation to work - Walked (%)
Means of transportation to work - Other means (%)
Working at home (%)
Industry diversity
Most Common Industries - Agriculture, forestry, fishing and hunting, and mining (%)
Most Common Industries - Agriculture, forestry, fishing and hunting (%)
Most Common Industries - Mining, quarrying, and oil and gas extraction (%)
Most Common Industries - Construction (%)
Most Common Industries - Manufacturing (%)
Most Common Industries - Wholesale trade (%)
Most Common Industries - Retail trade (%)
Most Common Industries - Transportation and warehousing, and utilities (%)
Most Common Industries - Transportation and warehousing (%)
Most Common Industries - Utilities (%)
Most Common Industries - Information (%)
Most Common Industries - Finance and insurance, and real estate and rental and leasing (%)
Most Common Industries - Finance and insurance (%)
Most Common Industries - Real estate and rental and leasing (%)
Most Common Industries - Professional, scientific, and management, and administrative and waste management services (%)
Most Common Industries - Professional, scientific, and technical services (%)
Most Common Industries - Management of companies and enterprises (%)
Most Common Industries - Administrative and support and waste management services (%)
Most Common Industries - Educational services, and health care and social assistance (%)
Most Common Industries - Educational services (%)
Most Common Industries - Health care and social assistance (%)
Most Common Industries - Arts, entertainment, and recreation, and accommodation and food services (%)
Most Common Industries - Arts, entertainment, and recreation (%)
Most Common Industries - Accommodation and food services (%)
Most Common Industries - Other services, except public administration (%)
Most Common Industries - Public administration (%)
Occupation diversity
Most Common Occupations - Management, business, science, and arts occupations (%)
Most Common Occupations - Management, business, and financial occupations (%)
Most Common Occupations - Management occupations (%)
Most Common Occupations - Business and financial operations occupations (%)
Most Common Occupations - Computer, engineering, and science occupations (%)
Most Common Occupations - Computer and mathematical occupations (%)
Most Common Occupations - Architecture and engineering occupations (%)
Most Common Occupations - Life, physical, and social science occupations (%)
Most Common Occupations - Education, legal, community service, arts, and media occupations (%)
Most Common Occupations - Community and social service occupations (%)
Most Common Occupations - Legal occupations (%)
Most Common Occupations - Education, training, and library occupations (%)
Most Common Occupations - Arts, design, entertainment, sports, and media occupations (%)
Most Common Occupations - Healthcare practitioners and technical occupations (%)
Most Common Occupations - Health diagnosing and treating practitioners and other technical occupations (%)
Most Common Occupations - Health technologists and technicians (%)
Most Common Occupations - Service occupations (%)
Most Common Occupations - Healthcare support occupations (%)
Most Common Occupations - Protective service occupations (%)
Most Common Occupations - Fire fighting and prevention, and other protective service workers including supervisors (%)
Most Common Occupations - Law enforcement workers including supervisors (%)
Most Common Occupations - Food preparation and serving related occupations (%)
Most Common Occupations - Building and grounds cleaning and maintenance occupations (%)
Most Common Occupations - Personal care and service occupations (%)
Most Common Occupations - Sales and office occupations (%)
Most Common Occupations - Sales and related occupations (%)
Most Common Occupations - Office and administrative support occupations (%)
Most Common Occupations - Natural resources, construction, and maintenance occupations (%)
Most Common Occupations - Farming, fishing, and forestry occupations (%)
Most Common Occupations - Construction and extraction occupations (%)
Most Common Occupations - Installation, maintenance, and repair occupations (%)
Most Common Occupations - Production, transportation, and material moving occupations (%)
Most Common Occupations - Production occupations (%)
Most Common Occupations - Transportation occupations (%)
Most Common Occupations - Material moving occupations (%)
People in Group quarters - Institutionalized population (%)
People in Group quarters - Correctional institutions (%)
People in Group quarters - Federal prisons and detention centers (%)
People in Group quarters - Halfway houses (%)
People in Group quarters - Local jails and other confinement facilities (including police lockups) (%)
People in Group quarters - Military disciplinary barracks (%)
People in Group quarters - State prisons (%)
People in Group quarters - Other types of correctional institutions (%)
People in Group quarters - Nursing homes (%)
People in Group quarters - Hospitals/wards, hospices, and schools for the handicapped (%)
People in Group quarters - Hospitals/wards and hospices for chronically ill (%)
People in Group quarters - Hospices or homes for chronically ill (%)
People in Group quarters - Military hospitals or wards for chronically ill (%)
People in Group quarters - Other hospitals or wards for chronically ill (%)
People in Group quarters - Hospitals or wards for drug/alcohol abuse (%)
People in Group quarters - Mental (Psychiatric) hospitals or wards (%)
People in Group quarters - Schools, hospitals, or wards for the mentally retarded (%)
People in Group quarters - Schools, hospitals, or wards for the physically handicapped (%)
People in Group quarters - Institutions for the deaf (%)
People in Group quarters - Institutions for the blind (%)
People in Group quarters - Orthopedic wards and institutions for the physically handicapped (%)
People in Group quarters - Wards in general hospitals for patients who have no usual home elsewhere (%)
People in Group quarters - Wards in military hospitals for patients who have no usual home elsewhere (%)
People in Group quarters - Juvenile institutions (%)
People in Group quarters - Long-term care (%)
People in Group quarters - Homes for abused, dependent, and neglected children (%)
People in Group quarters - Residential treatment centers for emotionally disturbed children (%)
People in Group quarters - Training schools for juvenile delinquents (%)
People in Group quarters - Short-term care, detention or diagnostic centers for delinquent children (%)
People in Group quarters - Type of juvenile institution unknown (%)
People in Group quarters - Noninstitutionalized population (%)
People in Group quarters - College dormitories (includes college quarters off campus) (%)
People in Group quarters - Military quarters (%)
People in Group quarters - On base (%)
People in Group quarters - Barracks, unaccompanied personnel housing (UPH), (Enlisted/Officer), ;and similar group living quarters for military personnel (%)
People in Group quarters - Transient quarters for temporary residents (%)
People in Group quarters - Military ships (%)
People in Group quarters - Group homes (%)
People in Group quarters - Homes or halfway houses for drug/alcohol abuse (%)
People in Group quarters - Homes for the mentally ill (%)
People in Group quarters - Homes for the mentally retarded (%)
People in Group quarters - Homes for the physically handicapped (%)
People in Group quarters - Other group homes (%)
People in Group quarters - Religious group quarters (%)
People in Group quarters - Dormitories (%)
People in Group quarters - Agriculture workers' dormitories on farms (%)
People in Group quarters - Job Corps and vocational training facilities (%)
People in Group quarters - Other workers' dormitories (%)
People in Group quarters - Crews of maritime vessels (%)
People in Group quarters - Other nonhousehold living situations (%)
People in Group quarters - Other noninstitutional group quarters (%)
Residents speaking English at home (%)
Residents speaking English at home - Born in the United States (%)
Residents speaking English at home - Native, born elsewhere (%)
Residents speaking English at home - Foreign born (%)
Residents speaking Spanish at home (%)
Residents speaking Spanish at home - Born in the United States (%)
Residents speaking Spanish at home - Native, born elsewhere (%)
Residents speaking Spanish at home - Foreign born (%)
Residents speaking other language at home (%)
Residents speaking other language at home - Born in the United States (%)
Residents speaking other language at home - Native, born elsewhere (%)
Residents speaking other language at home - Foreign born (%)
Class of Workers - Employee of private company (%)
Class of Workers - Self-employed in own incorporated business (%)
Class of Workers - Private not-for-profit wage and salary workers (%)
Class of Workers - Local government workers (%)
Class of Workers - State government workers (%)
Class of Workers - Federal government workers (%)
Class of Workers - Self-employed workers in own not incorporated business and Unpaid family workers (%)
House heating fuel used in houses and condos - Utility gas (%)
House heating fuel used in houses and condos - Bottled, tank, or LP gas (%)
House heating fuel used in houses and condos - Electricity (%)
House heating fuel used in houses and condos - Fuel oil, kerosene, etc. (%)
House heating fuel used in houses and condos - Coal or coke (%)
House heating fuel used in houses and condos - Wood (%)
House heating fuel used in houses and condos - Solar energy (%)
House heating fuel used in houses and condos - Other fuel (%)
House heating fuel used in houses and condos - No fuel used (%)
House heating fuel used in apartments - Utility gas (%)
House heating fuel used in apartments - Bottled, tank, or LP gas (%)
House heating fuel used in apartments - Electricity (%)
House heating fuel used in apartments - Fuel oil, kerosene, etc. (%)
House heating fuel used in apartments - Coal or coke (%)
House heating fuel used in apartments - Wood (%)
House heating fuel used in apartments - Solar energy (%)
House heating fuel used in apartments - Other fuel (%)
House heating fuel used in apartments - No fuel used (%)
Armed forces status - In Armed Forces (%)
Armed forces status - Civilian (%)
Armed forces status - Civilian - Veteran (%)
Armed forces status - Civilian - Nonveteran (%)
Fatal accidents locations in years 2005-2021
Fatal accidents locations in 2005
Fatal accidents locations in 2006
Fatal accidents locations in 2007
Fatal accidents locations in 2008
Fatal accidents locations in 2009
Fatal accidents locations in 2010
Fatal accidents locations in 2011
Fatal accidents locations in 2012
Fatal accidents locations in 2013
Fatal accidents locations in 2014
Fatal accidents locations in 2015
Fatal accidents locations in 2016
Fatal accidents locations in 2017
Fatal accidents locations in 2018
Fatal accidents locations in 2019
Fatal accidents locations in 2020
Fatal accidents locations in 2021
Alcohol use - People drinking some alcohol every month (%)
Alcohol use - People not drinking at all (%)
Alcohol use - Average days/month drinking alcohol
Alcohol use - Average drinks/week
Alcohol use - Average days/year people drink much
Audiometry - Average condition of hearing (%)
Audiometry - People that can hear a whisper from across a quiet room (%)
Audiometry - People that can hear normal voice from across a quiet room (%)
Audiometry - Ears ringing, roaring, buzzing (%)
Audiometry - Had a job exposure to loud noise (%)
Audiometry - Had off-work exposure to loud noise (%)
Blood Pressure & Cholesterol - Has high blood pressure (%)
Blood Pressure & Cholesterol - Checking blood pressure at home (%)
Blood Pressure & Cholesterol - Frequently checking blood cholesterol (%)
Blood Pressure & Cholesterol - Has high cholesterol level (%)
Consumer Behavior - Money monthly spent on food at supermarket/grocery store
Consumer Behavior - Money monthly spent on food at other stores
Consumer Behavior - Money monthly spent on eating out
Consumer Behavior - Money monthly spent on carryout/delivered foods
Consumer Behavior - Income spent on food at supermarket/grocery store (%)
Consumer Behavior - Income spent on food at other stores (%)
Consumer Behavior - Income spent on eating out (%)
Consumer Behavior - Income spent on carryout/delivered foods (%)
Current Health Status - General health condition (%)
Current Health Status - Blood donors (%)
Current Health Status - Has blood ever tested for HIV virus (%)
Current Health Status - Left-handed people (%)
Dermatology - People using sunscreen (%)
Diabetes - Diabetics (%)
Diabetes - Had a blood test for high blood sugar (%)
Diabetes - People taking insulin (%)
Diet Behavior & Nutrition - Diet health (%)
Diet Behavior & Nutrition - Milk product consumption (# of products/month)
Diet Behavior & Nutrition - Meals not home prepared (#/week)
Diet Behavior & Nutrition - Meals from fast food or pizza place (#/week)
Diet Behavior & Nutrition - Ready-to-eat foods (#/month)
Diet Behavior & Nutrition - Frozen meals/pizza (#/month)
Drug Use - People that ever used marijuana or hashish (%)
Drug Use - Ever used hard drugs (%)
Drug Use - Ever used any form of cocaine (%)
Drug Use - Ever used heroin (%)
Drug Use - Ever used methamphetamine (%)
Health Insurance - People covered by health insurance (%)
Kidney Conditions-Urology - Avg. # of times urinating at night
Medical Conditions - People with asthma (%)
Medical Conditions - People with anemia (%)
Medical Conditions - People with psoriasis (%)
Medical Conditions - People with overweight (%)
Medical Conditions - Elderly people having difficulties in thinking or remembering (%)
Medical Conditions - People who ever received blood transfusion (%)
Medical Conditions - People having trouble seeing even with glass/contacts (%)
Medical Conditions - People with arthritis (%)
Medical Conditions - People with gout (%)
Medical Conditions - People with congestive heart failure (%)
Medical Conditions - People with coronary heart disease (%)
Medical Conditions - People with angina pectoris (%)
Medical Conditions - People who ever had heart attack (%)
Medical Conditions - People who ever had stroke (%)
Medical Conditions - People with emphysema (%)
Medical Conditions - People with thyroid problem (%)
Medical Conditions - People with chronic bronchitis (%)
Medical Conditions - People with any liver condition (%)
Medical Conditions - People who ever had cancer or malignancy (%)
Mental Health - People who have little interest in doing things (%)
Mental Health - People feeling down, depressed, or hopeless (%)
Mental Health - People who have trouble sleeping or sleeping too much (%)
Mental Health - People feeling tired or having little energy (%)
Mental Health - People with poor appetite or overeating (%)
Mental Health - People feeling bad about themself (%)
Mental Health - People who have trouble concentrating on things (%)
Mental Health - People moving or speaking slowly or too fast (%)
Mental Health - People having thoughts they would be better off dead (%)
Oral Health - Average years since last visit a dentist
Oral Health - People embarrassed because of mouth (%)
Oral Health - People with gum disease (%)
Oral Health - General health of teeth and gums (%)
Oral Health - Average days a week using dental floss/device
Oral Health - Average days a week using mouthwash for dental problem
Oral Health - Average number of teeth
Pesticide Use - Households using pesticides to control insects (%)
Pesticide Use - Households using pesticides to kill weeds (%)
Physical Activity - People doing vigorous-intensity work activities (%)
Physical Activity - People doing moderate-intensity work activities (%)
Physical Activity - People walking or bicycling (%)
Physical Activity - People doing vigorous-intensity recreational activities (%)
Physical Activity - People doing moderate-intensity recreational activities (%)
Physical Activity - Average hours a day doing sedentary activities
Physical Activity - Average hours a day watching TV or videos
Physical Activity - Average hours a day using computer
Physical Functioning - People having limitations keeping them from working (%)
Physical Functioning - People limited in amount of work they can do (%)
Physical Functioning - People that need special equipment to walk (%)
Physical Functioning - People experiencing confusion/memory problems (%)
Physical Functioning - People requiring special healthcare equipment (%)
Prescription Medications - Average number of prescription medicines taking
Preventive Aspirin Use - Adults 40+ taking low-dose aspirin (%)
Reproductive Health - Vaginal deliveries (%)
Reproductive Health - Cesarean deliveries (%)
Reproductive Health - Deliveries resulted in a live birth (%)
Reproductive Health - Pregnancies resulted in a delivery (%)
Reproductive Health - Women breastfeeding newborns (%)
Reproductive Health - Women that had a hysterectomy (%)
Reproductive Health - Women that had both ovaries removed (%)
Reproductive Health - Women that have ever taken birth control pills (%)
Reproductive Health - Women taking birth control pills (%)
Reproductive Health - Women that have ever used Depo-Provera or injectables (%)
Reproductive Health - Women that have ever used female hormones (%)
Sexual Behavior - People 18+ that ever had sex (vaginal, anal, or oral) (%)
Sexual Behavior - Males 18+ that ever had vaginal sex with a woman (%)
Sexual Behavior - Males 18+ that ever performed oral sex on a woman (%)
Sexual Behavior - Males 18+ that ever had anal sex with a woman (%)
Sexual Behavior - Males 18+ that ever had any sex with a man (%)
Sexual Behavior - Females 18+ that ever had vaginal sex with a man (%)
Sexual Behavior - Females 18+ that ever performed oral sex on a man (%)
Sexual Behavior - Females 18+ that ever had anal sex with a man (%)
Sexual Behavior - Females 18+ that ever had any kind of sex with a woman (%)
Sexual Behavior - Average age people first had sex
Sexual Behavior - Average number of female sex partners in lifetime (males 18+)
Sexual Behavior - Average number of female vaginal sex partners in lifetime (males 18+)
Sexual Behavior - Average age people first performed oral sex on a woman (18+)
Sexual Behavior - Average number of woman performed oral sex on in lifetime (18+)
Sexual Behavior - Average number of male sex partners in lifetime (males 18+)
Sexual Behavior - Average number of male anal sex partners in lifetime (males 18+)
Sexual Behavior - Average age people first performed oral sex on a man (18+)
Sexual Behavior - Average number of male oral sex partners in lifetime (18+)
Sexual Behavior - People using protection when performing oral sex (%)
Sexual Behavior - Average number of times people have vaginal or anal sex a year
Sexual Behavior - People having sex without condom (%)
Sexual Behavior - Average number of male sex partners in lifetime (females 18+)
Sexual Behavior - Average number of male vaginal sex partners in lifetime (females 18+)
Sexual Behavior - Average number of female sex partners in lifetime (females 18+)
Sexual Behavior - Circumcised males 18+ (%)
Sleep Disorders - Average hours sleeping at night
Sleep Disorders - People that has trouble sleeping (%)
Smoking-Cigarette Use - People smoking cigarettes (%)
Taste & Smell - People 40+ having problems with smell (%)
Taste & Smell - People 40+ having problems with taste (%)
Taste & Smell - People 40+ that ever had wisdom teeth removed (%)
Taste & Smell - People 40+ that ever had tonsils teeth removed (%)
Taste & Smell - People 40+ that ever had a loss of consciousness because of a head injury (%)
Taste & Smell - People 40+ that ever had a broken nose or other serious injury to face or skull (%)
Taste & Smell - People 40+ that ever had two or more sinus infections (%)
Weight - Average height (inches)
Weight - Average weight (pounds)
Weight - Average BMI
Weight - People that are obese (%)
Weight - People that ever were obese (%)
Weight - People trying to lose weight (%)
Urban population: 15,874
Rural population: 7,487
Estimated median house/condo value in 2022: $236,057
75159:
$236,057Texas:
$275,400
Median resident age: This zip code:
36.3 yearsTexas median age:
35.6 years
Average household size: This zip code:
3.1 peopleTexas:
2.6 people
Averages for the 2020 tax year for zip code 75159, filed in 2021:
Average Adjusted Gross Income (AGI) in 2020: $47,923 (Individual Income Tax Returns) Here:
$47,923State:
$77,054
Salary/wage: $45,259 (reported on 82.9% of returns )Here:
$45,259State:
$62,766
(% of AGI for various income ranges: 1228.9% for AGIs below $25k , 3867.0% for AGIs $25k-50k , 6781.2% for AGIs $50k-75k , 9545.5% for AGIs $75k-100k , 17637.0% for AGIs $100k-200k , 52735.0% for AGIs over 200k ) Taxable interest for individuals: $1,192 (reported on 11.0% of returns )This zip code:
$1,192Texas:
$2,665
(% of AGI for various income ranges: 4.0% for AGIs below $25k , 6.7% for AGIs $25k-50k , 8.0% for AGIs $50k-75k , 26.2% for AGIs $75k-100k , 79.3% for AGIs $100k-200k , 942.5% for AGIs over 200k ) Ordinary dividends: $3,200 (reported on 4.5% of returns )(% of AGI for various income ranges: 4.8% for AGIs below $25k , 4.7% for AGIs $25k-50k , 19.3% for AGIs $50k-75k , 36.7% for AGIs $75k-100k , 99.8% for AGIs $100k-200k , 632.5% for AGIs over 200k ) Net capital gain/loss in AGI: +$8,302 (reported on 4.4% of returns )Here:
+$8,302State:
+$39,590
(% of AGI for various income ranges: 4.0% for AGIs below $25k , 8.1% for AGIs $25k-50k , 37.1% for AGIs $50k-75k , 12.7% for AGIs $75k-100k , 181.6% for AGIs $100k-200k , 4560.0% for AGIs over 200k ) Profit/loss from business: +$7,918 (reported on 24.9% of returns )Here:
+$7,918State:
+$10,888
(% of AGI for various income ranges: 236.2% for AGIs below $25k , 163.3% for AGIs $25k-50k , 202.9% for AGIs $50k-75k , 365.5% for AGIs $75k-100k , 590.2% for AGIs $100k-200k , 3980.0% for AGIs over 200k ) Taxable individual retirement arrangement distribution: $15,485 (reported on 3.6% of returns )75159:
$15,485Texas:
$24,740
(% of AGI for various income ranges: 27.4% for AGIs below $25k , 30.0% for AGIs $25k-50k , 78.3% for AGIs $50k-75k , 166.4% for AGIs $75k-100k , 437.7% for AGIs $100k-200k ) Total itemized deductions: $31,780 (reported on 5.0% of returns )Here:
$31,780State:
$40,428
(% of AGI for various income ranges: 14.7% for AGIs below $25k , 129.1% for AGIs $25k-50k , 284.6% for AGIs $50k-75k , 373.3% for AGIs $75k-100k , 703.6% for AGIs $100k-200k , 7322.5% for AGIs over 200k ) Charity contributions: $9,919 (reported on 3.9% of returns )(% of AGI for various income ranges: 26.4% for AGIs $25k-50k , 64.4% for AGIs $50k-75k , 96.5% for AGIs $75k-100k , 232.5% for AGIs $100k-200k , 1712.5% for AGIs over 200k ) Taxes paid: $6,623 (reported on 4.8% of returns )(% of AGI for various income ranges: 4.0% for AGIs below $25k , 26.8% for AGIs $25k-50k , 64.0% for AGIs $50k-75k , 83.3% for AGIs $75k-100k , 155.0% for AGIs $100k-200k , 840.0% for AGIs over 200k ) Earned income credit: $2,691 (reported on 24.3% of returns )(% of AGI for various income ranges: 151.6% for AGIs below $25k , 96.7% for AGIs $25k-50k , 2.0% for AGIs $50k-75k ) Percentage of individuals using paid preparers for their 2020 taxes: 90.4%(% for various income ranges: 87.9% for AGIs below $25k , 92.0% for AGIs $25k-50k , 90.7% for AGIs $50k-75k , 93.2% for AGIs $75k-100k , 91.9% for AGIs $100k-200k , 91.7% for AGIs over 200k )
Averages for the 2012 tax year for zip code 75159, filed in 2013:
Average Adjusted Gross Income (AGI) in 2012: $40,173 (Individual Income Tax Returns) Here:
$40,173State:
$65,384
Salary/wage: $37,519 (reported on 85.0% of returns )Here:
$37,519State:
$52,524
(% of AGI for various income ranges: 75.3% for AGIs below $25k , 88.2% for AGIs $25k-50k , 82.4% for AGIs $50k-75k , 83.2% for AGIs $75k-100k , 77.8% for AGIs $100k-200k , 44.2% for AGIs over 200k ) Taxable interest for individuals: $1,375 (reported on 15.0% of returns )This zip code:
$1,375Texas:
$2,372
(% of AGI for various income ranges: 0.4% for AGIs below $25k , 0.3% for AGIs $25k-50k , 0.4% for AGIs $50k-75k , 0.7% for AGIs $75k-100k , 0.7% for AGIs $100k-200k , 1.1% for AGIs over 200k ) Ordinary dividends: $3,248 (reported on 6.0% of returns )(% of AGI for various income ranges: 0.5% for AGIs below $25k , 0.2% for AGIs $25k-50k , 0.3% for AGIs $50k-75k , 0.1% for AGIs $75k-100k , 1.1% for AGIs $100k-200k , 1.1% for AGIs over 200k ) Net capital gain/loss in AGI: +$4,700 (reported on 5.0% of returns )Here:
+$4,700State:
+$35,319
(% of AGI for various income ranges: 0.2% for AGIs $50k-75k , 0.4% for AGIs $75k-100k , 1.5% for AGIs $100k-200k , 3.2% for AGIs over 200k ) Profit/loss from business: +$8,656 (reported on 22.0% of returns )Here:
+$8,656State:
+$13,732
(% of AGI for various income ranges: 14.4% for AGIs below $25k , 2.8% for AGIs $25k-50k , 2.4% for AGIs $50k-75k , 2.1% for AGIs $75k-100k , 3.6% for AGIs $100k-200k , 6.9% for AGIs over 200k ) Taxable individual retirement arrangement distribution: $12,974 (reported on 5.6% of returns )75159:
$12,974Texas:
$19,511
(% of AGI for various income ranges: 1.7% for AGIs below $25k , 1.3% for AGIs $25k-50k , 2.3% for AGIs $50k-75k , 2.0% for AGIs $75k-100k , 2.8% for AGIs $100k-200k ) Total itemized deductions: $19,015 (25% of AGI, reported on 19.3% of returns )Here:
$19,015State:
$24,724
Here:
24.7% of AGIState:
15.9% of AGI
(% of AGI for various income ranges: 4.3% for AGIs below $25k , 8.5% for AGIs $25k-50k , 9.0% for AGIs $50k-75k , 9.8% for AGIs $75k-100k , 12.4% for AGIs $100k-200k , 12.2% for AGIs over 200k ) Charity contributions: $4,469 (reported on 14.0% of returns )(% of AGI for various income ranges: 0.5% for AGIs below $25k , 1.2% for AGIs $25k-50k , 1.4% for AGIs $50k-75k , 2.0% for AGIs $75k-100k , 2.6% for AGIs $100k-200k , 2.2% for AGIs over 200k ) Taxes paid: $4,329 (reported on 18.7% of returns )(% of AGI for various income ranges: 0.8% for AGIs below $25k , 1.9% for AGIs $25k-50k , 1.8% for AGIs $50k-75k , 2.2% for AGIs $75k-100k , 3.0% for AGIs $100k-200k , 2.6% for AGIs over 200k ) Earned income credit: $2,581 (reported on 29.0% of returns )(% of AGI for various income ranges: 10.0% for AGIs below $25k , 1.6% for AGIs $25k-50k ) Percentage of individuals using paid preparers for their 2012 taxes: 59.9%(% for various income ranges: 60.1% for AGIs below $25k , 59.6% for AGIs $25k-50k , 60.0% for AGIs $50k-75k , 55.6% for AGIs $75k-100k , 60.5% for AGIs $100k-200k , 83.3% for AGIs over 200k )
Averages for the 2004 tax year for zip code 75159, filed in 2005:
Average Adjusted Gross Income (AGI) in 2004: $36,353 (Individual Income Tax Returns) Here:
$36,353State:
$47,881
Salary/wage: $35,440 (reported on 87.2% of returns )Here:
$35,440State:
$41,947
(% of AGI for various income ranges: 94.5% for AGIs below $10k , 83.7% for AGIs $10k-25k , 89.0% for AGIs $25k-50k , 87.4% for AGIs $50k-75k , 86.8% for AGIs $75k-100k , 74.3% for AGIs over 100k ) Taxable interest for individuals: $1,936 (reported on 22.2% of returns )This zip code:
$1,936Texas:
$2,255
(% of AGI for various income ranges: 2.5% for AGIs below $10k , 0.7% for AGIs $10k-25k , 0.9% for AGIs $25k-50k , 0.8% for AGIs $50k-75k , 0.9% for AGIs $75k-100k , 2.5% for AGIs over 100k ) Taxable dividends: $2,031 (reported on 8.8% of returns )(% of AGI for various income ranges: 0.7% for AGIs below $10k , 0.2% for AGIs $10k-25k , 0.2% for AGIs $25k-50k , 0.2% for AGIs $50k-75k , 0.5% for AGIs $75k-100k , 1.6% for AGIs over 100k ) Net capital gain/loss: +$5,257 (reported on 7.2% of returns )Here:
+$5,257State:
+$16,110
(% of AGI for various income ranges: 0.0% for AGIs below $10k , 0.1% for AGIs $10k-25k , 0.2% for AGIs $25k-50k , 0.5% for AGIs $50k-75k , 0.3% for AGIs $75k-100k , 4.4% for AGIs over 100k ) Profit/loss from business: +$6,650 (reported on 19.4% of returns )Here:
+$6,650State:
+$11,013
(% of AGI for various income ranges: 17.8% for AGIs below $10k , 8.2% for AGIs $10k-25k , 3.0% for AGIs $25k-50k , 2.4% for AGIs $50k-75k , 3.1% for AGIs $75k-100k , 1.4% for AGIs over 100k ) IRA payment deduction: $2,971 (reported on 1.2% of returns )Self-employed pension: $4,300 (reported on 0.2% of returns )Total itemized deductions: $16,086 (24% of AGI, reported on 21.9% of returns )Here:
$16,086State:
$19,631
Here:
24.4% of AGIState:
18.9% of AGI
(% of AGI for various income ranges: 8.2% for AGIs below $10k , 4.8% for AGIs $10k-25k , 9.5% for AGIs $25k-50k , 10.9% for AGIs $50k-75k , 12.1% for AGIs $75k-100k , 10.3% for AGIs over 100k ) Charity contributions deductions: $3,675 (5% of AGI, reported on 16.7% of returns )Here:
5.2% of AGIState:
4.2% of AGI
(% of AGI for various income ranges: 0.5% for AGIs below $10k , 0.7% for AGIs $10k-25k , 1.4% for AGIs $25k-50k , 1.8% for AGIs $50k-75k , 2.5% for AGIs $75k-100k , 2.3% for AGIs over 100k ) Total tax: $4,694 (reported on 69.6% of returns )(% of AGI for various income ranges: 4.5% for AGIs below $10k , 3.9% for AGIs $10k-25k , 5.6% for AGIs $25k-50k , 8.5% for AGIs $50k-75k , 10.6% for AGIs $75k-100k , 17.7% for AGIs over 100k ) Earned income credit: $1,917 (reported on 25.3% of returns )Percentage of individuals using paid preparers for their 2004 taxes: 63.7%(% for various income ranges: 57.4% for AGIs below $10k , 68.9% for AGIs $10k-25k , 62.7% for AGIs $25k-50k , 62.3% for AGIs $50k-75k , 64.0% for AGIs $75k-100k , 68.4% for AGIs over 100k )
Estimated median household income in 2022: This zip code:
$68,588Texas:
$72,284
Nearest zip codes: 75253 ,
75114 ,
75125 ,
75181 ,
75172 ,
75180 .
Seagoville Zip Code Map
Percentage of family households: This zip code:
54.9%Texas:
50.5%
Percentage of households with unmarried partners: This zip code:
7.5%Texas:
48.7%
Likely homosexual households (counted as self-reported same-sex unmarried-partner households)
Lesbian couples: 0.4% of all households Gay men: 0.5% of all households
Household received Food Stamps/SNAP in the past 12 months: 783Household did not receive Food Stamps/SNAP in the past 12 months: 6,051
Women who had a birth in the past 12 months: 177 (103 now married , 73 unmarried) Women who did not have a birth in the past 12 months: 4,588 (1,715 now married , 2,882 unmarried)
Housing units in zip code 75159 with a mortgage: 3,393 (137
second mortgage , 144
both second mortgage and home equity loan )
Houses without a mortgage: 20
Median monthly owner costs for units with a mortgage: $1,660
Median monthly owner costs for units without a mortgage: $658
Residents with income below the poverty level in 2022:
This zip code:
13.1%Whole state:
14.0%
Residents with income below 50% of the poverty level in 2022:
This zip code:
5.3%Whole state:
7.4%
Median number of rooms in houses and condos: Median number of rooms in apartments: Notable locations in this zip code not listed on our city pages
Click to draw/clear zip code borders Notable locations in zip code 75159: (A) , Seagoville Federal Correctional Institution (B) , Seagoville Sewage Disposal (C) , Valley Ranch (D) , Seagoville Fire Department (E) , Combine Volunteer Fire Department (F) , Texas Lifeline Corporation Ambulance Service (G) . Display/hide their locations on the map
Churches in zip code 75159 include: (A) , Point View Church (B) , Saint Timothy Church (C) , Sand Branch Church (D) , Fellowship Holiness Church (E) , Seagoville First Baptist Church (F) , Sandhill Baptist Church (G) , Robinwood Baptist Church (H) , Wayside Missionary Baptist Church (I) . Display/hide their locations on the map
Cemeteries: (1) , Pleasant Grove Cemetery (2) , Rose Lawn Memorial Gardens (3) , Lee Cemetery (4) , Sand Branch Cemetery (5) . Display/hide their locations on the map
Reservoirs: (A) , Soil Conservation Service Site 3 Reservoir (B) , Soil Conservation Service Site 4 Reservoir (C) , Soil Conservation Service Site 5 Reservoir (D) , Soil Conservation Service Site 6 Reservoir (E) . Display/hide their locations on the map
Streams, rivers, and creeks: (A) , Mustang Creek (B) , Hickory Creek (C) , Parsons Slough (D) , East Fork Trinity River (E) . Display/hide their locations on the map
Parks in zip code 75159 include: (1) , James Ray Henry Stadium (2) , Beardon Park (3) . Display/hide their locations on the map
Year house built (houses)
50 2020 or later1,762 2010 to 20191,819 2000 to 2009550 1990 to 19991,066 1980 to 1989886 1970 to 1979277 1960 to 1969639 1950 to 1959134 1940 to 194928 1939 or earlier
Zip code 75159 household income distribution in 2022 318 Less than $10,000265 $10,000 to $14,999170 $15,000 to $19,999183 $20,000 to $24,999167 $25,000 to $29,999309 $30,000 to $34,999408 $35,000 to $39,99997 $40,000 to $44,999279 $45,000 to $49,999751 $50,000 to $59,999842 $60,000 to $74,999669 $75,000 to $99,9991,062 $100,000 to $124,999499 $125,000 to $149,999524 $150,000 to $199,999281 $200,000 or moreEstimate of home value of owner-occupied houses/condos in 2022 in zip code 75159 376 Less than $10,00017 $10,000 to $14,99925 $15,000 to $19,99957 $20,000 to $24,99932 $25,000 to $29,99914 $40,000 to $49,99925 $50,000 to $59,99917 $60,000 to $69,99952 $70,000 to $79,999161 $80,000 to $89,99969 $90,000 to $99,999383 $100,000 to $124,999161 $125,000 to $149,999546 $150,000 to $174,999362 $175,000 to $199,999863 $200,000 to $249,999847 $250,000 to $299,999634 $300,000 to $399,999283 $400,000 to $499,999203 $500,000 to $749,99924 $750,000 to $999,99933 $1,500,000 to $1,999,999Rent paid by renters in 2022 in zip code 75159 47 $100 to $14935 $150 to $19929 $300 to $34911 $350 to $39913 $450 to $499121 $500 to $5492 $550 to $59958 $600 to $6493 $650 to $699106 $700 to $74988 $800 to $89989 $900 to $999320 $1,000 to $1,24927 $1,250 to $1,499282 $1,500 to $1,99915 $2,500 to $2,999141 No cash rent
Median gross rent in 2022: $1,257.
Median price asked for vacant for-sale houses and condos in 2022: $174,064.
Estimated median house (or condo) value in 2022 for: White Non-Hispanic householders: $265,275Black or African American householders: $129,177American Indian or Alaska Native householders: $288,343Asian householders: $326,789Some other race householders: $241,439Two or more races householders: $3,123,720Hispanic or Latino householders: $231,828Estimated median house or condo value in 2022: $236,057
75159:
$236,057Texas:
$275,400
Lower value quartile - upper value quartile: $148,433 - $315,868
Mean price in 2022: Detached houses: $268,889Here:
$268,889State:
$369,058
Townhouses or other attached units: $60,409Here:
$60,409State:
$327,631
Mobile homes: $113,919Here:
$113,919State:
$124,413
Housing units in structures:
One, detached: 5,448One, attached: 67Two: 213 or 4: 3345 to 9: 1310 to 19: 7820 to 49: 29350 or more: 87Mobile homes: 861Unemployment : 6.1%
Means of transportation to work in zip code 75159 70.0% 6,464 Drove a car alone15.5% 1,434 Carpooled0.7% 65 Taxi0.3% 28 Motorcycle0.0% 3 Walked1.2% 107 Other means12.2% 1,124 Worked at homeTravel time to work (commute) in zip code 75159 66 Less than 5 minutes273 5 to 9 minutes359 10 to 14 minutes567 15 to 19 minutes1,063 20 to 24 minutes541 25 to 29 minutes1,368 30 to 34 minutes181 35 to 39 minutes456 40 to 44 minutes1,504 45 to 59 minutes1,292 60 to 89 minutes374 90 or more minutes
Percentage of zip code residents living and working in this county: 74.5%
Household type by relationship:
Households: 23,362
Male householders: 3,519 (631 living alone ), Female householders: 3,317 (674 living alone )3,158 spouses (3,158 opposite-sex spouses ), 906 unmarried partners , (864 opposite-sex unmarried partners ), 7,012 children (6,639 natural , 48 adopted , 323 stepchildren ), 1,108 grandchildren , 475 brothers or sisters , 528 parents , 0 foster children , 817 other relatives , 457 non-relatives In group quarters: 1,971 (-1 institutionalized population )
Size of family households: 1,714 2-persons , 1,018 3-persons , 1,156 4-persons , 449 5-persons , 541 6-persons , 265 7-or-more-persons
Size of nonfamily households: 1,304 1-person , 335 2-persons , 15 3-persons , 3 4-persons
2,931 married couples with children. single-parent households (1,035 men , 958 women ).
60.7% of residents of 75159 zip code speak English at home. of residents speak Spanish at home (52% very well, 27% well, 14% not well, 7% not at all ).of residents speak other Indo-European language at home (100% very well ).of residents speak Asian or Pacific Island language at home (72% very well, 22% well, 6% not well ).of residents speak other language at home (85% very well, 15% well ).
Foreign born population: 4,388 (18.8%)
(24.0%
of them are naturalized citizens )
This zip code:
18.8%Whole state:
17.2%
83% Honduras 4% Guatemala 2% Eritrea 2% Costa Rica 2% Chile 1% Bolivia 1% Mexico 8% American 5% English 2% Irish 2% Moroccan 1% German 1% Italian 1% Polish
Year of entry for the foreign-born population
1,366 2010 or later 1,370 2000 to 2009 1,273 1990 to 1999 603 Before 1990
Facilities with environmental interests located in this zip code:
AMERICAN SPILL CONTROL INC (409 WEST SIMONDS ROAD SECTION T in SEAGOVILLE, TX)
(Resource Conservation and Recovery Act (tracking hazardous waste)) TRANSPORTER (Resource Conservation and Recovery Act (tracking hazardous waste)) Organizations: SEAGOVILLE STATE BANK (CONTACT/OWNER)
Alternative names: AMEICAN SPILL CONTROL INC
B&B AUTO SALES & SALVAGE (3820 S BELT LINE RD in SEAGOVILLE, TX)
(Integrated Compliance Information System) - ICIS-06-2000-0193, FORMAL ENFORCEMENT ACTION Business SIC classification: MOTOR VEHICLE PARTS, USED; MOTOR VEHICLE DEALERS (USED ONLY)
AREA MAINTENANCE SUPPORT (703 W SIMONDS RD in SEAGOVILLE, TX)
(Resource Conservation and Recovery Act (tracking hazardous waste))
B & B READY MIX, INC. - WWTP (4240 S. BELTLINE RD. in SEAGOVILLE, TX)
National Pollutant Discharge Elimination System NON-MAJOR (Tracking pollutant discharge elimination systems) - permit Business SIC classification: READY-MIXED CONCRETE
AMERICAN ENVIRONMENTAL EQUIP (409 W SIMONDS RD in SEAGOVILLE, TX)
Conditionally Exempt Small Quantity Generators, less than 100 kg/month of hazardous waste (Resource Conservation and Recovery Act (tracking hazardous waste)) - notification TRANSPORTER (Resource Conservation and Recovery Act (tracking hazardous waste)) - notification Organizations: SEAGOVILLE STATE BANK (CONTACT/OWNER)
AMERICAN SPILL CONTROL INC (2601 N HIGHWAY 175 in SEAGOVILLE, TX)
TRANSPORTER (Resource Conservation and Recovery Act (tracking hazardous waste)) - notification
Housing units lacking complete plumbing facilities: 0.3%
Housing units lacking complete kitchen facilities: 3.4%
76.8% Electricity 18.7% Utility gas 3.5% Bottled, tank, or LP gas
Population in 1990: 10,569. Population change in the 1990s: +3,812 (+36.1%).
Place of birth for U.S.-born residents:
This state: 14,634Northeast: 505Midwest: 1,216South: 1,397West: 903
56% of the 75159 zip code residents lived in the same house 5 years ago.
Out of people who lived in different houses, 61% lived in this county.
Out of people who lived in different counties, 50% lived in Texas.
85% of the 75159 zip code residents lived in the same house 1 year ago.
Out of people who lived in different houses, 34% moved from this county.
Out of people who lived in different houses, 56% moved from different county within same state.
Out of people who lived in different houses, 8% moved from different state.
Out of people who lived in different houses, 3% moved from abroad.
Private vs. public school enrollment:
Students in private schools in grades 1 to 8 (elementary and middle school): 176
Students in private schools in grades 9 to 12 (high school): 14
Students in private undergraduate colleges: 137
Occupation by median earnings in the past 12 months ($)
146,899 Architecture and engineering occupations 82,523 Computer and mathematical occupations 75,688 Business and financial operations occupations 72,848 Law enforcement workers including supervisors 71,106 Management occupations 54,207 Education, training, and library occupations
Companies with federal contracts located in this zip code:
STEALTH SYSTEMS (103 N KAUFMAN ST STE 5B in SEAGOVILLE, TX; small business)
$12,470 with Navy for Cameras, Motion Picture. Signed on 2005-09-14. Completion date: 2005-10-14.
WR PRECISION AIR & CABLE INC (205 N HIGHWAY 175 in SEAGOVILLE, TX; small business)
$3,385 with Army for Maintenance, Repair and Rebuilding of Equipment -- Refrigeration, Air Conditioning, and Air Circulating Equipment. Signed on 2005-08-03. Completion date: 2005-08-13.
TRAVERS, CALVIN (610 W SIMONDS RD in SEAGOVILLE, TX; small business)
$3,215 with Army for Highways, Roads, Streets, Bridges, and Railways. Signed on 2004-04-13. Completion date: 2004-04-27.
Seagoville Chamber of commererce (107 Hall Street in Seagoville, tx; small business)
$100 with Bureau of Prisoners/Federal Prison System for . Signed on 2005-02-09. Completion date: 2005-12-31.
Brian Kelly Glass & Mirror (310 South Kaufman in Seagoville, TX; small business)
$70 with Bureau of Prisoners/Federal Prison System for Glass Fabricated Materials. Signed on 2005-02-24. Completion date: 2005-02-28.
Top industries in this zip code by the number of employees in 2005:
Accommodation and Food Services: Limited-Service Restaurants (50-99 employees: 2 establishments, 20-49 employees: 3 establishments, 10-19 employees: 2 establishments)Health Care and Social Assistance: Nursing Care Facilities (50-99: 1)Other Services (except Public Administration): Religious Organizations (10-19: 2, 5-9: 5, 1-4: 2)Construction: Site Preparation Contractors (20-49: 1, 10-19: 1, 1-4: 4)Construction: Plumbing, Heating, and Air-Conditioning Contractors (5-9: 7, 1-4: 2)
People in group quarters in 2010:
1,781 people in federal prisons
259 people in federal detention centers
82 people in nursing facilities/skilled-nursing facilities
People in group quarters in 2000:
1,358 people in federal prisons and detention centers
76 people in other noninstitutional group quarters
3 people in other nonhousehold living situations
Fatal accident statistics in 2014:
Fatal accident count: 2Vehicles involved in fatal accidents: 3Fatal accidents caused by drunken drivers: 1Fatalities: 2Persons involved in fatal accidents: 3Pedestrians involved in fatal accidents: 0
Fatal accident statistics in 2013:
Fatal accident count: 3Vehicles involved in fatal accidents: 4Fatal accidents caused by drunken drivers: 0Fatalities: 3Persons involved in fatal accidents: 7Pedestrians involved in fatal accidents: 2
Home Mortgage Disclosure Act Aggregated Statistics For Year 2009(Based on 12 partial tracts) A) FHA, FSA/RHS & VA B) Conventional C) Refinancings D) Home Improvement Loans F) Non-occupant Loans on G) Loans On Manufactured Number Average Value Number Average Value Number Average Value Number Average Value Number Average Value Number Average Value
LOANS ORIGINATED 136 $103,043 109 $62,783 135 $118,060 16 $15,039 51 $63,308 42 $31,719 APPLICATIONS APPROVED, NOT ACCEPTED 10 $108,027 11 $46,583 29 $135,628 6 $22,857 2 $140,375 11 $35,591 APPLICATIONS DENIED 33 $107,265 38 $44,632 124 $110,949 30 $14,744 22 $72,928 28 $32,434 APPLICATIONS WITHDRAWN 32 $109,759 30 $59,280 74 $112,780 4 $15,652 5 $61,090 17 $27,817 FILES CLOSED FOR INCOMPLETENESS 3 $106,030 4 $99,592 26 $92,994 3 $12,547 2 $91,310 2 $61,720
Aggregated Statistics For Year 2008(Based on 12 partial tracts) A) FHA, FSA/RHS & VA B) Conventional C) Refinancings D) Home Improvement Loans E) Loans on Dwellings For 5+ Families F) Non-occupant Loans on G) Loans On Manufactured Number Average Value Number Average Value Number Average Value Number Average Value Number Average Value Number Average Value Number Average Value
LOANS ORIGINATED 183 $115,665 262 $73,680 128 $99,904 35 $35,375 2 $3,584,410 102 $68,075 84 $25,409 APPLICATIONS APPROVED, NOT ACCEPTED 6 $103,975 18 $64,126 35 $98,516 13 $22,744 0 $0 9 $72,448 7 $38,940 APPLICATIONS DENIED 53 $105,385 76 $66,368 189 $110,012 89 $27,756 0 $0 31 $53,423 23 $39,548 APPLICATIONS WITHDRAWN 51 $113,176 33 $74,404 63 $118,066 6 $49,605 0 $0 17 $68,483 3 $53,993 FILES CLOSED FOR INCOMPLETENESS 10 $105,255 6 $133,065 16 $153,202 5 $43,636 0 $0 3 $106,817 2 $10,915
Aggregated Statistics For Year 2007(Based on 12 partial tracts) A) FHA, FSA/RHS & VA B) Conventional C) Refinancings D) Home Improvement Loans E) Loans on Dwellings For 5+ Families F) Non-occupant Loans on G) Loans On Manufactured Number Average Value Number Average Value Number Average Value Number Average Value Number Average Value Number Average Value Number Average Value
LOANS ORIGINATED 151 $117,824 408 $90,579 138 $101,354 54 $26,401 15 $2,352,215 109 $68,054 37 $47,755 APPLICATIONS APPROVED, NOT ACCEPTED 16 $102,123 86 $90,398 39 $107,985 13 $35,924 0 $0 29 $71,807 11 $57,306 APPLICATIONS DENIED 43 $100,430 231 $83,238 360 $113,074 118 $35,213 0 $0 60 $73,552 62 $41,391 APPLICATIONS WITHDRAWN 23 $114,539 71 $100,540 149 $114,708 12 $78,998 0 $0 26 $79,276 8 $73,104 FILES CLOSED FOR INCOMPLETENESS 3 $105,293 33 $113,513 35 $175,174 4 $34,495 0 $0 6 $84,160 0 $0
Aggregated Statistics For Year 2006(Based on 12 partial tracts) A) FHA, FSA/RHS & VA B) Conventional C) Refinancings D) Home Improvement Loans F) Non-occupant Loans on G) Loans On Manufactured Number Average Value Number Average Value Number Average Value Number Average Value Number Average Value Number Average Value
LOANS ORIGINATED 144 $106,683 660 $79,358 189 $99,248 42 $36,265 102 $66,328 39 $75,168 APPLICATIONS APPROVED, NOT ACCEPTED 2 $121,845 109 $75,586 49 $86,103 13 $37,792 25 $70,836 8 $32,935 APPLICATIONS DENIED 31 $121,171 300 $80,419 281 $93,083 117 $30,330 82 $62,215 35 $49,840 APPLICATIONS WITHDRAWN 20 $123,182 138 $82,468 193 $103,924 13 $54,255 26 $68,597 2 $26,585 FILES CLOSED FOR INCOMPLETENESS 9 $96,588 35 $89,497 44 $154,303 1 $83,110 3 $42,553 4 $84,980
Aggregated Statistics For Year 2005(Based on 12 partial tracts) A) FHA, FSA/RHS & VA B) Conventional C) Refinancings D) Home Improvement Loans F) Non-occupant Loans on G) Loans On Manufactured Number Average Value Number Average Value Number Average Value Number Average Value Number Average Value Number Average Value
LOANS ORIGINATED 123 $97,018 593 $66,285 293 $101,212 48 $98,394 119 $66,921 59 $39,289 APPLICATIONS APPROVED, NOT ACCEPTED 6 $110,727 97 $66,954 44 $113,065 15 $38,410 13 $65,712 27 $46,686 APPLICATIONS DENIED 30 $107,709 241 $80,708 376 $98,526 92 $27,116 49 $55,845 56 $47,991 APPLICATIONS WITHDRAWN 18 $106,339 95 $81,029 181 $136,567 50 $139,476 21 $63,195 5 $34,498 FILES CLOSED FOR INCOMPLETENESS 3 $79,343 22 $93,148 73 $141,427 2 $32,515 9 $88,388 1 $46,350
Aggregated Statistics For Year 2004(Based on 12 partial tracts) A) FHA, FSA/RHS & VA B) Conventional C) Refinancings D) Home Improvement Loans E) Loans on Dwellings For 5+ Families F) Non-occupant Loans on G) Loans On Manufactured Number Average Value Number Average Value Number Average Value Number Average Value Number Average Value Number Average Value Number Average Value
LOANS ORIGINATED 168 $104,401 428 $79,816 376 $101,693 31 $35,109 2 $1,723,340 84 $72,874 69 $44,855 APPLICATIONS APPROVED, NOT ACCEPTED 9 $112,630 78 $78,260 63 $99,947 12 $37,847 0 $0 13 $78,022 15 $28,376 APPLICATIONS DENIED 31 $121,639 135 $75,586 414 $84,096 72 $34,611 0 $0 44 $75,314 46 $49,162 APPLICATIONS WITHDRAWN 20 $112,974 64 $84,988 242 $92,539 9 $68,406 0 $0 8 $52,160 12 $64,882 FILES CLOSED FOR INCOMPLETENESS 5 $101,502 34 $83,076 94 $99,447 4 $71,192 0 $0 3 $74,797 3 $44,080
Aggregated Statistics For Year 2003(Based on 12 partial tracts) A) FHA, FSA/RHS & VA B) Conventional C) Refinancings D) Home Improvement Loans F) Non-occupant Loans on Number Average Value Number Average Value Number Average Value Number Average Value Number Average Value
LOANS ORIGINATED 216 $108,776 250 $91,690 543 $95,329 37 $34,476 65 $57,579 APPLICATIONS APPROVED, NOT ACCEPTED 11 $111,715 56 $69,920 105 $98,443 7 $59,291 7 $74,621 APPLICATIONS DENIED 43 $117,928 143 $74,268 419 $82,297 45 $21,470 24 $56,019 APPLICATIONS WITHDRAWN 37 $112,365 54 $87,597 257 $89,651 6 $61,687 8 $73,966 FILES CLOSED FOR INCOMPLETENESS 3 $92,020 37 $85,618 36 $100,022 2 $47,000 2 $64,175
Aggregated Statistics For Year 2002(Based on 6 partial tracts) A) FHA, FSA/RHS & VA B) Conventional C) Refinancings D) Home Improvement Loans E) Loans on Dwellings For 5+ Families F) Non-occupant Loans on Number Average Value Number Average Value Number Average Value Number Average Value Number Average Value Number Average Value
LOANS ORIGINATED 184 $114,507 158 $86,190 222 $94,657 31 $20,659 2 $3,800 28 $52,011 APPLICATIONS APPROVED, NOT ACCEPTED 6 $112,948 66 $58,931 41 $79,460 5 $48,128 0 $0 10 $40,140 APPLICATIONS DENIED 26 $125,698 133 $51,804 112 $76,861 39 $28,481 0 $0 18 $48,939 APPLICATIONS WITHDRAWN 9 $105,216 22 $88,912 73 $89,839 1 $41,580 0 $0 2 $113,760 FILES CLOSED FOR INCOMPLETENESS 10 $98,142 16 $103,851 16 $68,232 1 $21,720 0 $0 0 $0
Aggregated Statistics For Year 2001(Based on 6 partial tracts) A) FHA, FSA/RHS & VA B) Conventional C) Refinancings D) Home Improvement Loans F) Non-occupant Loans on Number Average Value Number Average Value Number Average Value Number Average Value Number Average Value
LOANS ORIGINATED 76 $94,299 212 $69,392 169 $88,560 31 $18,488 24 $33,148 APPLICATIONS APPROVED, NOT ACCEPTED 5 $109,388 79 $51,667 27 $66,775 13 $17,448 0 $0 APPLICATIONS DENIED 2 $114,205 375 $42,988 124 $65,823 37 $15,488 17 $38,676 APPLICATIONS WITHDRAWN 1 $93,370 22 $67,452 62 $73,940 3 $18,403 3 $44,353 FILES CLOSED FOR INCOMPLETENESS 2 $114,890 12 $62,250 13 $91,519 0 $0 0 $0
Aggregated Statistics For Year 2000(Based on 6 partial tracts) A) FHA, FSA/RHS & VA B) Conventional C) Refinancings D) Home Improvement Loans E) Loans on Dwellings For 5+ Families F) Non-occupant Loans on Number Average Value Number Average Value Number Average Value Number Average Value Number Average Value Number Average Value
LOANS ORIGINATED 37 $70,893 227 $60,279 60 $79,823 46 $18,525 0 $0 16 $39,632 APPLICATIONS APPROVED, NOT ACCEPTED 7 $32,030 71 $46,261 28 $59,579 19 $16,726 0 $0 8 $32,802 APPLICATIONS DENIED 9 $74,356 325 $42,169 34 $47,944 25 $16,797 2 $1,519,200 12 $41,120 APPLICATIONS WITHDRAWN 5 $47,594 26 $60,500 23 $82,731 1 $14,130 0 $0 5 $53,328 FILES CLOSED FOR INCOMPLETENESS 2 $62,715 8 $46,248 6 $89,283 0 $0 0 $0 0 $0
Aggregated Statistics For Year 1999(Based on 1 full and 4 partial tracts) A) FHA, FSA/RHS & VA B) Conventional C) Refinancings D) Home Improvement Loans F) Non-occupant Loans on Number Average Value Number Average Value Number Average Value Number Average Value Number Average Value
LOANS ORIGINATED 43 $68,144 329 $47,977 78 $68,875 42 $24,920 27 $46,232 APPLICATIONS APPROVED, NOT ACCEPTED 4 $50,952 143 $43,784 25 $55,353 15 $15,965 9 $47,319 APPLICATIONS DENIED 4 $63,565 659 $42,048 59 $59,247 53 $13,797 38 $47,494 APPLICATIONS WITHDRAWN 4 $71,738 21 $66,131 33 $64,630 6 $13,598 2 $86,280 FILES CLOSED FOR INCOMPLETENESS 2 $52,075 7 $71,190 8 $65,691 2 $60,585 0 $0
Private Mortgage Insurance Companies Aggregated Statistics For Year 2009(Based on 10 partial tracts) A) Conventional B) Refinancings Number Average Value Number Average Value
LOANS ORIGINATED 5 $144,518 4 $131,545 APPLICATIONS APPROVED, NOT ACCEPTED 4 $146,435 1 $257,660 APPLICATIONS DENIED 0 $0 0 $0 APPLICATIONS WITHDRAWN 0 $0 1 $162,860 FILES CLOSED FOR INCOMPLETENESS 1 $193,690 0 $0
Aggregated Statistics For Year 2008(Based on 12 partial tracts) A) Conventional B) Refinancings C) Non-occupant Loans on Number Average Value Number Average Value Number Average Value
LOANS ORIGINATED 67 $110,796 10 $115,578 13 $79,085 APPLICATIONS APPROVED, NOT ACCEPTED 23 $115,526 3 $120,177 7 $75,244 APPLICATIONS DENIED 7 $133,679 0 $0 4 $120,208 APPLICATIONS WITHDRAWN 5 $121,468 0 $0 2 $138,850 FILES CLOSED FOR INCOMPLETENESS 4 $106,995 0 $0 0 $0
Aggregated Statistics For Year 2007(Based on 12 partial tracts) A) Conventional B) Refinancings C) Non-occupant Loans on Number Average Value Number Average Value Number Average Value
LOANS ORIGINATED 174 $111,101 5 $129,972 25 $88,969 APPLICATIONS APPROVED, NOT ACCEPTED 23 $115,105 9 $118,346 6 $124,590 APPLICATIONS DENIED 6 $72,173 0 $0 4 $77,800 APPLICATIONS WITHDRAWN 5 $109,992 5 $130,530 0 $0 FILES CLOSED FOR INCOMPLETENESS 1 $142,350 0 $0 0 $0
Aggregated Statistics For Year 2006(Based on 12 partial tracts) A) Conventional B) Refinancings C) Non-occupant Loans on Number Average Value Number Average Value Number Average Value
LOANS ORIGINATED 76 $105,692 9 $116,993 17 $91,086 APPLICATIONS APPROVED, NOT ACCEPTED 5 $205,522 2 $89,845 0 $0 APPLICATIONS DENIED 4 $41,130 0 $0 4 $41,130 APPLICATIONS WITHDRAWN 2 $89,845 0 $0 0 $0 FILES CLOSED FOR INCOMPLETENESS 0 $0 0 $0 0 $0
Aggregated Statistics For Year 2005(Based on 12 partial tracts) A) Conventional B) Refinancings C) Non-occupant Loans on Number Average Value Number Average Value Number Average Value
LOANS ORIGINATED 51 $94,168 9 $126,933 9 $64,118 APPLICATIONS APPROVED, NOT ACCEPTED 6 $110,538 8 $200,625 3 $74,613 APPLICATIONS DENIED 0 $0 0 $0 0 $0 APPLICATIONS WITHDRAWN 3 $123,777 2 $140,475 0 $0 FILES CLOSED FOR INCOMPLETENESS 1 $120,180 0 $0 0 $0
Aggregated Statistics For Year 2004(Based on 12 partial tracts) A) Conventional B) Refinancings C) Non-occupant Loans on D) Loans On Manufactured Number Average Value Number Average Value Number Average Value Number Average Value
LOANS ORIGINATED 60 $97,515 20 $115,848 12 $66,302 3 $70,417 APPLICATIONS APPROVED, NOT ACCEPTED 12 $120,626 8 $147,975 3 $103,300 0 $0 APPLICATIONS DENIED 3 $91,190 1 $182,490 1 $78,720 0 $0 APPLICATIONS WITHDRAWN 3 $121,513 4 $83,078 1 $97,480 0 $0 FILES CLOSED FOR INCOMPLETENESS 2 $110,045 3 $167,483 0 $0 0 $0
Aggregated Statistics For Year 2003(Based on 12 partial tracts) A) Conventional B) Refinancings C) Non-occupant Loans on Number Average Value Number Average Value Number Average Value
LOANS ORIGINATED 71 $106,950 44 $118,567 10 $61,453 APPLICATIONS APPROVED, NOT ACCEPTED 6 $116,288 4 $141,772 0 $0 APPLICATIONS DENIED 3 $97,417 1 $94,670 0 $0 APPLICATIONS WITHDRAWN 3 $90,213 4 $97,000 0 $0 FILES CLOSED FOR INCOMPLETENESS 0 $0 0 $0 0 $0
Aggregated Statistics For Year 2002(Based on 6 partial tracts) A) Conventional B) Refinancings C) Non-occupant Loans on Number Average Value Number Average Value Number Average Value
LOANS ORIGINATED 41 $123,962 12 $135,568 3 $95,893 APPLICATIONS APPROVED, NOT ACCEPTED 4 $151,692 2 $110,235 0 $0 APPLICATIONS DENIED 1 $162,860 0 $0 0 $0 APPLICATIONS WITHDRAWN 5 $109,466 0 $0 3 $70,077 FILES CLOSED FOR INCOMPLETENESS 0 $0 0 $0 0 $0
Aggregated Statistics For Year 2001(Based on 6 partial tracts) A) Conventional B) Refinancings C) Non-occupant Loans on Number Average Value Number Average Value Number Average Value
LOANS ORIGINATED 30 $113,480 15 $114,091 3 $45,227 APPLICATIONS APPROVED, NOT ACCEPTED 4 $143,510 5 $104,560 0 $0 APPLICATIONS DENIED 1 $93,960 1 $75,060 0 $0 APPLICATIONS WITHDRAWN 2 $67,025 1 $116,090 1 $41,760 FILES CLOSED FOR INCOMPLETENESS 0 $0 0 $0 0 $0
Aggregated Statistics For Year 2000(Based on 6 partial tracts) A) Conventional B) Refinancings C) Non-occupant Loans on Number Average Value Number Average Value Number Average Value
LOANS ORIGINATED 32 $100,878 5 $156,834 3 $41,273 APPLICATIONS APPROVED, NOT ACCEPTED 2 $88,455 0 $0 1 $57,480 APPLICATIONS DENIED 1 $110,300 0 $0 1 $38,470 APPLICATIONS WITHDRAWN 1 $66,400 0 $0 0 $0 FILES CLOSED FOR INCOMPLETENESS 2 $50,375 0 $0 1 $41,450
Aggregated Statistics For Year 1999(Based on 1 full and 4 partial tracts) A) Conventional B) Refinancings C) Non-occupant Loans on Number Average Value Number Average Value Number Average Value
LOANS ORIGINATED 23 $88,893 5 $90,868 3 $46,643 APPLICATIONS APPROVED, NOT ACCEPTED 2 $64,460 1 $86,220 0 $0 APPLICATIONS DENIED 3 $85,927 0 $0 0 $0 APPLICATIONS WITHDRAWN 1 $63,860 0 $0 0 $0 FILES CLOSED FOR INCOMPLETENESS 1 $27,370 0 $0 0 $0
2002 - 2018 National Fire Incident Reporting System (NFIRS) incidents See full 2006 National Fire Incident Reporting System statistics for zip code 75159, Texas
Most common first names in zip code 75159 among deceased individuals Name Count Lived (average)
James 103 70.5 years John 69 71.5 years William 69 70.5 years Mary 63 72.9 years Robert 42 65.3 years Charles 33 71.6 years Willie 32 77.5 years Dorothy 27 74.0 years Thomas 27 71.3 years George 26 70.1 years
Most common last names in zip code 75159 among deceased individuals Last name Count Lived (average)
Smith 44 72.5 years Johnson 30 70.1 years Davis 27 78.8 years Williams 26 75.4 years Wilson 25 75.5 years Jones 22 68.9 years Martin 21 76.6 years Baker 19 70.4 years Miller 19 76.6 years Tucker 18 72.2 years
Businesses in zip code 75159
Name Count Name Count
AutoZone 1 Payless 1 Best Western 1 Pizza Hut 1 Blockbuster 1 SONIC Drive-In 1 Church's Chicken 1 Sprint Nextel 1 ColorTyme 1 Subway 1 Dennys 1 T-Mobile 1 FedEx 1 Taco Bell 1 H&R Block 1 U-Haul 3 Jack In The Box 1 UPS 1 KFC 1 Walgreens 1 Little Caesars Pizza 1 Walmart 1 McDonald's 1 Wendy's 1
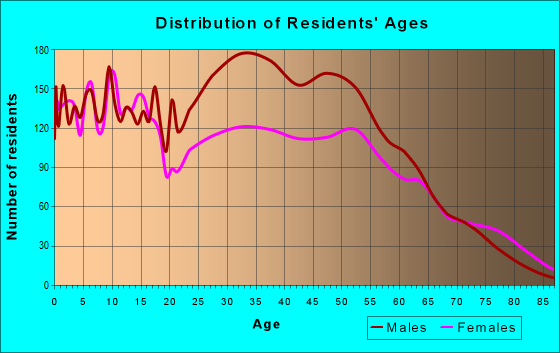
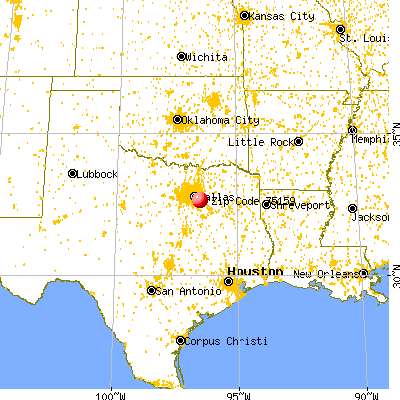


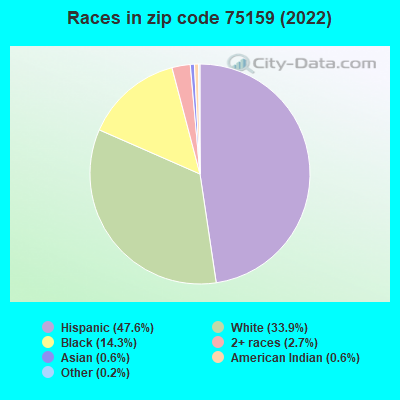


 Nearest zip codes: 75253, 75114, 75125, 75181, 75172, 75180.
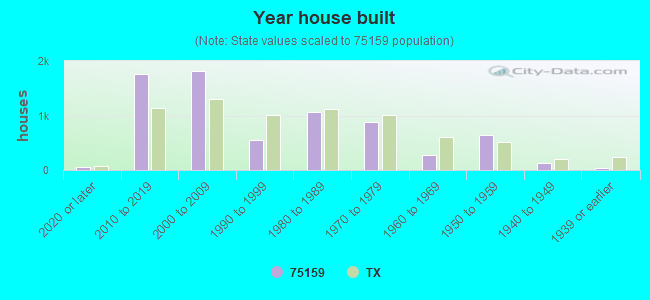
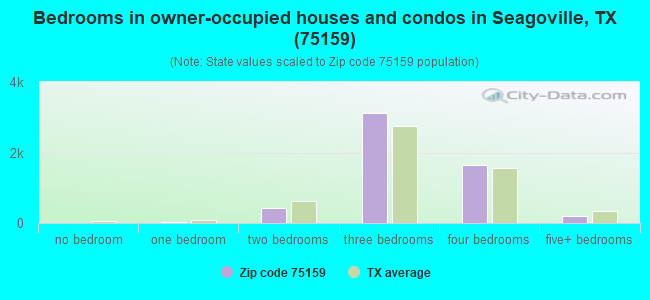
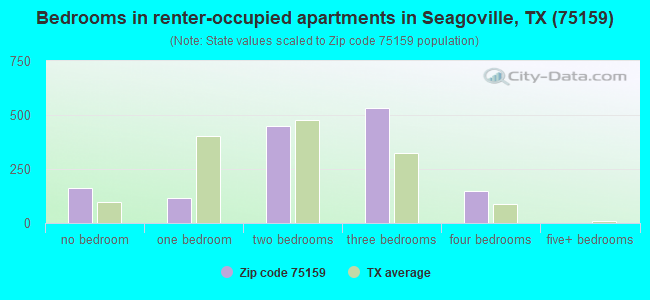
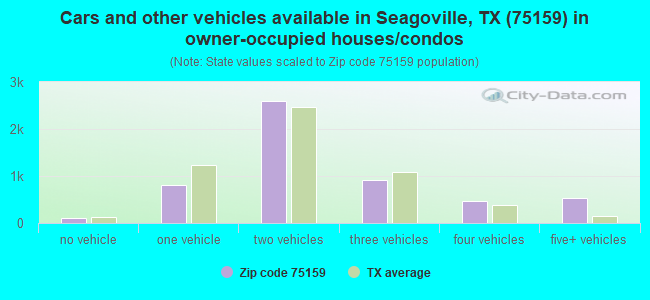
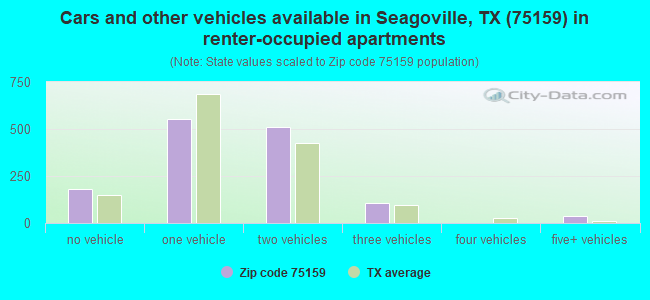


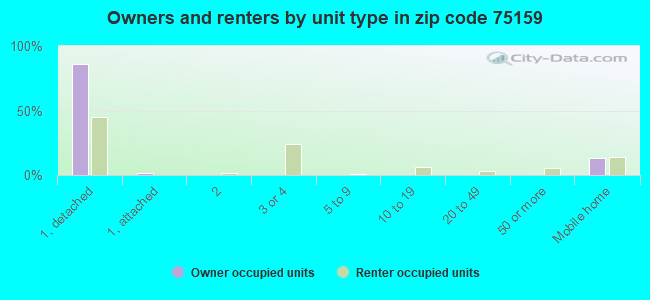
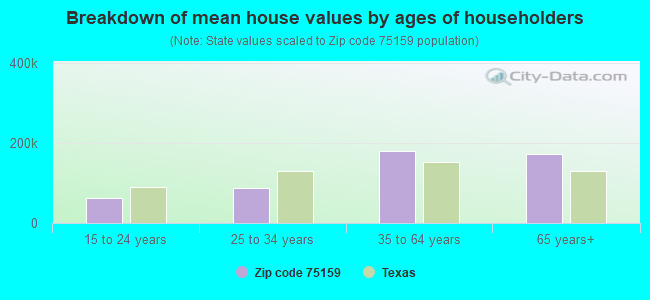


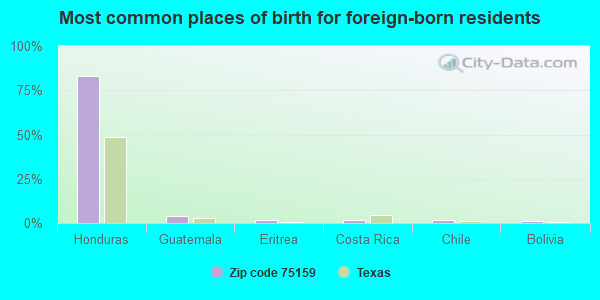
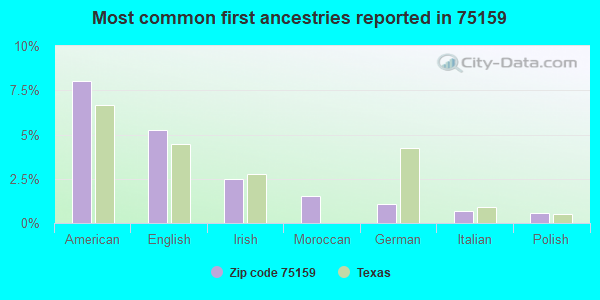
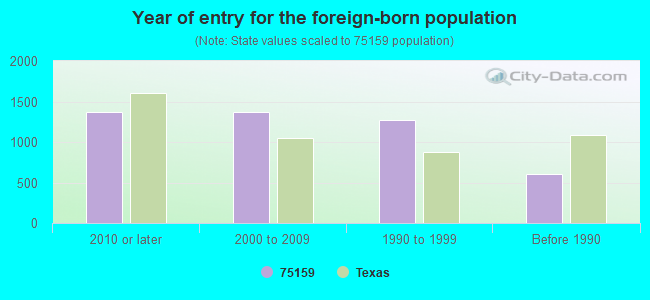
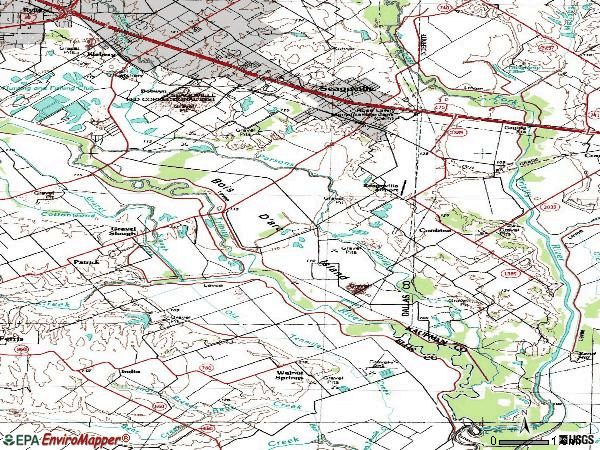

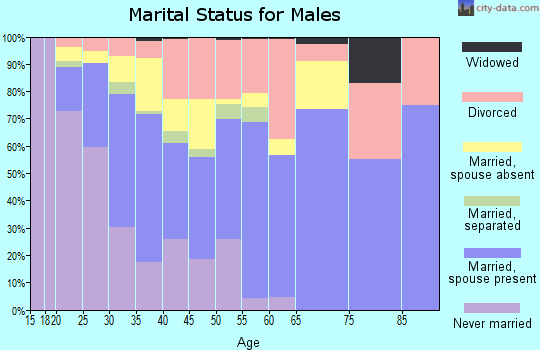
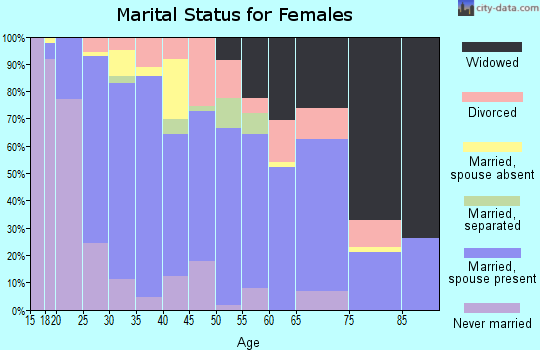
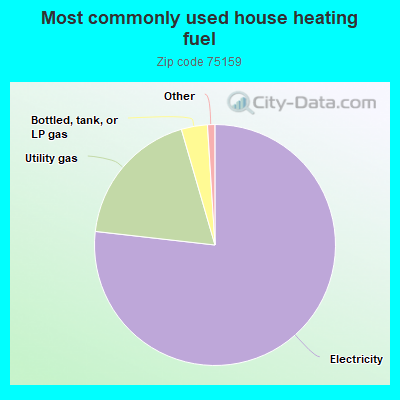
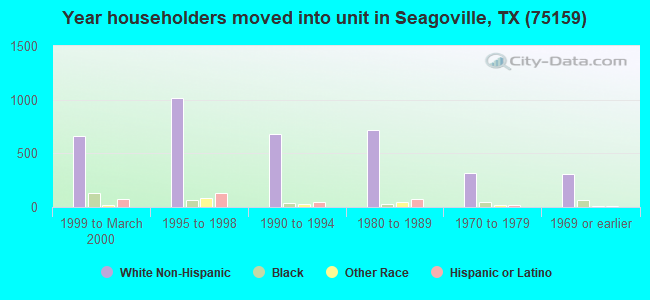
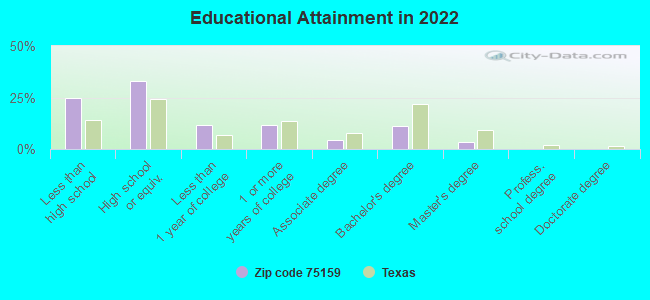
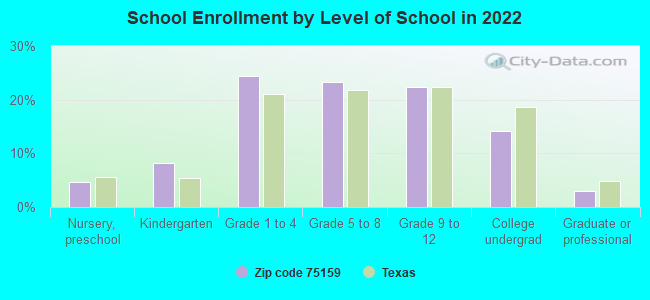
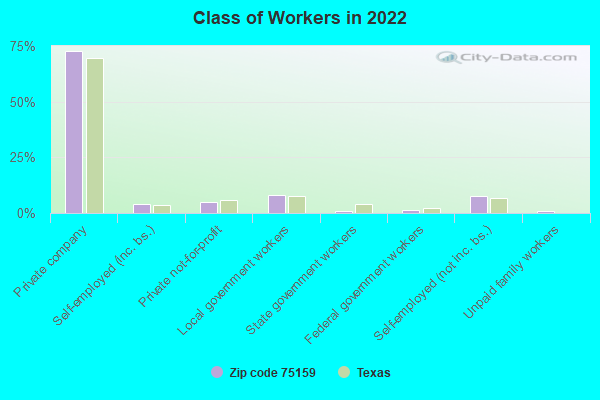
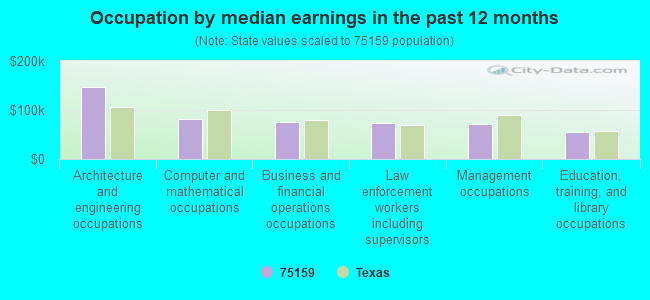
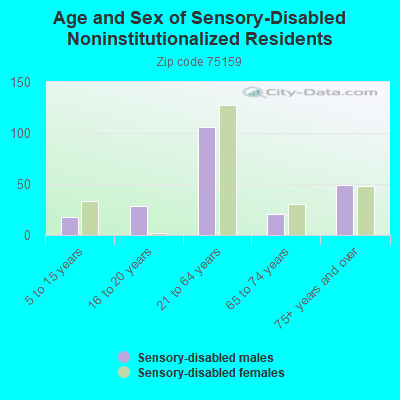
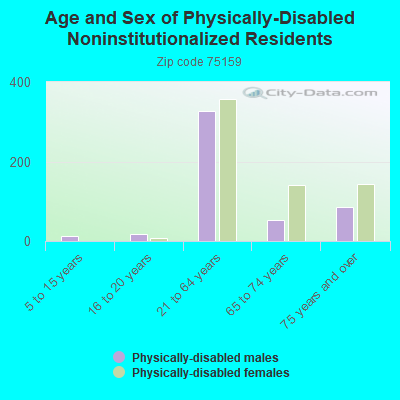
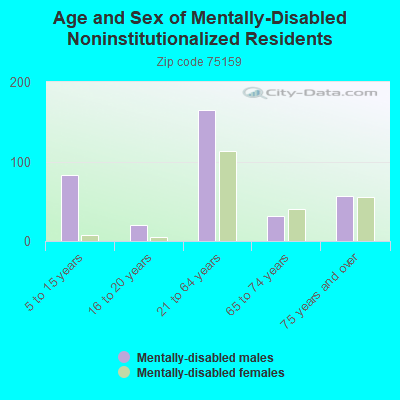
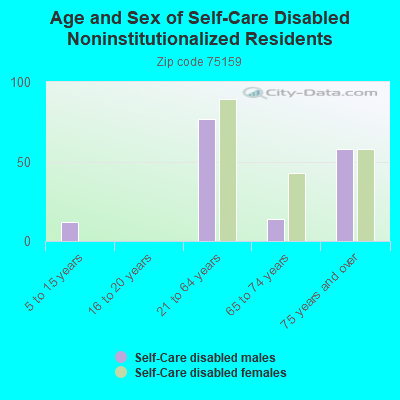
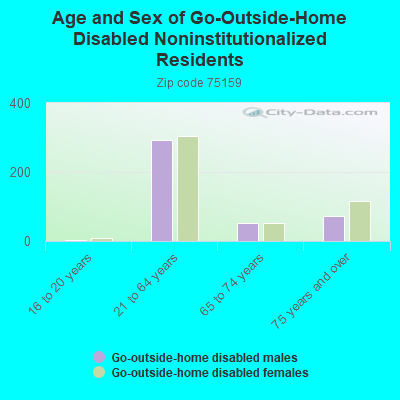
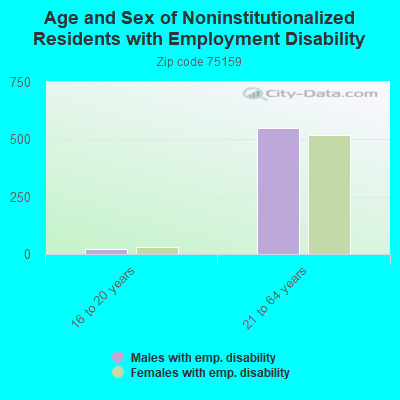
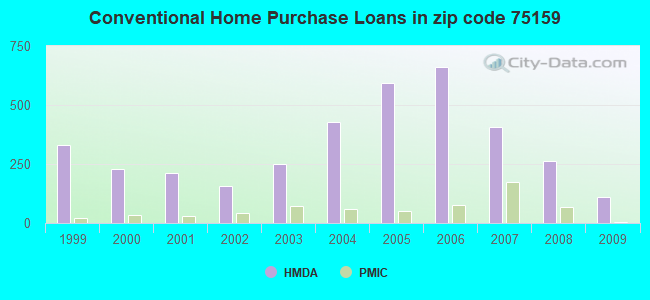
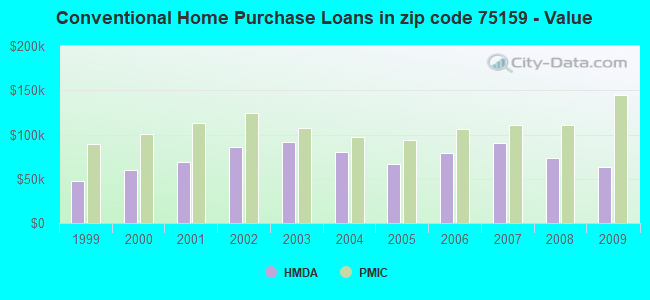
 According to the data from the years 2002 - 2018 the average number of fire incidents per year is 136. The highest number of reported fires - 231 took place in 2008, and the least - 89 in 2015. The data has an increasing trend.
 When looking into fire subcategories, the most reports belonged to: Outside Fires (54.5%), and Structure Fires (24.4%).