Estimated zip code population in 2022: 25,067
Zip code population in 2010: 18,450
Zip code population in 2000: 15,366
Houses and condos: 7,316
Renter-occupied apartments: 2,281
% of renters here:
32%State:
38%
March 2022 cost of living index in zip code 75253: 93.4
(less than average, U.S. average is 100)
Land area: 13.5
sq. mi.
Water area: 0.9
sq. mi.
Population density: 1,855 people per square mile (low).
OSM Map
General Map
Google Map
MSN Map
OSM Map
General Map
Google Map
MSN Map
OSM Map
General Map
Google Map
MSN Map
OSM Map
General Map
Google Map
MSN Map
Please wait while loading the map...
Real estate property taxes paid for housing units in 2022:
This zip code:
1.1% ($1,388)Texas:
1.5% ($4,050)
Median real estate property taxes paid for housing units with mortgages in 2022: $1,722 (0.8%)
Median real estate property taxes paid for housing units with no mortgage in 2022: $786 (1.5%)
Profiles of local businesses
Business Search - 14 Million verified businesses
Males: 12,326 Females: 12,740
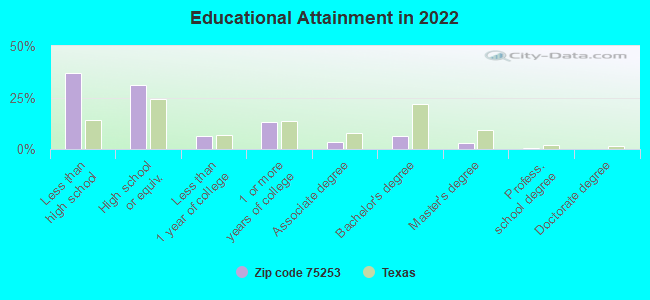
For population 25 years and over in 75253:
High school or higher: 61.4%Bachelor's degree or higher: 9.5%Graduate or professional degree: 3.4%Unemployed: 3.0%Mean travel time to work (commute): 37.4 minutes
For population 15 years and over in 75253:
Never married: 42.9%Now married: 45.3%Separated: 3.1%Widowed: 1.6%Divorced: 7.0%
Zip code 75253 compared to state average:
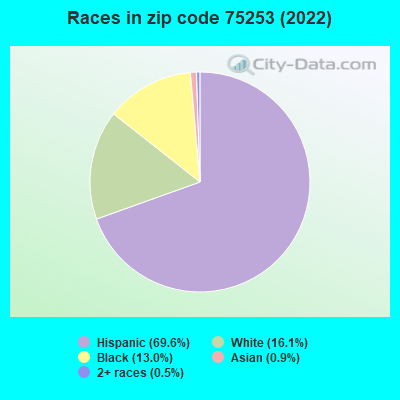
Median house value below state average. Hispanic race population percentage above state average. Median age significantly below state average. Foreign-born population percentage above state average. Length of stay since moving in above state average. House age below state average. Percentage of population with a bachelor's degree or higher significantly below state average. 17,438 69.6% Hispanic or Latino 4,030 16.1% White 3,258 13.0% Black 214 0.9% Asian 125 0.5% Two or more races
Data:
Median household income ($)
Median household income (% change since 2000)
Household income diversity
Ratio of average income to average house value (%)
Ratio of average income to average rent
Median household income ($) - White
Median household income ($) - Black or African American
Median household income ($) - Asian
Median household income ($) - Hispanic or Latino
Median household income ($) - American Indian and Alaska Native
Median household income ($) - Multirace
Median household income ($) - Other Race
Median household income for houses/condos with a mortgage ($)
Median household income for apartments without a mortgage ($)
Races - White alone (%)
Races - White alone (% change since 2000)
Races - Black alone (%)
Races - Black alone (% change since 2000)
Races - American Indian alone (%)
Races - American Indian alone (% change since 2000)
Races - Asian alone (%)
Races - Asian alone (% change since 2000)
Races - Hispanic (%)
Races - Hispanic (% change since 2000)
Races - Native Hawaiian and Other Pacific Islander alone (%)
Races - Native Hawaiian and Other Pacific Islander alone (% change since 2000)
Races - Two or more races (%)
Races - Two or more races (% change since 2000)
Races - Other race alone (%)
Races - Other race alone (% change since 2000)
Racial diversity
Unemployment (%)
Unemployment (% change since 2000)
Unemployment (%) - White
Unemployment (%) - Black or African American
Unemployment (%) - Asian
Unemployment (%) - Hispanic or Latino
Unemployment (%) - American Indian and Alaska Native
Unemployment (%) - Multirace
Unemployment (%) - Other Race
Population density (people per square mile)
Population - Males (%)
Population - Females (%)
Population - Males (%) - White
Population - Males (%) - Black or African American
Population - Males (%) - Asian
Population - Males (%) - Hispanic or Latino
Population - Males (%) - American Indian and Alaska Native
Population - Males (%) - Multirace
Population - Males (%) - Other Race
Population - Females (%) - White
Population - Females (%) - Black or African American
Population - Females (%) - Asian
Population - Females (%) - Hispanic or Latino
Population - Females (%) - American Indian and Alaska Native
Population - Females (%) - Multirace
Population - Females (%) - Other Race
Coronavirus confirmed cases (Apr 27, 2024)
Deaths caused by coronavirus (Apr 27, 2024)
Coronavirus confirmed cases (per 100k population) (Apr 27, 2024)
Deaths caused by coronavirus (per 100k population) (Apr 27, 2024)
Daily increase in number of cases (Apr 27, 2024)
Weekly increase in number of cases (Apr 27, 2024)
Cases doubled (in days) (Apr 27, 2024)
Hospitalized patients (Apr 18, 2022)
Negative test results (Apr 18, 2022)
Total test results (Apr 18, 2022)
COVID Vaccine doses distributed (per 100k population) (Sep 19, 2023)
COVID Vaccine doses administered (per 100k population) (Sep 19, 2023)
COVID Vaccine doses distributed (Sep 19, 2023)
COVID Vaccine doses administered (Sep 19, 2023)
Likely homosexual households (%)
Likely homosexual households (% change since 2000)
Likely homosexual households - Lesbian couples (%)
Likely homosexual households - Lesbian couples (% change since 2000)
Likely homosexual households - Gay men (%)
Likely homosexual households - Gay men (% change since 2000)
Cost of living index
Median gross rent ($)
Median contract rent ($)
Median monthly housing costs ($)
Median house or condo value ($)
Median house or condo value ($ change since 2000)
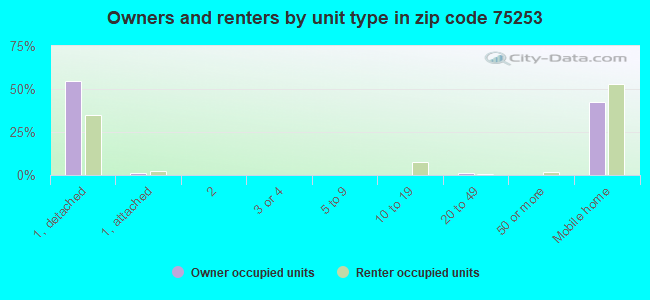
Mean house or condo value by units in structure - 1, detached ($)
Mean house or condo value by units in structure - 1, attached ($)
Mean house or condo value by units in structure - 2 ($)
Mean house or condo value by units in structure by units in structure - 3 or 4 ($)
Mean house or condo value by units in structure - 5 or more ($)
Mean house or condo value by units in structure - Boat, RV, van, etc. ($)
Mean house or condo value by units in structure - Mobile home ($)
Median house or condo value ($) - White
Median house or condo value ($) - Black or African American
Median house or condo value ($) - Asian
Median house or condo value ($) - Hispanic or Latino
Median house or condo value ($) - American Indian and Alaska Native
Median house or condo value ($) - Multirace
Median house or condo value ($) - Other Race
Median resident age
Resident age diversity
Median resident age - Males
Median resident age - Females
Median resident age - White
Median resident age - Black or African American
Median resident age - Asian
Median resident age - Hispanic or Latino
Median resident age - American Indian and Alaska Native
Median resident age - Multirace
Median resident age - Other Race
Median resident age - Males - White
Median resident age - Males - Black or African American
Median resident age - Males - Asian
Median resident age - Males - Hispanic or Latino
Median resident age - Males - American Indian and Alaska Native
Median resident age - Males - Multirace
Median resident age - Males - Other Race
Median resident age - Females - White
Median resident age - Females - Black or African American
Median resident age - Females - Asian
Median resident age - Females - Hispanic or Latino
Median resident age - Females - American Indian and Alaska Native
Median resident age - Females - Multirace
Median resident age - Females - Other Race
Commute - mean travel time to work (minutes)
Travel time to work - Less than 5 minutes (%)
Travel time to work - Less than 5 minutes (% change since 2000)
Travel time to work - 5 to 9 minutes (%)
Travel time to work - 5 to 9 minutes (% change since 2000)
Travel time to work - 10 to 19 minutes (%)
Travel time to work - 10 to 19 minutes (% change since 2000)
Travel time to work - 20 to 29 minutes (%)
Travel time to work - 20 to 29 minutes (% change since 2000)
Travel time to work - 30 to 39 minutes (%)
Travel time to work - 30 to 39 minutes (% change since 2000)
Travel time to work - 40 to 59 minutes (%)
Travel time to work - 40 to 59 minutes (% change since 2000)
Travel time to work - 60 to 89 minutes (%)
Travel time to work - 60 to 89 minutes (% change since 2000)
Travel time to work - 90 or more minutes (%)
Travel time to work - 90 or more minutes (% change since 2000)
Marital status - Never married (%)
Marital status - Now married (%)
Marital status - Separated (%)
Marital status - Widowed (%)
Marital status - Divorced (%)
Median family income ($)
Median family income (% change since 2000)
Median non-family income ($)
Median non-family income (% change since 2000)
Median per capita income ($)
Median per capita income (% change since 2000)
Median family income ($) - White
Median family income ($) - Black or African American
Median family income ($) - Asian
Median family income ($) - Hispanic or Latino
Median family income ($) - American Indian and Alaska Native
Median family income ($) - Multirace
Median family income ($) - Other Race
Median year house/condo built
Median year apartment built
Year house built - Built 2005 or later (%)
Year house built - Built 2000 to 2004 (%)
Year house built - Built 1990 to 1999 (%)
Year house built - Built 1980 to 1989 (%)
Year house built - Built 1970 to 1979 (%)
Year house built - Built 1960 to 1969 (%)
Year house built - Built 1950 to 1959 (%)
Year house built - Built 1940 to 1949 (%)
Year house built - Built 1939 or earlier (%)
Average household size
Household density (households per square mile)
Average household size - White
Average household size - Black or African American
Average household size - Asian
Average household size - Hispanic or Latino
Average household size - American Indian and Alaska Native
Average household size - Multirace
Average household size - Other Race
Occupied housing units (%)
Vacant housing units (%)
Owner occupied housing units (%)
Renter occupied housing units (%)
Vacancy status - For rent (%)
Vacancy status - For sale only (%)
Vacancy status - Rented or sold, not occupied (%)
Vacancy status - For seasonal, recreational, or occasional use (%)
Vacancy status - For migrant workers (%)
Vacancy status - Other vacant (%)
Residents with income below the poverty level (%)
Residents with income below 50% of the poverty level (%)
Children below poverty level (%)
Poor families by family type - Married-couple family (%)
Poor families by family type - Male, no wife present (%)
Poor families by family type - Female, no husband present (%)
Poverty status for native-born residents (%)
Poverty status for foreign-born residents (%)
Poverty among high school graduates not in families (%)
Poverty among people who did not graduate high school not in families (%)
Residents with income below the poverty level (%) - White
Residents with income below the poverty level (%) - Black or African American
Residents with income below the poverty level (%) - Asian
Residents with income below the poverty level (%) - Hispanic or Latino
Residents with income below the poverty level (%) - American Indian and Alaska Native
Residents with income below the poverty level (%) - Multirace
Residents with income below the poverty level (%) - Other Race
Air pollution - Air Quality Index (AQI)
Air pollution - CO
Air pollution - NO2
Air pollution - SO2
Air pollution - Ozone
Air pollution - PM10
Air pollution - PM25
Air pollution - Pb
Crime - Murders per 100,000 population
Crime - Rapes per 100,000 population
Crime - Robberies per 100,000 population
Crime - Assaults per 100,000 population
Crime - Burglaries per 100,000 population
Crime - Thefts per 100,000 population
Crime - Auto thefts per 100,000 population
Crime - Arson per 100,000 population
Crime - City-data.com crime index
Crime - Violent crime index
Crime - Property crime index
Crime - Murders per 100,000 population (5 year average)
Crime - Rapes per 100,000 population (5 year average)
Crime - Robberies per 100,000 population (5 year average)
Crime - Assaults per 100,000 population (5 year average)
Crime - Burglaries per 100,000 population (5 year average)
Crime - Thefts per 100,000 population (5 year average)
Crime - Auto thefts per 100,000 population (5 year average)
Crime - Arson per 100,000 population (5 year average)
Crime - City-data.com crime index (5 year average)
Crime - Violent crime index (5 year average)
Crime - Property crime index (5 year average)
1996 Presidential Elections Results (%) - Democratic Party (Clinton)
1996 Presidential Elections Results (%) - Republican Party (Dole)
1996 Presidential Elections Results (%) - Other
2000 Presidential Elections Results (%) - Democratic Party (Gore)
2000 Presidential Elections Results (%) - Republican Party (Bush)
2000 Presidential Elections Results (%) - Other
2004 Presidential Elections Results (%) - Democratic Party (Kerry)
2004 Presidential Elections Results (%) - Republican Party (Bush)
2004 Presidential Elections Results (%) - Other
2008 Presidential Elections Results (%) - Democratic Party (Obama)
2008 Presidential Elections Results (%) - Republican Party (McCain)
2008 Presidential Elections Results (%) - Other
2012 Presidential Elections Results (%) - Democratic Party (Obama)
2012 Presidential Elections Results (%) - Republican Party (Romney)
2012 Presidential Elections Results (%) - Other
2016 Presidential Elections Results (%) - Democratic Party (Clinton)
2016 Presidential Elections Results (%) - Republican Party (Trump)
2016 Presidential Elections Results (%) - Other
2020 Presidential Elections Results (%) - Democratic Party (Biden)
2020 Presidential Elections Results (%) - Republican Party (Trump)
2020 Presidential Elections Results (%) - Other
Ancestries Reported - Arab (%)
Ancestries Reported - Czech (%)
Ancestries Reported - Danish (%)
Ancestries Reported - Dutch (%)
Ancestries Reported - English (%)
Ancestries Reported - French (%)
Ancestries Reported - French Canadian (%)
Ancestries Reported - German (%)
Ancestries Reported - Greek (%)
Ancestries Reported - Hungarian (%)
Ancestries Reported - Irish (%)
Ancestries Reported - Italian (%)
Ancestries Reported - Lithuanian (%)
Ancestries Reported - Norwegian (%)
Ancestries Reported - Polish (%)
Ancestries Reported - Portuguese (%)
Ancestries Reported - Russian (%)
Ancestries Reported - Scotch-Irish (%)
Ancestries Reported - Scottish (%)
Ancestries Reported - Slovak (%)
Ancestries Reported - Subsaharan African (%)
Ancestries Reported - Swedish (%)
Ancestries Reported - Swiss (%)
Ancestries Reported - Ukrainian (%)
Ancestries Reported - United States (%)
Ancestries Reported - Welsh (%)
Ancestries Reported - West Indian (%)
Ancestries Reported - Other (%)
Educational Attainment - No schooling completed (%)
Educational Attainment - Less than high school (%)
Educational Attainment - High school or equivalent (%)
Educational Attainment - Less than 1 year of college (%)
Educational Attainment - 1 or more years of college (%)
Educational Attainment - Associate degree (%)
Educational Attainment - Bachelor's degree (%)
Educational Attainment - Master's degree (%)
Educational Attainment - Professional school degree (%)
Educational Attainment - Doctorate degree (%)
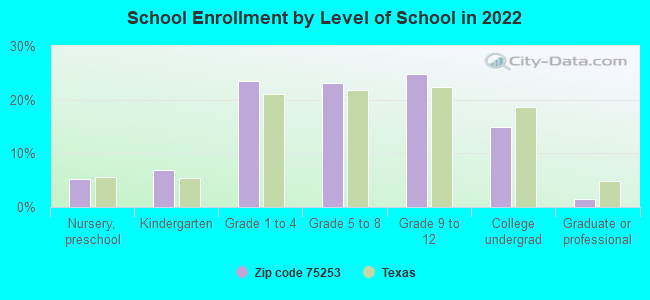
School Enrollment - Nursery, preschool (%)
School Enrollment - Kindergarten (%)
School Enrollment - Grade 1 to 4 (%)
School Enrollment - Grade 5 to 8 (%)
School Enrollment - Grade 9 to 12 (%)
School Enrollment - College undergrad (%)
School Enrollment - Graduate or professional (%)
School Enrollment - Not enrolled in school (%)
School enrollment - Public schools (%)
School enrollment - Private schools (%)
School enrollment - Not enrolled (%)
Median number of rooms in houses and condos
Median number of rooms in apartments
Housing units lacking complete plumbing facilities (%)
Housing units lacking complete kitchen facilities (%)
Density of houses
Urban houses (%)
Rural houses (%)
Households with people 60 years and over (%)
Households with people 65 years and over (%)
Households with people 75 years and over (%)
Households with one or more nonrelatives (%)
Households with no nonrelatives (%)
Population in households (%)
Family households (%)
Nonfamily households (%)
Population in families (%)
Family households with own children (%)
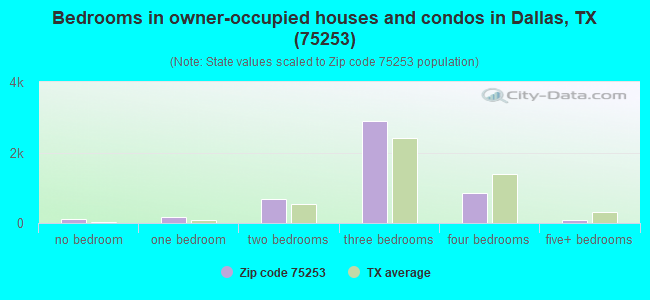
Median number of bedrooms in owner occupied houses
Mean number of bedrooms in owner occupied houses
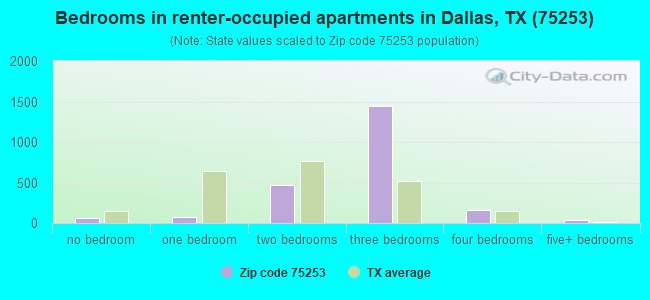
Median number of bedrooms in renter occupied houses
Mean number of bedrooms in renter occupied houses
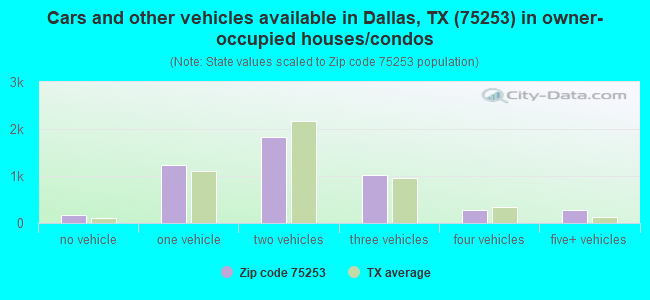
Median number of vehichles in owner occupied houses
Mean number of vehichles in owner occupied houses
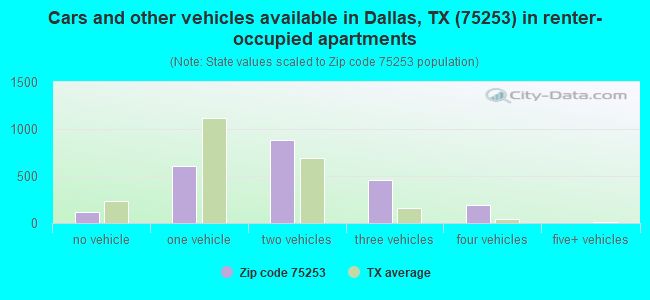
Median number of vehichles in renter occupied houses
Mean number of vehichles in renter occupied houses
Mortgage status - with mortgage (%)
Mortgage status - with second mortgage (%)
Mortgage status - with home equity loan (%)
Mortgage status - with both second mortgage and home equity loan (%)
Mortgage status - without a mortgage (%)
Average family size
Average family size - White
Average family size - Black or African American
Average family size - Asian
Average family size - Hispanic or Latino
Average family size - American Indian and Alaska Native
Average family size - Multirace
Average family size - Other Race
Geographical mobility - Same house 1 year ago (%)
Geographical mobility - Moved within same county (%)
Geographical mobility - Moved from different county within same state (%)
Geographical mobility - Moved from different state (%)
Geographical mobility - Moved from abroad (%)
Place of birth - Born in state of residence (%)
Place of birth - Born in other state (%)
Place of birth - Native, outside of US (%)
Place of birth - Foreign born (%)
Housing units in structures - 1, detached (%)
Housing units in structures - 1, attached (%)
Housing units in structures - 2 (%)
Housing units in structures - 3 or 4 (%)
Housing units in structures - 5 to 9 (%)
Housing units in structures - 10 to 19 (%)
Housing units in structures - 20 to 49 (%)
Housing units in structures - 50 or more (%)
Housing units in structures - Mobile home (%)
Housing units in structures - Boat, RV, van, etc. (%)
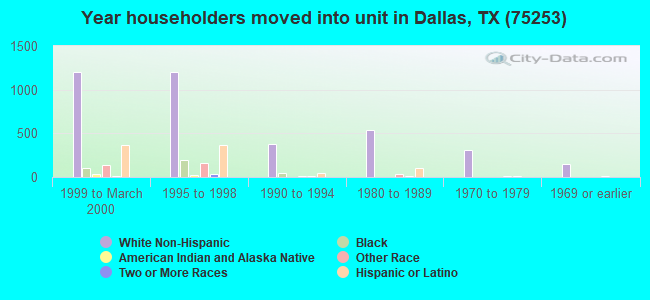
House/condo owner moved in on average (years ago)
Renter moved in on average (years ago)
Year householder moved into unit - Moved in 1999 to March 2000 (%)
Year householder moved into unit - Moved in 1995 to 1998 (%)
Year householder moved into unit - Moved in 1990 to 1994 (%)
Year householder moved into unit - Moved in 1980 to 1989 (%)
Year householder moved into unit - Moved in 1970 to 1979 (%)
Year householder moved into unit - Moved in 1969 or earlier (%)
Means of transportation to work - Drove car alone (%)
Means of transportation to work - Carpooled (%)
Means of transportation to work - Public transportation (%)
Means of transportation to work - Bus or trolley bus (%)
Means of transportation to work - Streetcar or trolley car (%)
Means of transportation to work - Subway or elevated (%)
Means of transportation to work - Railroad (%)
Means of transportation to work - Ferryboat (%)
Means of transportation to work - Taxicab (%)
Means of transportation to work - Motorcycle (%)
Means of transportation to work - Bicycle (%)
Means of transportation to work - Walked (%)
Means of transportation to work - Other means (%)
Working at home (%)
Industry diversity
Most Common Industries - Agriculture, forestry, fishing and hunting, and mining (%)
Most Common Industries - Agriculture, forestry, fishing and hunting (%)
Most Common Industries - Mining, quarrying, and oil and gas extraction (%)
Most Common Industries - Construction (%)
Most Common Industries - Manufacturing (%)
Most Common Industries - Wholesale trade (%)
Most Common Industries - Retail trade (%)
Most Common Industries - Transportation and warehousing, and utilities (%)
Most Common Industries - Transportation and warehousing (%)
Most Common Industries - Utilities (%)
Most Common Industries - Information (%)
Most Common Industries - Finance and insurance, and real estate and rental and leasing (%)
Most Common Industries - Finance and insurance (%)
Most Common Industries - Real estate and rental and leasing (%)
Most Common Industries - Professional, scientific, and management, and administrative and waste management services (%)
Most Common Industries - Professional, scientific, and technical services (%)
Most Common Industries - Management of companies and enterprises (%)
Most Common Industries - Administrative and support and waste management services (%)
Most Common Industries - Educational services, and health care and social assistance (%)
Most Common Industries - Educational services (%)
Most Common Industries - Health care and social assistance (%)
Most Common Industries - Arts, entertainment, and recreation, and accommodation and food services (%)
Most Common Industries - Arts, entertainment, and recreation (%)
Most Common Industries - Accommodation and food services (%)
Most Common Industries - Other services, except public administration (%)
Most Common Industries - Public administration (%)
Occupation diversity
Most Common Occupations - Management, business, science, and arts occupations (%)
Most Common Occupations - Management, business, and financial occupations (%)
Most Common Occupations - Management occupations (%)
Most Common Occupations - Business and financial operations occupations (%)
Most Common Occupations - Computer, engineering, and science occupations (%)
Most Common Occupations - Computer and mathematical occupations (%)
Most Common Occupations - Architecture and engineering occupations (%)
Most Common Occupations - Life, physical, and social science occupations (%)
Most Common Occupations - Education, legal, community service, arts, and media occupations (%)
Most Common Occupations - Community and social service occupations (%)
Most Common Occupations - Legal occupations (%)
Most Common Occupations - Education, training, and library occupations (%)
Most Common Occupations - Arts, design, entertainment, sports, and media occupations (%)
Most Common Occupations - Healthcare practitioners and technical occupations (%)
Most Common Occupations - Health diagnosing and treating practitioners and other technical occupations (%)
Most Common Occupations - Health technologists and technicians (%)
Most Common Occupations - Service occupations (%)
Most Common Occupations - Healthcare support occupations (%)
Most Common Occupations - Protective service occupations (%)
Most Common Occupations - Fire fighting and prevention, and other protective service workers including supervisors (%)
Most Common Occupations - Law enforcement workers including supervisors (%)
Most Common Occupations - Food preparation and serving related occupations (%)
Most Common Occupations - Building and grounds cleaning and maintenance occupations (%)
Most Common Occupations - Personal care and service occupations (%)
Most Common Occupations - Sales and office occupations (%)
Most Common Occupations - Sales and related occupations (%)
Most Common Occupations - Office and administrative support occupations (%)
Most Common Occupations - Natural resources, construction, and maintenance occupations (%)
Most Common Occupations - Farming, fishing, and forestry occupations (%)
Most Common Occupations - Construction and extraction occupations (%)
Most Common Occupations - Installation, maintenance, and repair occupations (%)
Most Common Occupations - Production, transportation, and material moving occupations (%)
Most Common Occupations - Production occupations (%)
Most Common Occupations - Transportation occupations (%)
Most Common Occupations - Material moving occupations (%)
People in Group quarters - Institutionalized population (%)
People in Group quarters - Correctional institutions (%)
People in Group quarters - Federal prisons and detention centers (%)
People in Group quarters - Halfway houses (%)
People in Group quarters - Local jails and other confinement facilities (including police lockups) (%)
People in Group quarters - Military disciplinary barracks (%)
People in Group quarters - State prisons (%)
People in Group quarters - Other types of correctional institutions (%)
People in Group quarters - Nursing homes (%)
People in Group quarters - Hospitals/wards, hospices, and schools for the handicapped (%)
People in Group quarters - Hospitals/wards and hospices for chronically ill (%)
People in Group quarters - Hospices or homes for chronically ill (%)
People in Group quarters - Military hospitals or wards for chronically ill (%)
People in Group quarters - Other hospitals or wards for chronically ill (%)
People in Group quarters - Hospitals or wards for drug/alcohol abuse (%)
People in Group quarters - Mental (Psychiatric) hospitals or wards (%)
People in Group quarters - Schools, hospitals, or wards for the mentally retarded (%)
People in Group quarters - Schools, hospitals, or wards for the physically handicapped (%)
People in Group quarters - Institutions for the deaf (%)
People in Group quarters - Institutions for the blind (%)
People in Group quarters - Orthopedic wards and institutions for the physically handicapped (%)
People in Group quarters - Wards in general hospitals for patients who have no usual home elsewhere (%)
People in Group quarters - Wards in military hospitals for patients who have no usual home elsewhere (%)
People in Group quarters - Juvenile institutions (%)
People in Group quarters - Long-term care (%)
People in Group quarters - Homes for abused, dependent, and neglected children (%)
People in Group quarters - Residential treatment centers for emotionally disturbed children (%)
People in Group quarters - Training schools for juvenile delinquents (%)
People in Group quarters - Short-term care, detention or diagnostic centers for delinquent children (%)
People in Group quarters - Type of juvenile institution unknown (%)
People in Group quarters - Noninstitutionalized population (%)
People in Group quarters - College dormitories (includes college quarters off campus) (%)
People in Group quarters - Military quarters (%)
People in Group quarters - On base (%)
People in Group quarters - Barracks, unaccompanied personnel housing (UPH), (Enlisted/Officer), ;and similar group living quarters for military personnel (%)
People in Group quarters - Transient quarters for temporary residents (%)
People in Group quarters - Military ships (%)
People in Group quarters - Group homes (%)
People in Group quarters - Homes or halfway houses for drug/alcohol abuse (%)
People in Group quarters - Homes for the mentally ill (%)
People in Group quarters - Homes for the mentally retarded (%)
People in Group quarters - Homes for the physically handicapped (%)
People in Group quarters - Other group homes (%)
People in Group quarters - Religious group quarters (%)
People in Group quarters - Dormitories (%)
People in Group quarters - Agriculture workers' dormitories on farms (%)
People in Group quarters - Job Corps and vocational training facilities (%)
People in Group quarters - Other workers' dormitories (%)
People in Group quarters - Crews of maritime vessels (%)
People in Group quarters - Other nonhousehold living situations (%)
People in Group quarters - Other noninstitutional group quarters (%)
Residents speaking English at home (%)
Residents speaking English at home - Born in the United States (%)
Residents speaking English at home - Native, born elsewhere (%)
Residents speaking English at home - Foreign born (%)
Residents speaking Spanish at home (%)
Residents speaking Spanish at home - Born in the United States (%)
Residents speaking Spanish at home - Native, born elsewhere (%)
Residents speaking Spanish at home - Foreign born (%)
Residents speaking other language at home (%)
Residents speaking other language at home - Born in the United States (%)
Residents speaking other language at home - Native, born elsewhere (%)
Residents speaking other language at home - Foreign born (%)
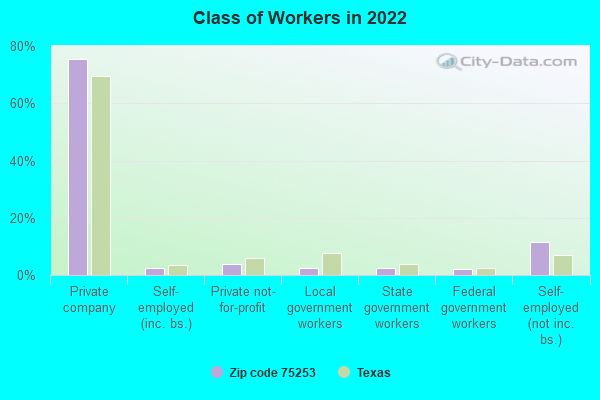
Class of Workers - Employee of private company (%)
Class of Workers - Self-employed in own incorporated business (%)
Class of Workers - Private not-for-profit wage and salary workers (%)
Class of Workers - Local government workers (%)
Class of Workers - State government workers (%)
Class of Workers - Federal government workers (%)
Class of Workers - Self-employed workers in own not incorporated business and Unpaid family workers (%)
House heating fuel used in houses and condos - Utility gas (%)
House heating fuel used in houses and condos - Bottled, tank, or LP gas (%)
House heating fuel used in houses and condos - Electricity (%)
House heating fuel used in houses and condos - Fuel oil, kerosene, etc. (%)
House heating fuel used in houses and condos - Coal or coke (%)
House heating fuel used in houses and condos - Wood (%)
House heating fuel used in houses and condos - Solar energy (%)
House heating fuel used in houses and condos - Other fuel (%)
House heating fuel used in houses and condos - No fuel used (%)
House heating fuel used in apartments - Utility gas (%)
House heating fuel used in apartments - Bottled, tank, or LP gas (%)
House heating fuel used in apartments - Electricity (%)
House heating fuel used in apartments - Fuel oil, kerosene, etc. (%)
House heating fuel used in apartments - Coal or coke (%)
House heating fuel used in apartments - Wood (%)
House heating fuel used in apartments - Solar energy (%)
House heating fuel used in apartments - Other fuel (%)
House heating fuel used in apartments - No fuel used (%)
Armed forces status - In Armed Forces (%)
Armed forces status - Civilian (%)
Armed forces status - Civilian - Veteran (%)
Armed forces status - Civilian - Nonveteran (%)
Fatal accidents locations in years 2005-2021
Fatal accidents locations in 2005
Fatal accidents locations in 2006
Fatal accidents locations in 2007
Fatal accidents locations in 2008
Fatal accidents locations in 2009
Fatal accidents locations in 2010
Fatal accidents locations in 2011
Fatal accidents locations in 2012
Fatal accidents locations in 2013
Fatal accidents locations in 2014
Fatal accidents locations in 2015
Fatal accidents locations in 2016
Fatal accidents locations in 2017
Fatal accidents locations in 2018
Fatal accidents locations in 2019
Fatal accidents locations in 2020
Fatal accidents locations in 2021
Alcohol use - People drinking some alcohol every month (%)
Alcohol use - People not drinking at all (%)
Alcohol use - Average days/month drinking alcohol
Alcohol use - Average drinks/week
Alcohol use - Average days/year people drink much
Audiometry - Average condition of hearing (%)
Audiometry - People that can hear a whisper from across a quiet room (%)
Audiometry - People that can hear normal voice from across a quiet room (%)
Audiometry - Ears ringing, roaring, buzzing (%)
Audiometry - Had a job exposure to loud noise (%)
Audiometry - Had off-work exposure to loud noise (%)
Blood Pressure & Cholesterol - Has high blood pressure (%)
Blood Pressure & Cholesterol - Checking blood pressure at home (%)
Blood Pressure & Cholesterol - Frequently checking blood cholesterol (%)
Blood Pressure & Cholesterol - Has high cholesterol level (%)
Consumer Behavior - Money monthly spent on food at supermarket/grocery store
Consumer Behavior - Money monthly spent on food at other stores
Consumer Behavior - Money monthly spent on eating out
Consumer Behavior - Money monthly spent on carryout/delivered foods
Consumer Behavior - Income spent on food at supermarket/grocery store (%)
Consumer Behavior - Income spent on food at other stores (%)
Consumer Behavior - Income spent on eating out (%)
Consumer Behavior - Income spent on carryout/delivered foods (%)
Current Health Status - General health condition (%)
Current Health Status - Blood donors (%)
Current Health Status - Has blood ever tested for HIV virus (%)
Current Health Status - Left-handed people (%)
Dermatology - People using sunscreen (%)
Diabetes - Diabetics (%)
Diabetes - Had a blood test for high blood sugar (%)
Diabetes - People taking insulin (%)
Diet Behavior & Nutrition - Diet health (%)
Diet Behavior & Nutrition - Milk product consumption (# of products/month)
Diet Behavior & Nutrition - Meals not home prepared (#/week)
Diet Behavior & Nutrition - Meals from fast food or pizza place (#/week)
Diet Behavior & Nutrition - Ready-to-eat foods (#/month)
Diet Behavior & Nutrition - Frozen meals/pizza (#/month)
Drug Use - People that ever used marijuana or hashish (%)
Drug Use - Ever used hard drugs (%)
Drug Use - Ever used any form of cocaine (%)
Drug Use - Ever used heroin (%)
Drug Use - Ever used methamphetamine (%)
Health Insurance - People covered by health insurance (%)
Kidney Conditions-Urology - Avg. # of times urinating at night
Medical Conditions - People with asthma (%)
Medical Conditions - People with anemia (%)
Medical Conditions - People with psoriasis (%)
Medical Conditions - People with overweight (%)
Medical Conditions - Elderly people having difficulties in thinking or remembering (%)
Medical Conditions - People who ever received blood transfusion (%)
Medical Conditions - People having trouble seeing even with glass/contacts (%)
Medical Conditions - People with arthritis (%)
Medical Conditions - People with gout (%)
Medical Conditions - People with congestive heart failure (%)
Medical Conditions - People with coronary heart disease (%)
Medical Conditions - People with angina pectoris (%)
Medical Conditions - People who ever had heart attack (%)
Medical Conditions - People who ever had stroke (%)
Medical Conditions - People with emphysema (%)
Medical Conditions - People with thyroid problem (%)
Medical Conditions - People with chronic bronchitis (%)
Medical Conditions - People with any liver condition (%)
Medical Conditions - People who ever had cancer or malignancy (%)
Mental Health - People who have little interest in doing things (%)
Mental Health - People feeling down, depressed, or hopeless (%)
Mental Health - People who have trouble sleeping or sleeping too much (%)
Mental Health - People feeling tired or having little energy (%)
Mental Health - People with poor appetite or overeating (%)
Mental Health - People feeling bad about themself (%)
Mental Health - People who have trouble concentrating on things (%)
Mental Health - People moving or speaking slowly or too fast (%)
Mental Health - People having thoughts they would be better off dead (%)
Oral Health - Average years since last visit a dentist
Oral Health - People embarrassed because of mouth (%)
Oral Health - People with gum disease (%)
Oral Health - General health of teeth and gums (%)
Oral Health - Average days a week using dental floss/device
Oral Health - Average days a week using mouthwash for dental problem
Oral Health - Average number of teeth
Pesticide Use - Households using pesticides to control insects (%)
Pesticide Use - Households using pesticides to kill weeds (%)
Physical Activity - People doing vigorous-intensity work activities (%)
Physical Activity - People doing moderate-intensity work activities (%)
Physical Activity - People walking or bicycling (%)
Physical Activity - People doing vigorous-intensity recreational activities (%)
Physical Activity - People doing moderate-intensity recreational activities (%)
Physical Activity - Average hours a day doing sedentary activities
Physical Activity - Average hours a day watching TV or videos
Physical Activity - Average hours a day using computer
Physical Functioning - People having limitations keeping them from working (%)
Physical Functioning - People limited in amount of work they can do (%)
Physical Functioning - People that need special equipment to walk (%)
Physical Functioning - People experiencing confusion/memory problems (%)
Physical Functioning - People requiring special healthcare equipment (%)
Prescription Medications - Average number of prescription medicines taking
Preventive Aspirin Use - Adults 40+ taking low-dose aspirin (%)
Reproductive Health - Vaginal deliveries (%)
Reproductive Health - Cesarean deliveries (%)
Reproductive Health - Deliveries resulted in a live birth (%)
Reproductive Health - Pregnancies resulted in a delivery (%)
Reproductive Health - Women breastfeeding newborns (%)
Reproductive Health - Women that had a hysterectomy (%)
Reproductive Health - Women that had both ovaries removed (%)
Reproductive Health - Women that have ever taken birth control pills (%)
Reproductive Health - Women taking birth control pills (%)
Reproductive Health - Women that have ever used Depo-Provera or injectables (%)
Reproductive Health - Women that have ever used female hormones (%)
Sexual Behavior - People 18+ that ever had sex (vaginal, anal, or oral) (%)
Sexual Behavior - Males 18+ that ever had vaginal sex with a woman (%)
Sexual Behavior - Males 18+ that ever performed oral sex on a woman (%)
Sexual Behavior - Males 18+ that ever had anal sex with a woman (%)
Sexual Behavior - Males 18+ that ever had any sex with a man (%)
Sexual Behavior - Females 18+ that ever had vaginal sex with a man (%)
Sexual Behavior - Females 18+ that ever performed oral sex on a man (%)
Sexual Behavior - Females 18+ that ever had anal sex with a man (%)
Sexual Behavior - Females 18+ that ever had any kind of sex with a woman (%)
Sexual Behavior - Average age people first had sex
Sexual Behavior - Average number of female sex partners in lifetime (males 18+)
Sexual Behavior - Average number of female vaginal sex partners in lifetime (males 18+)
Sexual Behavior - Average age people first performed oral sex on a woman (18+)
Sexual Behavior - Average number of woman performed oral sex on in lifetime (18+)
Sexual Behavior - Average number of male sex partners in lifetime (males 18+)
Sexual Behavior - Average number of male anal sex partners in lifetime (males 18+)
Sexual Behavior - Average age people first performed oral sex on a man (18+)
Sexual Behavior - Average number of male oral sex partners in lifetime (18+)
Sexual Behavior - People using protection when performing oral sex (%)
Sexual Behavior - Average number of times people have vaginal or anal sex a year
Sexual Behavior - People having sex without condom (%)
Sexual Behavior - Average number of male sex partners in lifetime (females 18+)
Sexual Behavior - Average number of male vaginal sex partners in lifetime (females 18+)
Sexual Behavior - Average number of female sex partners in lifetime (females 18+)
Sexual Behavior - Circumcised males 18+ (%)
Sleep Disorders - Average hours sleeping at night
Sleep Disorders - People that has trouble sleeping (%)
Smoking-Cigarette Use - People smoking cigarettes (%)
Taste & Smell - People 40+ having problems with smell (%)
Taste & Smell - People 40+ having problems with taste (%)
Taste & Smell - People 40+ that ever had wisdom teeth removed (%)
Taste & Smell - People 40+ that ever had tonsils teeth removed (%)
Taste & Smell - People 40+ that ever had a loss of consciousness because of a head injury (%)
Taste & Smell - People 40+ that ever had a broken nose or other serious injury to face or skull (%)
Taste & Smell - People 40+ that ever had two or more sinus infections (%)
Weight - Average height (inches)
Weight - Average weight (pounds)
Weight - Average BMI
Weight - People that are obese (%)
Weight - People that ever were obese (%)
Weight - People trying to lose weight (%)
Urban population: 23,497
Rural population: 1,569
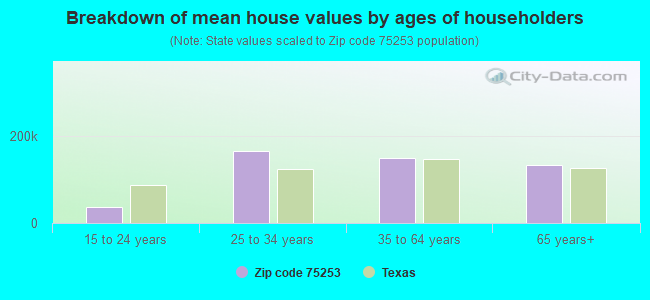
Estimated median house/condo value in 2022: $131,799
75253:
$131,799Texas:
$275,400
Median resident age: This zip code:
25.9 yearsTexas median age:
35.6 years
Average household size: This zip code:
3.5 peopleTexas:
2.6 people
Averages for the 2020 tax year for zip code 75253, filed in 2021:
Average Adjusted Gross Income (AGI) in 2020: $35,106 (Individual Income Tax Returns) Here:
$35,106State:
$77,054
Salary/wage: $35,790 (reported on 82.9% of returns )Here:
$35,790State:
$62,766
(% of AGI for various income ranges: 1294.6% for AGIs below $25k , 3913.3% for AGIs $25k-50k , 6993.7% for AGIs $50k-75k , 9991.3% for AGIs $75k-100k , 16980.0% for AGIs $100k-200k ) Taxable interest for individuals: $337 (reported on 5.1% of returns )This zip code:
$337Texas:
$2,665
(% of AGI for various income ranges: 1.4% for AGIs below $25k , 1.3% for AGIs $25k-50k , 3.8% for AGIs $50k-75k , 2.9% for AGIs $75k-100k , 21.2% for AGIs $100k-200k ) Ordinary dividends: $1,173 (reported on 1.6% of returns )(% of AGI for various income ranges: 1.4% for AGIs below $25k , 2.7% for AGIs $25k-50k , 1.6% for AGIs $50k-75k , 25.3% for AGIs $100k-200k ) Net capital gain/loss in AGI: +$4,306 (reported on 1.9% of returns )Here:
+$4,306State:
+$39,590
(% of AGI for various income ranges: 2.4% for AGIs $25k-50k , 8.2% for AGIs $50k-75k , 370.6% for AGIs $100k-200k ) Profit/loss from business: +$8,723 (reported on 28.2% of returns )Here:
+$8,723State:
+$10,888
(% of AGI for various income ranges: 374.4% for AGIs below $25k , 247.5% for AGIs $25k-50k , 288.0% for AGIs $50k-75k , 272.9% for AGIs $75k-100k , 652.4% for AGIs $100k-200k ) Taxable individual retirement arrangement distribution: $13,708 (reported on 1.3% of returns )75253:
$13,708Texas:
$24,740
(% of AGI for various income ranges: 5.7% for AGIs below $25k , 15.9% for AGIs $25k-50k , 25.5% for AGIs $50k-75k , 204.2% for AGIs $75k-100k ) Total itemized deductions: $28,111 (reported on 2.9% of returns )Here:
$28,111State:
$40,428
(% of AGI for various income ranges: 17.2% for AGIs below $25k , 83.7% for AGIs $25k-50k , 242.9% for AGIs $50k-75k , 308.4% for AGIs $75k-100k , 814.7% for AGIs $100k-200k ) Charity contributions: $9,000 (reported on 2.3% of returns )(% of AGI for various income ranges: 19.5% for AGIs $25k-50k , 57.3% for AGIs $50k-75k , 119.2% for AGIs $75k-100k , 240.0% for AGIs $100k-200k ) Taxes paid: $5,885 (reported on 2.8% of returns )(% of AGI for various income ranges: 22.7% for AGIs $25k-50k , 49.2% for AGIs $50k-75k , 55.8% for AGIs $75k-100k , 153.5% for AGIs $100k-200k ) Earned income credit: $3,058 (reported on 29.3% of returns )(% of AGI for various income ranges: 185.0% for AGIs below $25k , 103.5% for AGIs $25k-50k , 1.5% for AGIs $50k-75k ) Percentage of individuals using paid preparers for their 2020 taxes: 86.8%(% for various income ranges: 84.6% for AGIs below $25k , 87.3% for AGIs $25k-50k , 89.8% for AGIs $50k-75k , 90.0% for AGIs $75k-100k , 92.9% for AGIs $100k-200k )
Averages for the 2012 tax year for zip code 75253, filed in 2013:
Average Adjusted Gross Income (AGI) in 2012: $28,064 (Individual Income Tax Returns) Here:
$28,064State:
$65,384
Salary/wage: $27,988 (reported on 86.1% of returns )Here:
$27,988State:
$52,524
(% of AGI for various income ranges: 76.4% for AGIs below $25k , 91.6% for AGIs $25k-50k , 90.3% for AGIs $50k-75k , 86.7% for AGIs $75k-100k , 72.7% for AGIs $100k-200k ) Taxable interest for individuals: $607 (reported on 6.1% of returns )This zip code:
$607Texas:
$2,372
(% of AGI for various income ranges: 0.2% for AGIs below $25k , 0.1% for AGIs $50k-75k , 0.5% for AGIs $100k-200k ) Ordinary dividends: $4,900 (reported on 2.7% of returns )(% of AGI for various income ranges: 0.7% for AGIs below $25k , 0.6% for AGIs $25k-50k , 0.4% for AGIs $75k-100k ) Net capital gain/loss in AGI: +$5,889 (reported on 1.3% of returns )Here:
+$5,889State:
+$35,319
(% of AGI for various income ranges: 0.2% for AGIs below $25k , 3.2% for AGIs $75k-100k ) Profit/loss from business: +$8,841 (reported on 22.0% of returns )Here:
+$8,841State:
+$13,732
(% of AGI for various income ranges: 18.2% for AGIs below $25k , 3.4% for AGIs $25k-50k , 2.2% for AGIs $50k-75k , 4.3% for AGIs $75k-100k ) Taxable individual retirement arrangement distribution: $10,946 (reported on 1.9% of returns )75253:
$10,946Texas:
$19,511
(% of AGI for various income ranges: 0.4% for AGIs below $25k , 0.3% for AGIs $25k-50k , 1.0% for AGIs $50k-75k , 4.7% for AGIs $75k-100k ) Total itemized deductions: $17,088 (33% of AGI, reported on 8.8% of returns )Here:
$17,088State:
$24,724
Here:
32.6% of AGIState:
15.9% of AGI
(% of AGI for various income ranges: 2.2% for AGIs below $25k , 5.2% for AGIs $25k-50k , 7.9% for AGIs $50k-75k , 7.0% for AGIs $75k-100k , 10.3% for AGIs $100k-200k ) Charity contributions: $4,285 (reported on 5.9% of returns )(% of AGI for various income ranges: 0.3% for AGIs below $25k , 0.8% for AGIs $25k-50k , 1.2% for AGIs $50k-75k , 1.6% for AGIs $75k-100k , 2.8% for AGIs $100k-200k ) Taxes paid: $3,320 (reported on 8.2% of returns )(% of AGI for various income ranges: 0.3% for AGIs below $25k , 0.9% for AGIs $25k-50k , 1.4% for AGIs $50k-75k , 1.4% for AGIs $75k-100k , 2.1% for AGIs $100k-200k ) Earned income credit: $2,929 (reported on 35.0% of returns )(% of AGI for various income ranges: 10.9% for AGIs below $25k , 1.9% for AGIs $25k-50k ) Percentage of individuals using paid preparers for their 2012 taxes: 62.5%(% for various income ranges: 62.1% for AGIs below $25k , 63.7% for AGIs $25k-50k , 63.8% for AGIs $50k-75k , 52.9% for AGIs $75k-100k , 55.6% for AGIs $100k-200k )
Averages for the 2004 tax year for zip code 75253, filed in 2005:
Average Adjusted Gross Income (AGI) in 2004: $26,336 (Individual Income Tax Returns) Here:
$26,336State:
$47,881
Salary/wage: $26,672 (reported on 87.9% of returns )Here:
$26,672State:
$41,947
(% of AGI for various income ranges: 96.2% for AGIs below $10k , 86.7% for AGIs $10k-25k , 90.8% for AGIs $25k-50k , 89.7% for AGIs $50k-75k , 89.5% for AGIs $75k-100k , 77.9% for AGIs over 100k ) Taxable interest for individuals: $993 (reported on 11.7% of returns )This zip code:
$993Texas:
$2,255
(% of AGI for various income ranges: 1.0% for AGIs below $10k , 0.2% for AGIs $10k-25k , 0.6% for AGIs $25k-50k , 0.3% for AGIs $50k-75k , 0.2% for AGIs $75k-100k , 0.8% for AGIs over 100k ) Taxable dividends: $884 (reported on 3.7% of returns )(% of AGI for various income ranges: 0.6% for AGIs below $10k , 0.0% for AGIs $10k-25k , 0.2% for AGIs $25k-50k , 0.1% for AGIs $50k-75k , 0.2% for AGIs $75k-100k ) Net capital gain/loss: +$2,220 (reported on 2.8% of returns )Here:
+$2,220State:
+$16,110
(% of AGI for various income ranges: -0.5% for AGIs below $10k , 0.0% for AGIs $10k-25k , 0.2% for AGIs $25k-50k , 0.9% for AGIs $50k-75k , 0.3% for AGIs $75k-100k ) Profit/loss from business: +$6,596 (reported on 16.2% of returns )Here:
+$6,596State:
+$11,013
(% of AGI for various income ranges: 13.1% for AGIs below $10k , 8.4% for AGIs $10k-25k , 3.3% for AGIs $25k-50k , 1.4% for AGIs $50k-75k , -0.1% for AGIs $75k-100k ) IRA payment deduction: $2,410 (reported on 0.8% of returns )Total itemized deductions: $13,929 (28% of AGI, reported on 10.2% of returns )Here:
$13,929State:
$19,631
Here:
27.8% of AGIState:
18.9% of AGI
(% of AGI for various income ranges: 2.9% for AGIs below $10k , 2.8% for AGIs $10k-25k , 6.1% for AGIs $25k-50k , 6.4% for AGIs $50k-75k , 8.2% for AGIs $75k-100k , 6.3% for AGIs over 100k ) Charity contributions deductions: $3,402 (6% of AGI, reported on 7.3% of returns )Here:
6.4% of AGIState:
4.2% of AGI
(% of AGI for various income ranges: 0.4% for AGIs $10k-25k , 0.9% for AGIs $25k-50k , 1.2% for AGIs $50k-75k , 2.1% for AGIs $75k-100k , 1.9% for AGIs over 100k ) Total tax: $2,659 (reported on 59.6% of returns )(% of AGI for various income ranges: 4.5% for AGIs below $10k , 3.3% for AGIs $10k-25k , 5.0% for AGIs $25k-50k , 8.3% for AGIs $50k-75k , 11.1% for AGIs $75k-100k , 13.0% for AGIs over 100k ) Earned income credit: $1,969 (reported on 34.0% of returns )Percentage of individuals using paid preparers for their 2004 taxes: 64.8%(% for various income ranges: 55.6% for AGIs below $10k , 71.1% for AGIs $10k-25k , 65.7% for AGIs $25k-50k , 60.3% for AGIs $50k-75k , 56.8% for AGIs $75k-100k , 54.1% for AGIs over 100k )
Estimated median household income in 2022: This zip code:
$51,111Texas:
$72,284
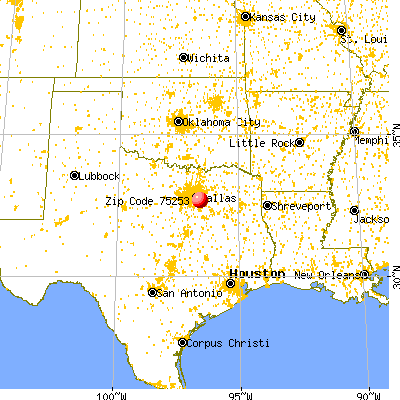
Nearest zip codes: 75180 ,
75181 ,
75217 ,
75141 ,
75172 ,
75159 .
Seagoville Zip Code Map
Percentage of family households: This zip code:
67.8%Texas:
50.5%
Percentage of households with unmarried partners: This zip code:
13.9%Texas:
48.7%
Likely homosexual households (counted as self-reported same-sex unmarried-partner households)
Lesbian couples: 0.0% of all households Gay men: 0.1% of all households
Household received Food Stamps/SNAP in the past 12 months: 1,445Household did not receive Food Stamps/SNAP in the past 12 months: 5,662
Women who had a birth in the past 12 months: 689 (340 now married , 341 unmarried) Women who did not have a birth in the past 12 months: 6,615 (2,583 now married , 4,042 unmarried)
Housing units in zip code 75253 with a mortgage: 2,515 (102
second mortgage )
Median monthly owner costs for units with a mortgage: $1,383
Median monthly owner costs for units without a mortgage: $746
Residents with income below the poverty level in 2022:
This zip code:
21.9%Whole state:
14.0%
Residents with income below 50% of the poverty level in 2022:
This zip code:
11.7%Whole state:
7.4%
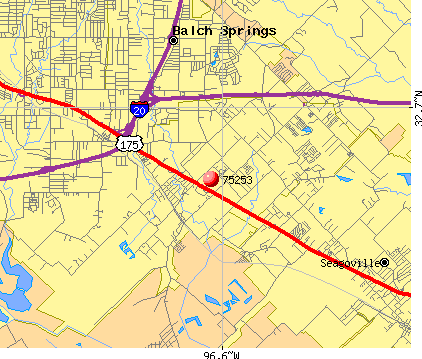
Median number of rooms in houses and condos: Median number of rooms in apartments: Notable locations in this zip code not listed on our city pages
Click to draw/clear zip code borders Notable locations in zip code 75253: (A) , Ten Mile Creek Wastewater Treatment Plant (B) , Dallas Fire - Rescue Station 9 (C) . Display/hide their locations on the map
Churches in zip code 75253 include: (A) , Kleberg Church of Christ (B) , Oak Hill Assembly of God Church (C) , Bethel Baptist Church (D) , Blessed Hope Baptist Church (E) , Grace Baptist Church (F) , Full Gospel Baptist Church (G) , First Baptist Church - Kleberg (H) , New Heights Baptist Church (I) . Display/hide their locations on the map
Year house built (houses)
49 2020 or later1,918 2010 to 20191,331 2000 to 20091,279 1990 to 19991,369 1980 to 1989421 1970 to 1979398 1960 to 1969283 1950 to 195996 1940 to 194986 1939 or earlier
Zip code 75253 household income distribution in 2022 607 Less than $10,000126 $10,000 to $14,999117 $15,000 to $19,999489 $20,000 to $24,999352 $25,000 to $29,999335 $30,000 to $34,999477 $35,000 to $39,999278 $40,000 to $44,999720 $45,000 to $49,999435 $50,000 to $59,9991,152 $60,000 to $74,999935 $75,000 to $99,999480 $100,000 to $124,999276 $125,000 to $149,999188 $150,000 to $199,999126 $200,000 or moreEstimate of home value of owner-occupied houses/condos in 2022 in zip code 75253 674 Less than $10,000328 $10,000 to $14,999136 $15,000 to $19,999176 $20,000 to $24,999109 $25,000 to $29,999104 $30,000 to $34,999116 $35,000 to $39,999118 $40,000 to $49,99942 $50,000 to $59,99986 $60,000 to $69,99958 $70,000 to $79,99969 $80,000 to $89,99993 $90,000 to $99,999313 $100,000 to $124,999170 $125,000 to $149,999202 $150,000 to $174,999245 $175,000 to $199,999627 $200,000 to $249,999500 $250,000 to $299,999228 $300,000 to $399,99911 $500,000 to $749,99943 $1,000,000 to $1,499,999Rent paid by renters in 2022 in zip code 75253 21 $400 to $44927 $450 to $499125 $550 to $59982 $600 to $64957 $650 to $699118 $700 to $749118 $750 to $799127 $800 to $89971 $900 to $999732 $1,000 to $1,249171 $1,250 to $1,499304 $1,500 to $1,999242 No cash rent
Median gross rent in 2022: $1,371.
Median price asked for vacant for-sale houses and condos in 2022: $269,680.
Estimated median house (or condo) value in 2022 for: White Non-Hispanic householders: $213,528Black or African American householders: $265,806American Indian or Alaska Native householders: $1,012,419Asian householders: $414,171Some other race householders: $178,185Two or more races householders: $77,680Hispanic or Latino householders: $189,598Estimated median house or condo value in 2022: $131,799
75253:
$131,799Texas:
$275,400
Lower value quartile - upper value quartile: $28,959 - $246,978
Mean price in 2022: Detached houses: $134,599Here:
$134,599State:
$369,058
Townhouses or other attached units: $96,036Here:
$96,036State:
$327,631
Mobile homes: $48,633Here:
$48,633State:
$124,413
Housing units in structures:
One, detached: 3,383One, attached: 1093 or 4: 135 to 9: 4410 to 19: 21720 to 49: 7250 or more: 45Mobile homes: 3,240Unemployment : 3.0%
Means of transportation to work in zip code 75253 77.2% 8,233 Drove a car alone13.4% 1,428 Carpooled0.8% 84 Bus or trolley bus0.2% 17 Motorcycle0.7% 75 Walked0.4% 45 Other means4.6% 489 Worked at homeTravel time to work (commute) in zip code 75253 142 Less than 5 minutes199 5 to 9 minutes640 10 to 14 minutes1,190 15 to 19 minutes1,138 20 to 24 minutes794 25 to 29 minutes1,342 30 to 34 minutes121 35 to 39 minutes447 40 to 44 minutes1,267 45 to 59 minutes2,155 60 to 89 minutes447 90 or more minutes
Neighborhoods in zip code 75253: Percentage of zip code residents living and working in this county: 78.3%
Household type by relationship:
Households: 25,067
Male householders: 3,306 (480 living alone ), Female householders: 3,778 (608 living alone )3,358 spouses (3,358 opposite-sex spouses ), 896 unmarried partners , (896 opposite-sex unmarried partners ), 11,322 children (10,832 natural , 59 adopted , 429 stepchildren ), 595 grandchildren , 248 brothers or sisters , 281 parents , 160 foster children , 511 other relatives , 397 non-relatives In group quarters: 87 (-1 institutionalized population )
Size of family households: 1,155 2-persons , 1,407 3-persons , 979 4-persons , 1,075 5-persons , 481 6-persons , 491 7-or-more-persons
Size of nonfamily households: 1,087 1-person , 204 2-persons , 57 3-persons , 34 4-persons , 30 5-persons
4,912 married couples with children. single-parent households (992 men , 2,150 women ).
34.2% of residents of 75253 zip code speak English at home. of residents speak Spanish at home (58% very well, 22% well, 13% not well, 7% not at all ).of residents speak other Indo-European language at home (100% very well ).of residents speak Asian or Pacific Island language at home (59% very well, 41% well ).of residents speak other language at home (93% very well, 7% well ).
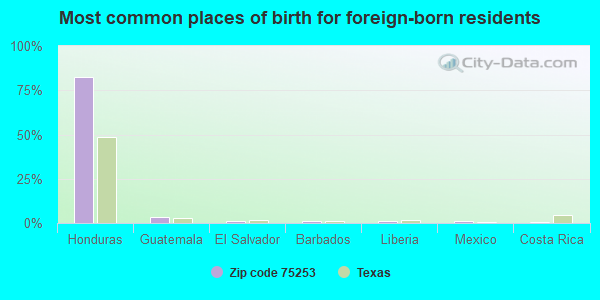
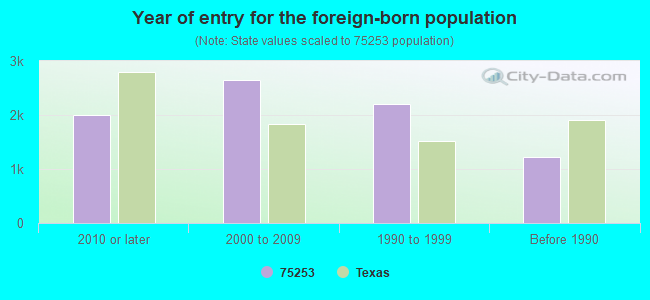
Foreign born population: 7,784 (31.1%)
(19.9%
of them are naturalized citizens )
This zip code:
31.1%Whole state:
17.2%
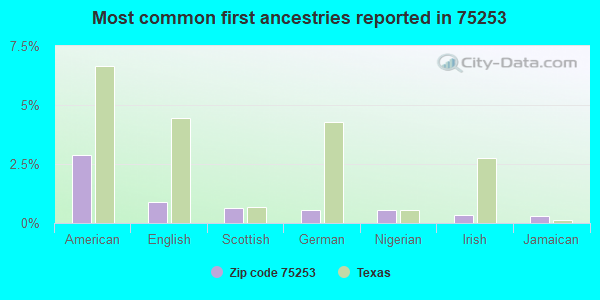
82% Honduras 4% Guatemala 1% El Salvador 1% Barbados 1% Liberia 1% Mexico 1% Costa Rica 3% American 1% English 1% Scottish 1% German 1% Nigerian 0% Irish 0% Jamaican
Year of entry for the foreign-born population
2,006 2010 or later 2,644 2000 to 2009 2,199 1990 to 1999 1,216 Before 1990
There are
4 Medical Specialists in Zip Code 75253 .
Facilities with environmental interests located in this zip code:
A C EQUIPMENT UNLIMITED INC (2531 S BELTLINE RD in DALLAS, TX)
(Resource Conservation and Recovery Act (tracking hazardous waste)) Alternative names: A/C EQUIP UNLTD INC
Housing units lacking complete plumbing facilities: 0.4%
Housing units lacking complete kitchen facilities: 1.3%
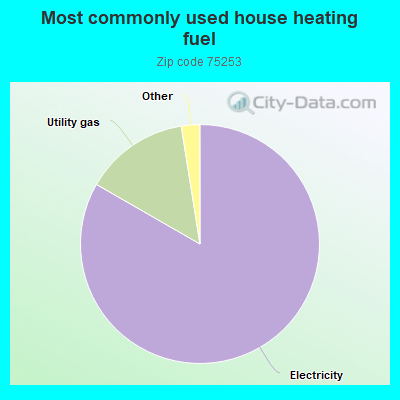
83.4% Electricity 14.2% Utility gas 0.7% Fuel oil, kerosene, etc. 0.6% Solar energy 0.6% Other fuel
Population in 1990: 10,252. Population change in the 1990s: +5,114 (+49.9%).
Place of birth for U.S.-born residents:
This state: 14,473Northeast: 296Midwest: 388South: 910West: 733
37% of the 75253 zip code residents lived in the same house 5 years ago.
Out of people who lived in different houses, 74% lived in this county.
Out of people who lived in different counties, 50% lived in Texas.
93% of the 75253 zip code residents lived in the same house 1 year ago.
Out of people who lived in different houses, 60% moved from this county.
Out of people who lived in different houses, 25% moved from different county within same state.
Out of people who lived in different houses, 13% moved from different state.
Out of people who lived in different houses, 2% moved from abroad.
Private vs. public school enrollment:
Students in private schools in grades 1 to 8 (elementary and middle school): 123
Students in private schools in grades 9 to 12 (high school): 47
Students in private undergraduate colleges: 300
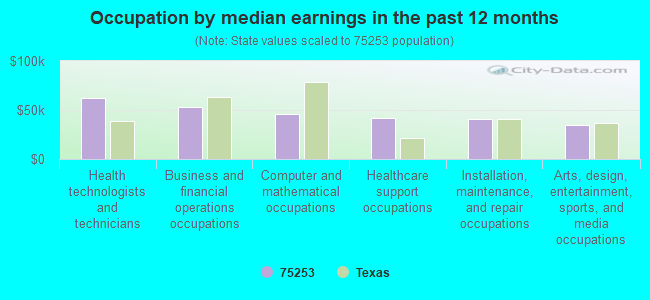
Occupation by median earnings in the past 12 months ($)
62,743 Health technologists and technicians 52,631 Business and financial operations occupations 45,865 Computer and mathematical occupations 41,749 Healthcare support occupations 41,193 Installation, maintenance, and repair occupations 35,096 Arts, design, entertainment, sports, and media occupations
Companies with federal contracts located in this zip code:
BEACON INDUSTRIES INC (1814 S WOODY RD in DALLAS, TX; small business) in 11 contracts from 2000 to 2005
Contracts for Aircraft Landing Equipment, Airframe Structural Components by Navy, Defense Logistics AgencySigned by year: 2000: $339,139; 2001: $299,700; 2002: $0; 2003: $37,260; 2004: $104,406; 2005: $149,823; 2006: $0.
Biggest contracts: with Navy for Aircraft Landing Equipment. Signed on 2001-06-01. Completion date: 2002-02-28.
with Navy for Airframe Structural Components. Taking place in NJ. Signed on 2000-10-23. Completion date: 2001-09-09.
with Defense Logistics Agency for Airframe Structural Components. Signed on 2000-08-11. Completion date: 2001-07-06.
, same as above. Signed on 2005-01-18. Completion date: 2005-11-24.
Top industries in this zip code by the number of employees in 2005:
Construction: Poured Concrete Foundation and Structure Contractors (50-99 employees: 1 establishment, 20-49 employees: 2 establishments, 5-9 employees: 1 establishment)Accommodation and Food Services: Limited-Service Restaurants (20-49: 1, 10-19: 1, 5-9: 2, 1-4: 3)Construction: Plumbing, Heating, and Air-Conditioning Contractors (20-49: 1, 10-19: 1, 5-9: 1, 1-4: 1)Accommodation and Food Services: Full-Service Restaurants (20-49: 1, 10-19: 1, 1-4: 1)Information: Wired Telecommunications Carriers (20-49: 1, 1-4: 2)
People in group quarters in 2000:
55 people in other noninstitutional group quarters
Fatal accident statistics in 2013:
Fatal accident count: 2Vehicles involved in fatal accidents: 3Fatal accidents caused by drunken drivers: 1Fatalities: 2Persons involved in fatal accidents: 5Pedestrians involved in fatal accidents: 0
Fatal accident statistics in 2011:
Fatal accident count: 1Vehicles involved in fatal accidents: 2Fatal accidents caused by drunken drivers: 0Fatalities: 1Persons involved in fatal accidents: 2Pedestrians involved in fatal accidents: 0
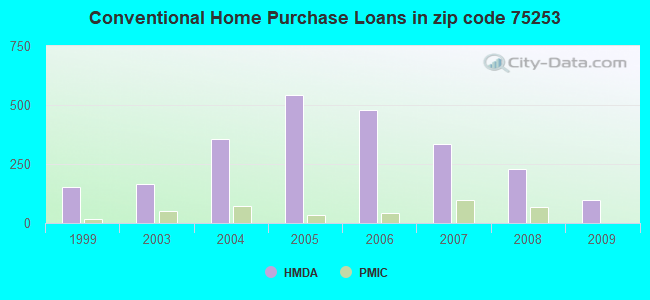
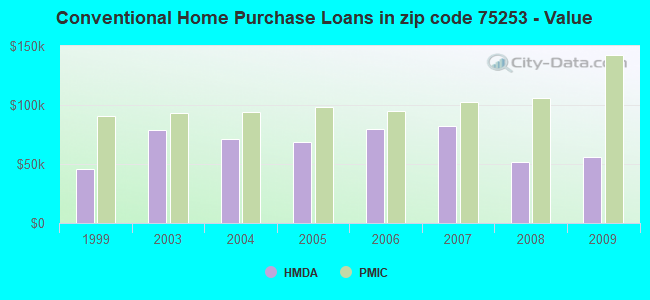
Home Mortgage Disclosure Act Aggregated Statistics For Year 2009(Based on 8 partial tracts) A) FHA, FSA/RHS & VA B) Conventional C) Refinancings D) Home Improvement Loans F) Non-occupant Loans on G) Loans On Manufactured Number Average Value Number Average Value Number Average Value Number Average Value Number Average Value Number Average Value
LOANS ORIGINATED 112 $107,414 96 $55,818 82 $111,774 15 $28,071 42 $78,698 45 $23,808 APPLICATIONS APPROVED, NOT ACCEPTED 7 $103,969 3 $84,123 11 $103,135 2 $21,750 2 $142,585 2 $22,795 APPLICATIONS DENIED 27 $113,901 33 $58,981 79 $86,734 27 $15,961 21 $59,956 22 $27,800 APPLICATIONS WITHDRAWN 12 $122,045 21 $58,158 37 $97,122 1 $84,820 8 $82,010 10 $23,181 FILES CLOSED FOR INCOMPLETENESS 2 $106,870 4 $114,838 16 $94,751 2 $24,310 6 $74,632 0 $0
Aggregated Statistics For Year 2008(Based on 8 partial tracts) A) FHA, FSA/RHS & VA B) Conventional C) Refinancings D) Home Improvement Loans F) Non-occupant Loans on G) Loans On Manufactured Number Average Value Number Average Value Number Average Value Number Average Value Number Average Value Number Average Value
LOANS ORIGINATED 127 $111,814 229 $51,750 68 $98,872 16 $23,123 72 $82,505 127 $23,888 APPLICATIONS APPROVED, NOT ACCEPTED 11 $108,654 37 $46,220 14 $78,220 5 $20,218 2 $86,210 31 $32,304 APPLICATIONS DENIED 45 $105,883 61 $73,339 114 $99,070 65 $24,558 21 $80,102 27 $27,346 APPLICATIONS WITHDRAWN 38 $116,592 27 $93,386 49 $104,069 3 $35,310 15 $78,809 5 $22,096 FILES CLOSED FOR INCOMPLETENESS 6 $89,455 9 $118,117 7 $104,294 0 $0 6 $83,915 0 $0
Aggregated Statistics For Year 2007(Based on 8 partial tracts) A) FHA, FSA/RHS & VA B) Conventional C) Refinancings D) Home Improvement Loans E) Loans on Dwellings For 5+ Families F) Non-occupant Loans on G) Loans On Manufactured Number Average Value Number Average Value Number Average Value Number Average Value Number Average Value Number Average Value Number Average Value
LOANS ORIGINATED 97 $116,785 335 $82,047 83 $98,291 34 $29,093 8 $3,896,294 105 $76,615 53 $26,644 APPLICATIONS APPROVED, NOT ACCEPTED 4 $78,080 86 $85,377 40 $109,719 9 $15,839 0 $0 63 $77,084 15 $30,480 APPLICATIONS DENIED 47 $121,215 283 $69,065 198 $103,508 79 $22,732 0 $0 98 $72,884 101 $27,220 APPLICATIONS WITHDRAWN 20 $133,803 57 $93,729 85 $94,136 4 $62,432 2 $1,235,190 19 $61,788 6 $54,412 FILES CLOSED FOR INCOMPLETENESS 3 $128,890 34 $123,137 34 $129,668 2 $57,870 0 $0 11 $91,995 0 $0
Aggregated Statistics For Year 2006(Based on 8 partial tracts) A) FHA, FSA/RHS & VA B) Conventional C) Refinancings D) Home Improvement Loans F) Non-occupant Loans on G) Loans On Manufactured Number Average Value Number Average Value Number Average Value Number Average Value Number Average Value Number Average Value
LOANS ORIGINATED 80 $114,454 480 $79,796 114 $82,570 27 $41,760 90 $64,335 10 $31,809 APPLICATIONS APPROVED, NOT ACCEPTED 3 $106,460 89 $83,236 48 $91,302 7 $15,741 27 $78,231 9 $21,638 APPLICATIONS DENIED 22 $119,365 262 $83,777 194 $90,924 85 $31,354 60 $67,477 22 $39,839 APPLICATIONS WITHDRAWN 27 $128,675 160 $76,959 133 $97,278 6 $87,475 23 $59,895 0 $0 FILES CLOSED FOR INCOMPLETENESS 2 $70,295 22 $82,361 31 $100,979 0 $0 2 $36,890 0 $0
Aggregated Statistics For Year 2005(Based on 8 partial tracts) A) FHA, FSA/RHS & VA B) Conventional C) Refinancings D) Home Improvement Loans F) Non-occupant Loans on G) Loans On Manufactured Number Average Value Number Average Value Number Average Value Number Average Value Number Average Value Number Average Value
LOANS ORIGINATED 56 $105,823 544 $68,389 165 $84,651 38 $86,205 127 $69,084 45 $23,196 APPLICATIONS APPROVED, NOT ACCEPTED 2 $80,905 116 $53,842 24 $76,325 3 $41,447 15 $51,807 8 $31,702 APPLICATIONS DENIED 35 $112,296 257 $75,540 228 $84,481 68 $29,421 56 $65,816 27 $33,510 APPLICATIONS WITHDRAWN 15 $102,395 131 $73,581 126 $104,417 35 $167,369 40 $69,107 14 $28,964 FILES CLOSED FOR INCOMPLETENESS 2 $134,945 20 $72,732 49 $96,469 0 $0 8 $84,664 0 $0
Aggregated Statistics For Year 2004(Based on 8 partial tracts) A) FHA, FSA/RHS & VA B) Conventional C) Refinancings D) Home Improvement Loans F) Non-occupant Loans on G) Loans On Manufactured Number Average Value Number Average Value Number Average Value Number Average Value Number Average Value Number Average Value
LOANS ORIGINATED 138 $106,593 355 $71,319 210 $82,698 14 $46,565 75 $76,545 36 $23,524 APPLICATIONS APPROVED, NOT ACCEPTED 7 $93,350 83 $73,737 40 $71,258 3 $33,403 16 $76,218 16 $34,444 APPLICATIONS DENIED 32 $120,437 128 $68,371 215 $77,349 56 $16,683 50 $60,574 31 $29,861 APPLICATIONS WITHDRAWN 16 $107,078 49 $68,916 123 $79,020 8 $28,570 11 $72,413 6 $42,678 FILES CLOSED FOR INCOMPLETENESS 2 $117,270 37 $81,069 51 $91,130 4 $24,535 4 $58,992 2 $18,415
Aggregated Statistics For Year 2003(Based on 8 partial tracts) A) FHA, FSA/RHS & VA B) Conventional C) Refinancings D) Home Improvement Loans F) Non-occupant Loans on Number Average Value Number Average Value Number Average Value Number Average Value Number Average Value
LOANS ORIGINATED 74 $97,435 166 $78,440 360 $75,812 22 $17,772 73 $60,021 APPLICATIONS APPROVED, NOT ACCEPTED 7 $97,160 43 $73,742 51 $92,341 2 $19,920 15 $91,114 APPLICATIONS DENIED 23 $116,328 121 $65,223 313 $73,003 34 $23,303 21 $77,353 APPLICATIONS WITHDRAWN 21 $100,551 15 $100,933 163 $78,257 7 $44,740 10 $78,122 FILES CLOSED FOR INCOMPLETENESS 10 $92,779 26 $89,771 20 $83,904 0 $0 2 $69,135
Aggregated Statistics For Year 1999(Based on 3 partial tracts) A) FHA, FSA/RHS & VA B) Conventional C) Refinancings D) Home Improvement Loans F) Non-occupant Loans on Number Average Value Number Average Value Number Average Value Number Average Value Number Average Value
LOANS ORIGINATED 57 $75,030 154 $45,887 56 $64,889 20 $15,076 12 $50,509 APPLICATIONS APPROVED, NOT ACCEPTED 1 $114,040 72 $44,612 22 $53,939 11 $14,895 6 $48,005 APPLICATIONS DENIED 7 $77,219 296 $40,615 33 $59,792 35 $12,962 12 $48,436 APPLICATIONS WITHDRAWN 6 $87,888 15 $55,315 27 $61,757 4 $10,235 0 $0 FILES CLOSED FOR INCOMPLETENESS 2 $68,275 6 $68,065 8 $56,695 0 $0 2 $34,515
Detailed HMDA statistics for the following Tracts:
0170.04
,
0171.01 ,
0171.02 ,
0173.05
Private Mortgage Insurance Companies Aggregated Statistics For Year 2009(Based on 8 partial tracts) A) Conventional C) Non-occupant Loans on Number Average Value Number Average Value
LOANS ORIGINATED 2 $142,415 0 $0 APPLICATIONS APPROVED, NOT ACCEPTED 6 $98,067 4 $79,792 APPLICATIONS DENIED 1 $118,300 0 $0 APPLICATIONS WITHDRAWN 0 $0 0 $0 FILES CLOSED FOR INCOMPLETENESS 0 $0 0 $0
Aggregated Statistics For Year 2008(Based on 8 partial tracts) A) Conventional B) Refinancings C) Non-occupant Loans on Number Average Value Number Average Value Number Average Value
LOANS ORIGINATED 66 $105,597 6 $111,830 32 $95,293 APPLICATIONS APPROVED, NOT ACCEPTED 33 $108,066 5 $96,454 11 $88,296 APPLICATIONS DENIED 9 $100,722 0 $0 7 $91,850 APPLICATIONS WITHDRAWN 3 $73,593 0 $0 2 $87,535 FILES CLOSED FOR INCOMPLETENESS 2 $99,875 0 $0 0 $0
Aggregated Statistics For Year 2007(Based on 8 partial tracts) A) Conventional B) Refinancings C) Non-occupant Loans on Number Average Value Number Average Value Number Average Value
LOANS ORIGINATED 99 $102,138 13 $116,640 23 $94,034 APPLICATIONS APPROVED, NOT ACCEPTED 26 $144,460 3 $102,570 9 $118,180 APPLICATIONS DENIED 12 $108,591 0 $0 7 $109,217 APPLICATIONS WITHDRAWN 5 $91,044 0 $0 2 $38,360 FILES CLOSED FOR INCOMPLETENESS 0 $0 0 $0 0 $0
Aggregated Statistics For Year 2006(Based on 8 partial tracts) A) Conventional B) Refinancings C) Non-occupant Loans on Number Average Value Number Average Value Number Average Value
LOANS ORIGINATED 42 $94,543 2 $152,935 2 $139,510 APPLICATIONS APPROVED, NOT ACCEPTED 3 $124,303 0 $0 0 $0 APPLICATIONS DENIED 0 $0 0 $0 0 $0 APPLICATIONS WITHDRAWN 2 $71,120 0 $0 0 $0 FILES CLOSED FOR INCOMPLETENESS 0 $0 0 $0 0 $0
Aggregated Statistics For Year 2005(Based on 8 partial tracts) A) Conventional B) Refinancings C) Non-occupant Loans on Number Average Value Number Average Value Number Average Value
LOANS ORIGINATED 34 $98,555 3 $122,657 0 $0 APPLICATIONS APPROVED, NOT ACCEPTED 9 $113,920 1 $206,790 3 $69,410 APPLICATIONS DENIED 0 $0 0 $0 0 $0 APPLICATIONS WITHDRAWN 3 $126,960 0 $0 3 $119,333 FILES CLOSED FOR INCOMPLETENESS 2 $121,020 0 $0 0 $0
Aggregated Statistics For Year 2004(Based on 8 partial tracts) A) Conventional B) Refinancings C) Non-occupant Loans on Number Average Value Number Average Value Number Average Value
LOANS ORIGINATED 73 $93,824 12 $99,615 22 $77,276 APPLICATIONS APPROVED, NOT ACCEPTED 6 $104,473 4 $89,775 3 $84,637 APPLICATIONS DENIED 2 $86,695 2 $125,830 2 $86,695 APPLICATIONS WITHDRAWN 7 $118,691 4 $109,655 2 $125,295 FILES CLOSED FOR INCOMPLETENESS 2 $91,180 0 $0 0 $0
Aggregated Statistics For Year 2003(Based on 8 partial tracts) A) Conventional B) Refinancings C) Non-occupant Loans on Number Average Value Number Average Value Number Average Value
LOANS ORIGINATED 50 $93,128 17 $107,492 14 $73,521 APPLICATIONS APPROVED, NOT ACCEPTED 7 $106,850 1 $174,420 2 $58,355 APPLICATIONS DENIED 5 $112,352 2 $93,150 0 $0 APPLICATIONS WITHDRAWN 4 $106,002 0 $0 2 $85,545 FILES CLOSED FOR INCOMPLETENESS 0 $0 0 $0 0 $0
Aggregated Statistics For Year 1999(Based on 3 partial tracts) A) Conventional B) Refinancings C) Non-occupant Loans on Number Average Value Number Average Value Number Average Value
LOANS ORIGINATED 16 $90,398 4 $91,162 2 $43,650 APPLICATIONS APPROVED, NOT ACCEPTED 1 $83,640 0 $0 0 $0 APPLICATIONS DENIED 1 $92,630 0 $0 1 $23,860 APPLICATIONS WITHDRAWN 0 $0 0 $0 0 $0 FILES CLOSED FOR INCOMPLETENESS 0 $0 0 $0 0 $0
Detailed PMIC statistics for the following Tracts:
0170.04
,
0171.01 ,
0171.02 ,
0173.05
2002 - 2018 National Fire Incident Reporting System (NFIRS) incidents See full 2006 National Fire Incident Reporting System statistics for zip code 75253, Texas
Most common first names in zip code 75253 among deceased individuals Name Count Lived (average)
James 46 68.9 years Mary 36 70.0 years John 33 66.3 years Robert 29 64.6 years William 28 71.0 years Charles 18 68.1 years Thomas 15 64.8 years Billy 13 62.8 years David 12 53.3 years Roy 12 70.1 years
Most common last names in zip code 75253 among deceased individuals Last name Count Lived (average)
Williams 15 73.7 years Baker 14 74.1 years Johnson 14 67.0 years Smith 13 77.0 years Moore 10 69.3 years Miller 9 67.7 years Morris 9 77.8 years Brown 8 69.4 years Wright 7 72.0 years Adams 7 75.9 years
Businesses in zip code 75253
Name Count Name Count
7-Eleven 1 McDonald's 1 Dairy Queen 1 SONIC Drive-In 1 KFC 1


 Nearest zip codes: 75180, 75181, 75217, 75141, 75172, 75159.
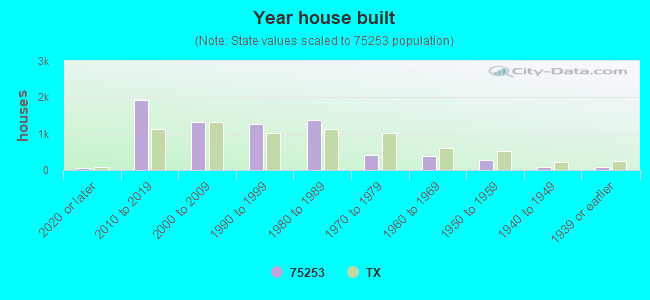


 According to the data from the years 2002 - 2018 the average number of fire incidents per year is 64. The highest number of fires - 131 took place in 2003, and the least - 9 in 2005. The data has a declining trend.
 When looking into fire subcategories, the most reports belonged to: Outside Fires (52.2%), and Structure Fires (19.9%).