Estimated zip code population in 2022: 30,798 Zip code population in 2010: 30,171 Zip code population in 2000: 35,830
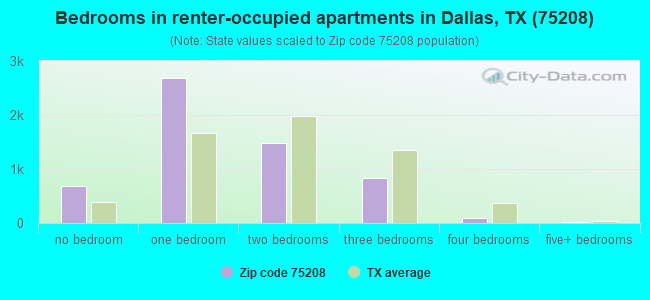
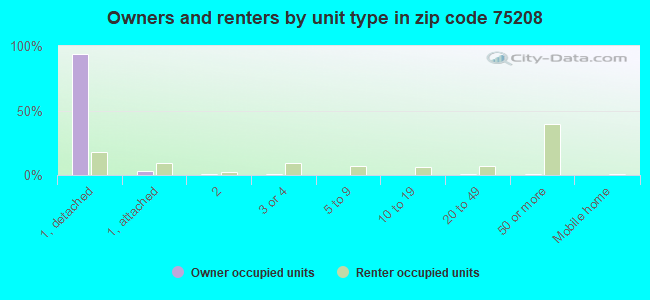
Houses and condos: 13,751 Renter-occupied apartments: 5,723
% of renters here:
45%
State:
38%
March 2022 cost of living index in zip code 75208: 97.3 (near average, U.S. average is 100)
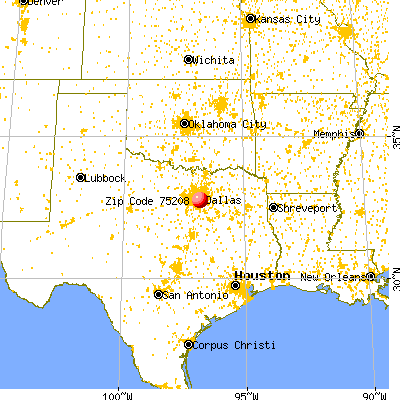
Land area: 5.9 sq. mi. Water area: 0.0 sq. mi.
Population density: 5,184 people per square mile
(average).
OSM Map
General Map
Google Map
MSN Map
OSM Map
General Map
Google Map
MSN Map
OSM Map
General Map
Google Map
MSN Map
OSM Map
General Map
Google Map
MSN Map
Please wait while loading the map...
Real estate property taxes paid for housing units in 2022:
This zip code:
1.3% ($5,554)
Texas:
1.5% ($4,050)
Median real estate property taxes paid for housing units with mortgages in 2022: $8,202 (1.6%) Median real estate property taxes paid for housing units with no mortgage in 2022: $3,604 (1.1%)
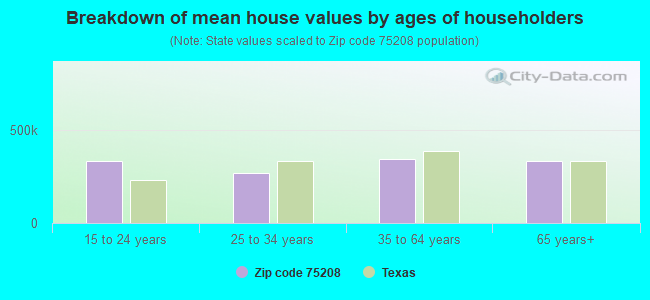
Estimated median house/condo value in 2022: $442,491
75208:
$442,491
Texas:
$275,400
According to our research of Texas and other state lists, there were 73 registered sex offenders living in 75208 zip code as of April 27, 2024. The ratio of all residents to sex offenders in zip code 75208 is 414 to 1. The ratio of registered sex offenders to all residents in this zip code is near the state average.
Median resident age:
This zip code:
35.9 years
Texas median age:
35.6 years
Average household size:
This zip code:
2.4 people
Texas:
2.6 people
Averages for the 2020 tax year for zip code 75208, filed in 2021:
Average Adjusted Gross Income (AGI) in 2020: $84,497 (Individual Income Tax Returns)
Here:
$84,497
State:
$77,054
Salary/wage: $70,736 (reported on 85.8% of returns)
Here:
$70,736
State:
$62,766
(% of AGI for various income ranges: 1302.0% for AGIs below $25k, 3952.0% for AGIs $25k-50k, 6911.6% for AGIs $50k-75k, 10332.9% for AGIs $75k-100k, 20706.0% for AGIs $100k-200k, 81750.0% for AGIs over 200k)
Taxable interest for individuals: $2,619 (reported on 20.1% of returns)
This zip code:
$2,619
Texas:
$2,665
(% of AGI for various income ranges: 7.8% for AGIs below $25k, 8.6% for AGIs $25k-50k, 24.9% for AGIs $50k-75k, 37.4% for AGIs $75k-100k, 102.5% for AGIs $100k-200k, 1345.6% for AGIs over 200k)
Ordinary dividends: $9,242 (reported on 16.3% of returns)
Here:
$9,242
State:
$10,044
(% of AGI for various income ranges: 17.5% for AGIs below $25k, 17.5% for AGIs $25k-50k, 41.8% for AGIs $50k-75k, 107.9% for AGIs $75k-100k, 289.8% for AGIs $100k-200k, 4100.2% for AGIs over 200k)
Net capital gain/loss in AGI: +$36,590 (reported on 15.9% of returns)
Here:
+$36,590
State:
+$39,590
(% of AGI for various income ranges: 6.7% for AGIs below $25k, 10.6% for AGIs $25k-50k, 58.5% for AGIs $50k-75k, 218.6% for AGIs $75k-100k, 637.7% for AGIs $100k-200k, 18522.8% for AGIs over 200k)
Profit/loss from business: +$13,266 (reported on 23.0% of returns)
Here:
+$13,266
State:
+$10,888
(% of AGI for various income ranges: 226.9% for AGIs below $25k, 140.2% for AGIs $25k-50k, 222.2% for AGIs $50k-75k, 394.2% for AGIs $75k-100k, 1102.7% for AGIs $100k-200k, 3931.4% for AGIs over 200k)
Taxable individual retirement arrangement distribution: $24,540 (reported on 4.2% of returns)
75208:
$24,540
Texas:
$24,740
(% of AGI for various income ranges: 20.1% for AGIs below $25k, 37.8% for AGIs $25k-50k, 77.0% for AGIs $50k-75k, 246.7% for AGIs $75k-100k, 459.5% for AGIs $100k-200k, 1490.9% for AGIs over 200k)
Self-employed (Keogh) retirement plans: $29,823 (reported on 0.8% of returns)
75208:
$29,823
Texas:
$29,298
(% of AGI for various income ranges: 72.0% for AGIs $100k-200k, 745.8% for AGIs over 200k)
Total itemized deductions: $34,183 (reported on 9.7% of returns)
Here:
$34,183
State:
$40,428
(% of AGI for various income ranges: 26.4% for AGIs below $25k, 88.6% for AGIs $25k-50k, 169.3% for AGIs $50k-75k, 489.3% for AGIs $75k-100k, 1170.6% for AGIs $100k-200k, 6810.9% for AGIs over 200k)
Charity contributions: $12,419 (reported on 7.8% of returns)
Here:
$12,419
State:
$18,201
(% of AGI for various income ranges: 2.2% for AGIs below $25k, 20.8% for AGIs $25k-50k, 32.8% for AGIs $50k-75k, 78.4% for AGIs $75k-100k, 226.6% for AGIs $100k-200k, 2486.3% for AGIs over 200k)
Taxes paid: $8,431 (reported on 9.6% of returns)
75208:
$8,431
State:
$7,821
(% of AGI for various income ranges: 5.8% for AGIs below $25k, 18.5% for AGIs $25k-50k, 43.0% for AGIs $50k-75k, 145.9% for AGIs $75k-100k, 364.3% for AGIs $100k-200k, 1459.8% for AGIs over 200k)
Earned income credit: $2,399 (reported on 17.2% of returns)
Here:
$2,399
State:
$2,584
(% of AGI for various income ranges: 122.3% for AGIs below $25k, 64.3% for AGIs $25k-50k)
Percentage of individuals using paid preparers for their 2020 taxes: 90.2%
Here:
90%
State:
92%
(% for various income ranges: 86.8% for AGIs below $25k, 90.5% for AGIs $25k-50k, 93.0% for AGIs $50k-75k, 90.1% for AGIs $75k-100k, 92.9% for AGIs $100k-200k, 92.7% for AGIs over 200k)
Averages for the 2012 tax year for zip code 75208, filed in 2013:
Average Adjusted Gross Income (AGI) in 2012: $52,103 (Individual Income Tax Returns)
Here:
$52,103
State:
$65,384
Salary/wage: $46,082 (reported on 86.2% of returns)
Here:
$46,082
State:
$52,524
(% of AGI for various income ranges: 78.7% for AGIs below $25k, 90.3% for AGIs $25k-50k, 82.8% for AGIs $50k-75k, 80.7% for AGIs $75k-100k, 79.1% for AGIs $100k-200k, 60.7% for AGIs over 200k)
Taxable interest for individuals: $1,684 (reported on 17.0% of returns)
This zip code:
$1,684
Texas:
$2,372
(% of AGI for various income ranges: 0.4% for AGIs below $25k, 0.3% for AGIs $25k-50k, 0.5% for AGIs $50k-75k, 0.5% for AGIs $75k-100k, 0.5% for AGIs $100k-200k, 0.8% for AGIs over 200k)
Ordinary dividends: $5,844 (reported on 11.0% of returns)
Here:
$5,844
State:
$9,721
(% of AGI for various income ranges: 1.2% for AGIs below $25k, 0.5% for AGIs $25k-50k, 1.0% for AGIs $50k-75k, 1.1% for AGIs $75k-100k, 1.7% for AGIs $100k-200k, 1.6% for AGIs over 200k)
Net capital gain/loss in AGI: +$13,489 (reported on 9.1% of returns)
Here:
+$13,489
State:
+$35,319
(% of AGI for various income ranges: 0.2% for AGIs $25k-50k, 0.4% for AGIs $50k-75k, 0.7% for AGIs $75k-100k, 1.5% for AGIs $100k-200k, 6.4% for AGIs over 200k)
Profit/loss from business: +$15,556 (reported on 21.5% of returns)
Here:
+$15,556
State:
+$13,732
(% of AGI for various income ranges: 14.9% for AGIs below $25k, 3.2% for AGIs $25k-50k, 4.6% for AGIs $50k-75k, 4.5% for AGIs $75k-100k, 6.0% for AGIs $100k-200k, 6.6% for AGIs over 200k)
Taxable individual retirement arrangement distribution: $18,247 (reported on 4.4% of returns)
75208:
$18,247
Texas:
$19,511
(% of AGI for various income ranges: 0.8% for AGIs below $25k, 0.9% for AGIs $25k-50k, 1.9% for AGIs $50k-75k, 1.7% for AGIs $75k-100k, 2.6% for AGIs $100k-200k, 1.4% for AGIs over 200k)
Self-employment retirement plans: $23,800 (reported on 0.8% of returns)
75208:
$23,800
Texas:
$23,938
(% of AGI for various income ranges: 0.1% for AGIs $25k-50k, 0.4% for AGIs $100k-200k, 0.9% for AGIs over 200k)
Total itemized deductions: $22,483 (15% of AGI, reported on 19.4% of returns)
Here:
$22,483
State:
$24,724
Here:
15.5% of AGI
State:
15.9% of AGI
(% of AGI for various income ranges: 3.3% for AGIs below $25k, 5.3% for AGIs $25k-50k, 9.6% for AGIs $50k-75k, 11.9% for AGIs $75k-100k, 12.5% for AGIs $100k-200k, 8.6% for AGIs over 200k)
Charity contributions: $4,624 (reported on 14.8% of returns)
Here:
$4,624
State:
$6,808
(% of AGI for various income ranges: 0.3% for AGIs below $25k, 0.6% for AGIs $25k-50k, 1.3% for AGIs $50k-75k, 1.5% for AGIs $75k-100k, 2.1% for AGIs $100k-200k, 1.8% for AGIs over 200k)
Taxes paid: $7,158 (reported on 19.1% of returns)
75208:
$7,158
State:
$6,921
(% of AGI for various income ranges: 0.6% for AGIs below $25k, 1.1% for AGIs $25k-50k, 2.5% for AGIs $50k-75k, 3.8% for AGIs $75k-100k, 4.4% for AGIs $100k-200k, 3.1% for AGIs over 200k)
Earned income credit: $2,658 (reported on 26.8% of returns)
Here:
$2,658
State:
$2,570
(% of AGI for various income ranges: 8.9% for AGIs below $25k, 1.5% for AGIs $25k-50k)
Percentage of individuals using paid preparers for their 2012 taxes: 60.5%
Here:
60%
State:
51%
(% for various income ranges: 63.4% for AGIs below $25k, 62.0% for AGIs $25k-50k, 51.9% for AGIs $50k-75k, 47.6% for AGIs $75k-100k, 50.0% for AGIs $100k-200k, 71.4% for AGIs over 200k)
Averages for the 2004 tax year for zip code 75208, filed in 2005:
Average Adjusted Gross Income (AGI) in 2004: $39,199 (Individual Income Tax Returns)
Here:
$39,199
State:
$47,881
Salary/wage: $36,000 (reported on 87.4% of returns)
Here:
$36,000
State:
$41,947
(% of AGI for various income ranges: 126.6% for AGIs below $10k, 87.0% for AGIs $10k-25k, 90.9% for AGIs $25k-50k, 84.6% for AGIs $50k-75k, 82.1% for AGIs $75k-100k, 65.9% for AGIs over 100k)
Taxable interest for individuals: $1,785 (reported on 23.2% of returns)
This zip code:
$1,785
Texas:
$2,255
(% of AGI for various income ranges: 3.2% for AGIs below $10k, 0.8% for AGIs $10k-25k, 0.6% for AGIs $25k-50k, 1.2% for AGIs $50k-75k, 1.1% for AGIs $75k-100k, 1.3% for AGIs over 100k)
Taxable dividends: $2,672 (reported on 11.8% of returns)
Here:
$2,672
State:
$4,261
(% of AGI for various income ranges: 4.2% for AGIs below $10k, 0.5% for AGIs $10k-25k, 0.3% for AGIs $25k-50k, 0.8% for AGIs $50k-75k, 1.1% for AGIs $75k-100k, 1.1% for AGIs over 100k)
Net capital gain/loss: +$9,973 (reported on 10.1% of returns)
Here:
+$9,973
State:
+$16,110
(% of AGI for various income ranges: -1.4% for AGIs below $10k, 0.0% for AGIs $10k-25k, 0.1% for AGIs $25k-50k, 0.5% for AGIs $50k-75k, 1.6% for AGIs $75k-100k, 6.6% for AGIs over 100k)
Profit/loss from business: +$11,653 (reported on 16.7% of returns)
Here:
+$11,653
State:
+$11,013
(% of AGI for various income ranges: 16.5% for AGIs below $10k, 7.6% for AGIs $10k-25k, 3.3% for AGIs $25k-50k, 3.2% for AGIs $50k-75k, 5.6% for AGIs $75k-100k, 5.0% for AGIs over 100k)
IRA payment deduction: $2,734 (reported on 1.3% of returns)
75208:
$2,734
Texas:
$3,120
(% of AGI for various income ranges: 0.1% for AGIs $10k-25k, 0.1% for AGIs $25k-50k, 0.2% for AGIs $50k-75k, 0.1% for AGIs over 100k)
Self-employed pension: $15,791 (reported on 0.8% of returns)
Here:
$15,791
Texas:
$16,401
Total itemized deductions: $20,087 (20% of AGI, reported on 18.7% of returns)
Here:
$20,087
State:
$19,631
Here:
19.7% of AGI
State:
18.9% of AGI
(% of AGI for various income ranges: 10.5% for AGIs below $10k, 4.0% for AGIs $10k-25k, 6.5% for AGIs $25k-50k, 10.6% for AGIs $50k-75k, 14.0% for AGIs $75k-100k, 12.7% for AGIs over 100k)
Charity contributions deductions: $3,873 (4% of AGI, reported on 15.2% of returns)
Here:
$3,873
State:
$4,753
Here:
3.7% of AGI
State:
4.2% of AGI
(% of AGI for various income ranges: 0.5% for AGIs below $10k, 0.4% for AGIs $10k-25k, 0.9% for AGIs $25k-50k, 1.4% for AGIs $50k-75k, 1.9% for AGIs $75k-100k, 2.4% for AGIs over 100k)
Total tax: $7,539 (reported on 61.3% of returns)
75208:
$7,539
State:
$9,058
(% of AGI for various income ranges: 5.3% for AGIs below $10k, 3.1% for AGIs $10k-25k, 5.5% for AGIs $25k-50k, 10.5% for AGIs $50k-75k, 13.2% for AGIs $75k-100k, 20.4% for AGIs over 100k)
Earned income credit: $2,068 (reported on 28.0% of returns)
Here:
$2,068
State:
$2,024
Percentage of individuals using paid preparers for their 2004 taxes: 63.5%
Here:
64%
State:
57%
(% for various income ranges: 59.2% for AGIs below $10k, 69.5% for AGIs $10k-25k, 64.2% for AGIs $25k-50k, 53.3% for AGIs $50k-75k, 51.1% for AGIs $75k-100k, 61.6% for AGIs over 100k)
Likely homosexual households (counted as self-reported same-sex unmarried-partner households)
Lesbian couples: 0.3% of all households
Gay men: 1.2% of all households
Household received Food Stamps/SNAP in the past 12 months: 1,178 Household did not receive Food Stamps/SNAP in the past 12 months: 11,654
Women who had a birth in the past 12 months: 279 (226 now married, 54 unmarried) Women who did not have a birth in the past 12 months: 7,118 (2,573 now married, 4,562 unmarried)
Housing units in zip code 75208 with a mortgage: 3,603 (233 second mortgage, 58 both second mortgage and home equity loan) Houses without a mortgage: 54
Median monthly owner costs for units with a mortgage: $2,413 Median monthly owner costs for units without a mortgage: $772
Residents with income below the poverty level in 2022:
This zip code:
11.9%
Whole state:
14.0%
Residents with income below 50% of the poverty level in 2022:
This zip code:
7.4%
Whole state:
7.4%
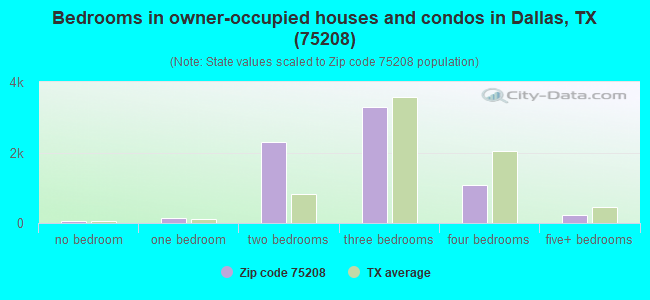
Median number of rooms in houses and condos:
Here:
6.0
State:
6.3
Median number of rooms in apartments:
Here:
3.1
State:
4.0
Notable locations in this zip code not listed on our city pages
Notable locations in zip code 75208: Stevens Park Golf Course (A), Winnetka Heights Historic District (B), Rosemont Crest Historic District (C), Miller and Stemmons Historic District (D), Kings Highway Historic District (E), North Bishop Avenue Commercial Historic District (F), Kessler Park Historic District (G), Catholic Conference Center (H), Dallas Fire - Rescue Station 14 (I), Dallas Fire - Rescue Station 45 (J), Care First Emergency Medical Services (K), Saint Joseph Home for Girls (L). Display/hide their locations on the map
Churches in zip code 75208 include: Second Church (A), New Testament Holiness Church (B), Rolling Hills Baptist Church (C), Saint Cecilias Church (D), Church of Christ Edgefield (E), Western Heights Church of Christ (F), Christ Episcopal Church (G), La Iglesia Luterana Cristo Rey Church (H), Faith Temple Assembly of God Church (I). Display/hide their locations on the map
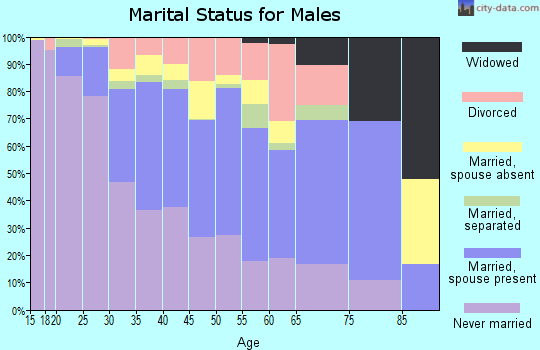
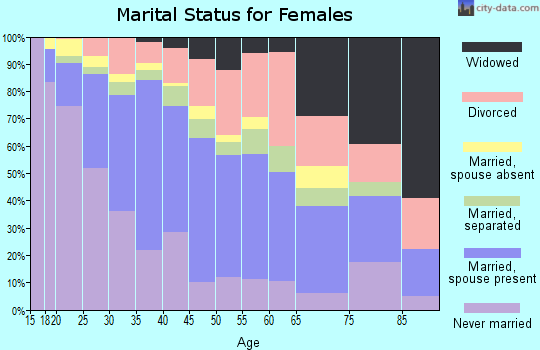
3,449 married couples with children.
1,316 single-parent households (356 men, 960 women).
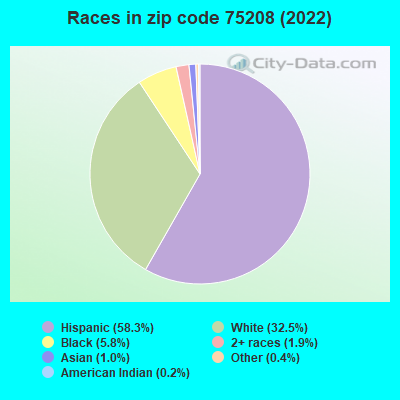
55.4% of residents of 75208 zip code speak English at home.
43.0% of residents speak Spanish at home (62% very well, 12% well, 18% not well, 8% not at all).
0.8% of residents speak other Indo-European language at home (97% very well, 3% well).
0.2% of residents speak Asian or Pacific Island language at home (98% very well, 2% well).
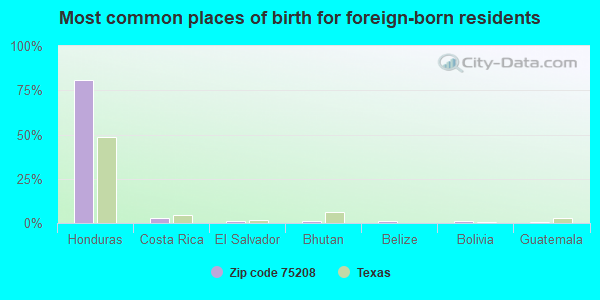
Foreign born population: 6,297 (20.4%) (40.8% of them are naturalized citizens)
Facilities with environmental interests located in this zip code:
ACE BRASS AND ALUMINUM CO (1203 S INDUSTRIAL BLVD in DALLAS, TX)
(Integrated Compliance Information System) - ICIS-06-2001-5161, FORMAL ENFORCEMENT ACTION National Pollutant Discharge Elimination System NON-MAJOR (Tracking pollutant discharge elimination systems) - permit Business SIC classification: ALUMINUM FOUNDRIES Alternative names: ACE ALUMINUM BRASS CASTING
AUSTIN CAN ACADEMY CHARTER SCHOOL (325 W 12TH ST, STE 250 in DALLAS, TX)
(National Center for Education Statistics) - STATE ID-227818001
B & L LABELS INC (907 POLLARD ST in DALLAS, TX)
(Resource Conservation and Recovery Act (tracking hazardous waste)) Business NAICS classification: COATED AND LAMINATED PAPER MANUFACTURING. Alternative names: CUSTOM PRINTED LABELS
Housing units lacking complete plumbing facilities: 1.6% Housing units lacking complete kitchen facilities: 1.8%
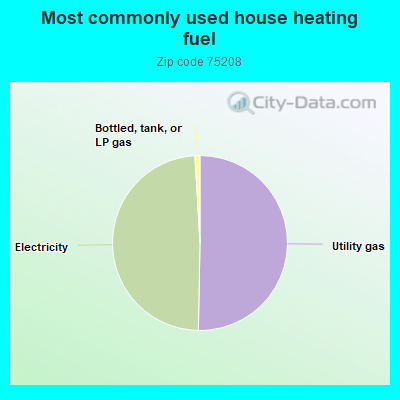
50.0%Utility gas
48.5%Electricity
0.9%Bottled, tank, or LP gas
Population in 1990: 33,527. Population change in the 1990s: +2,303 (+6.9%).
Place of birth for U.S.-born residents:
This state: 17,546
Northeast: 920
Midwest: 1,752
South: 1,711
West: 1,749
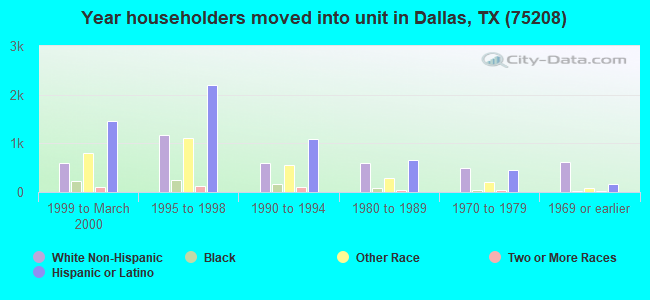
57% of the 75208 zip code residents lived in the same house 5 years ago. Out of people who lived in different houses, 81% lived in this county. Out of people who lived in different counties, 50% lived in Texas.
83% of the 75208 zip code residents lived in the same house 1 year ago. Out of people who lived in different houses, 65% moved from this county. Out of people who lived in different houses, 15% moved from different county within same state. Out of people who lived in different houses, 11% moved from different state. Out of people who lived in different houses, 6% moved from abroad.
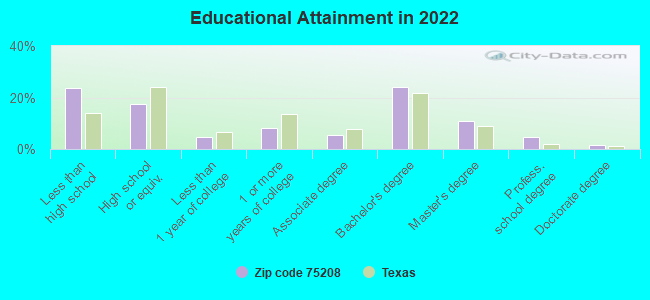
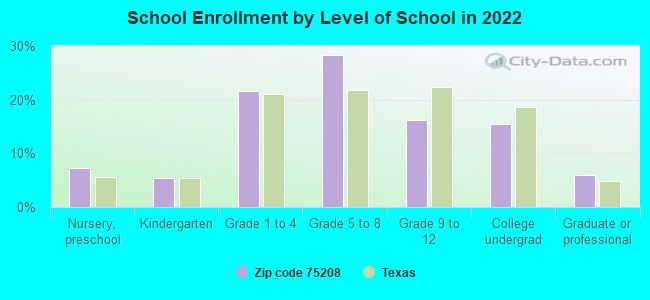
Private vs. public school enrollment:
Students in private schools in grades 1 to 8 (elementary and middle school): 406
Here:
13.1%
Texas:
8.8%
Students in private schools in grades 9 to 12 (high school): 190
Here:
18.9%
Texas:
8.0%
Students in private undergraduate colleges: 89
Here:
9.3%
Texas:
16.2%
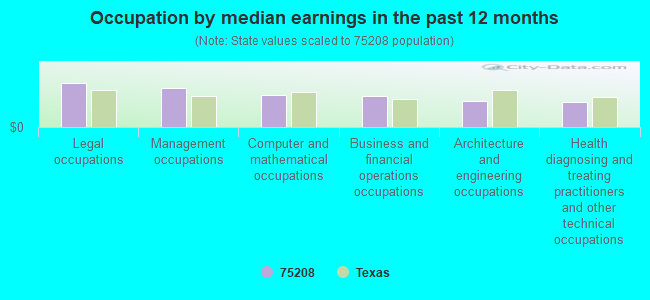
Occupation by median earnings in the past 12 months ($)
130,044Legal occupations
114,880Management occupations
95,720Computer and mathematical occupations
90,685Business and financial operations occupations
77,950Architecture and engineering occupations
74,254Health diagnosing and treating practitioners and other technical occupations
Companies with federal contracts located in this zip code (DALLAS, TX):
USA ENVIRONMENTAL GROUP INC (315 YORKTOWN ST; small business) : $37,284,784 in 301 contractsfrom 1999 to 2006
Contracts for Maintenance, Repair or Alteration of Real Property -- Other Airfield Structures, Maintenance, Repair or Alteration of Real Property -- Miscellaneous Buildings, Demolition of Buildings, Maintenance, Repair or Alteration of Real Property -- Other Industrial Buildings, and moreby Air Force, Navy, Army, U.S. Army Corps of Engineers - civil program financing only, and others Signed by year:2000: $7,422,423; 2001: $8,061,168; 2002: $7,906,648; 2003: $6,878,263; 2004: $2,206,993; 2005: $2,041,812; 2006: $2,066,078.
Biggest contracts:
$2,957,859 with Air Force for Maintenance, Repair or Alteration of Real Property -- Other Airfield Structures. Taking place in AK. Signed on 2001-03-08. Completion date: 2003-03-12.
$1,695,425 with Air Force for Maintenance, Repair or Alteration of Real Property -- Miscellaneous Buildings. Taking place in AK. Signed on 2002-08-01. Completion date: 2004-02-11.
$1,690,077 with Air Force for Maintenance, Repair or Alteration of Real Property -- Miscellaneous Buildings. Taking place in AR. Signed on 2000-09-26. Completion date: 2000-09-26.
$1,397,253 with Navy for Demolition of Buildings. Taking place in TN. Signed on 2001-02-23. Completion date: 2001-11-05.
SOGARD ENVIRONMENTAL, INC (315 YORKTOWN ST SUITE; small business) : $2,527,249 in 44 contractsfrom 2001 to 2005
Contracts for Demolition of Buildings, Maintenance, Repair or Alteration of Real Property -- Miscellaneous Buildings, Demolition of Structures or Facilities (Other than Buildings) by Navy Signed by year:2000: $0; 2001: $5,000; 2002: $935,898; 2003: $748,444; 2004: $54,108; 2005: $783,799; 2006: $0.
Biggest contracts:
$697,609 with Navy for Demolition of Buildings. Taking place in CA. Signed on 2002-05-08. Completion date: 2002-12-05.
$344,823, same as above.Signed on 2003-02-11. Completion date: 2003-04-11.
$280,580 with Navy for Maintenance, Repair or Alteration of Real Property -- Miscellaneous Buildings. Taking place in CA. Signed on 2005-03-22. Completion date: 2005-07-20.
$164,515, same as above.Signed on 2005-09-14. Completion date: 2005-10-24.
ARMSTRONG INTERNATIONAL SERVIC (400 S ZANG BLVD; small business) : $29,540 in 2 contractsin 2005
$21,098 with Army for Lease or Rental of Facilities -- Conference Space and Facilities. Taking place in FL. Signed on 2005-05-23. Completion date: 2005-05-27.
$8,442 with Army for Lease or Rental of Facilities -- Conference Space and Facilities. Taking place in NM. Signed on 2005-05-19. Completion date: 2005-05-18.
GEOTRONIC LABS INC (1314 CEDAR HILL AVE; small business) : $16,906 in 4 contractsfrom 2005 to 2006
$5,174 with Defense Logistics Agency for Coils and Transformers. Signed on 2005-10-06. Completion date: 2005-12-05.
$4,480, same as above.Signed on 2005-01-07. Completion date: 2005-05-10.
$4,480, same as above.Signed on 2005-01-07. Completion date: 2005-05-10.
$2,772, same as above.Signed on 2006-01-04. Completion date: 2006-03-24.
NOW MACHINING & MFG , INC (2003 BRUNDRETTE ST; small business) : $13,364 in 2 contractsfrom 2005 to 2006
$6,734 with Defense Logistics Agency for Hardware, Commercial. Signed on 2005-05-04. Completion date: 2005-07-24.
$6,630, same as above.Signed on 2006-01-15. Completion date: 2006-03-29.
LEMMELNEILL ASSOCIATES INC (222 W BROOKLYN AVE; small business)
$3,370 with Air Force for Miscellaneous Machine Tools. Signed on 2005-02-23. Completion date: 2005-03-04.
Top industries in this zip code by the number of employees in 2005:
2002 - 2018 National Fire Incident Reporting System (NFIRS) incidents
Based on the data from the years 2002 - 2018 the average number of fire incidents per year is 77. The highest number of reported fire incidents - 223 took place in 2003, and the least - 1 in 2008. The data has a decreasing trend.
When looking into fire subcategories, the most incidents belonged to: Outside Fires (42.4%), and Mobile Property/Vehicle Fires (22.5%).
Fire incident types reported to NFIRS in Zip Code 75208


 Nearest zip codes: 75203, 75207, 75224, 75202, 75270, 75212.
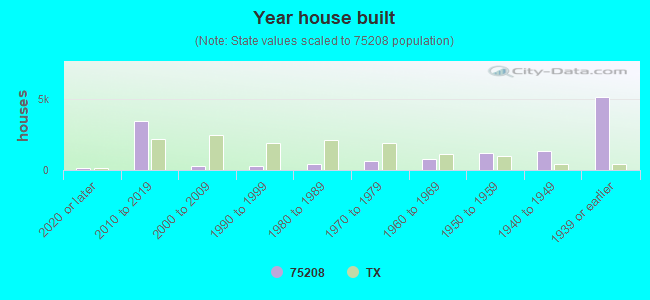


 Based on the data from the years 2002 - 2018 the average number of fire incidents per year is 77. The highest number of reported fire incidents - 223 took place in 2003, and the least - 1 in 2008. The data has a decreasing trend.
 When looking into fire subcategories, the most incidents belonged to: Outside Fires (42.4%), and Mobile Property/Vehicle Fires (22.5%).