Estimated zip code population in 2022: 25,463
Zip code population in 2010: 22,124
Zip code population in 2000: 22,665
Houses and condos: 20,067
Renter-occupied apartments: 11,922
% of renters here:
69%State:
38%
March 2022 cost of living index in zip code 75219: 97.3
(near average, U.S. average is 100)
Land area: 2.2
sq. mi.
Water area: 0.0
sq. mi.
Population density: 11,616 people per square mile (high).
OSM Map
General Map
Google Map
MSN Map
OSM Map
General Map
Google Map
MSN Map
OSM Map
General Map
Google Map
MSN Map
OSM Map
General Map
Google Map
MSN Map
Please wait while loading the map...
Real estate property taxes paid for housing units in 2022:
This zip code:
1.7% ($7,359)Texas:
1.5% ($4,050)
Median real estate property taxes paid for housing units with mortgages in 2022: $6,904 (1.6%)
Median real estate property taxes paid for housing units with no mortgage in 2022: $8,542 (1.6%)
Profiles of local businesses
Business Search - 14 Million verified businesses
Males: 14,102 Females: 11,362
For population 25 years and over in 75219:
High school or higher: 98.1%Bachelor's degree or higher: 74.9%Graduate or professional degree: 31.4%Unemployed: 2.9%Mean travel time to work (commute): 21.8 minutes
For population 15 years and over in 75219:
Never married: 57.9%Now married: 30.1%Separated: 0.8%Widowed: 2.1%Divorced: 9.1%
Zip code 75219 compared to state average:
Median house value above state average. Hispanic race population percentage below state average. Renting percentage above state average. Number of rooms per house significantly below state average. Percentage of population with a bachelor's degree or higher significantly above state average. 14,244 56.0% White 4,846 19.0% Hispanic or Latino 2,972 11.7% Black 2,516 9.9% Asian 735 2.9% Two or more races 64 0.3% Some other race 47 0.2% Native Hawaiian and Other 34 0.1% American Indian
Data:
Median household income ($)
Median household income (% change since 2000)
Household income diversity
Ratio of average income to average house value (%)
Ratio of average income to average rent
Median household income ($) - White
Median household income ($) - Black or African American
Median household income ($) - Asian
Median household income ($) - Hispanic or Latino
Median household income ($) - American Indian and Alaska Native
Median household income ($) - Multirace
Median household income ($) - Other Race
Median household income for houses/condos with a mortgage ($)
Median household income for apartments without a mortgage ($)
Races - White alone (%)
Races - White alone (% change since 2000)
Races - Black alone (%)
Races - Black alone (% change since 2000)
Races - American Indian alone (%)
Races - American Indian alone (% change since 2000)
Races - Asian alone (%)
Races - Asian alone (% change since 2000)
Races - Hispanic (%)
Races - Hispanic (% change since 2000)
Races - Native Hawaiian and Other Pacific Islander alone (%)
Races - Native Hawaiian and Other Pacific Islander alone (% change since 2000)
Races - Two or more races (%)
Races - Two or more races (% change since 2000)
Races - Other race alone (%)
Races - Other race alone (% change since 2000)
Racial diversity
Unemployment (%)
Unemployment (% change since 2000)
Unemployment (%) - White
Unemployment (%) - Black or African American
Unemployment (%) - Asian
Unemployment (%) - Hispanic or Latino
Unemployment (%) - American Indian and Alaska Native
Unemployment (%) - Multirace
Unemployment (%) - Other Race
Population density (people per square mile)
Population - Males (%)
Population - Females (%)
Population - Males (%) - White
Population - Males (%) - Black or African American
Population - Males (%) - Asian
Population - Males (%) - Hispanic or Latino
Population - Males (%) - American Indian and Alaska Native
Population - Males (%) - Multirace
Population - Males (%) - Other Race
Population - Females (%) - White
Population - Females (%) - Black or African American
Population - Females (%) - Asian
Population - Females (%) - Hispanic or Latino
Population - Females (%) - American Indian and Alaska Native
Population - Females (%) - Multirace
Population - Females (%) - Other Race
Coronavirus confirmed cases (Apr 26, 2024)
Deaths caused by coronavirus (Apr 26, 2024)
Coronavirus confirmed cases (per 100k population) (Apr 26, 2024)
Deaths caused by coronavirus (per 100k population) (Apr 26, 2024)
Daily increase in number of cases (Apr 26, 2024)
Weekly increase in number of cases (Apr 26, 2024)
Cases doubled (in days) (Apr 26, 2024)
Hospitalized patients (Apr 18, 2022)
Negative test results (Apr 18, 2022)
Total test results (Apr 18, 2022)
COVID Vaccine doses distributed (per 100k population) (Sep 19, 2023)
COVID Vaccine doses administered (per 100k population) (Sep 19, 2023)
COVID Vaccine doses distributed (Sep 19, 2023)
COVID Vaccine doses administered (Sep 19, 2023)
Likely homosexual households (%)
Likely homosexual households (% change since 2000)
Likely homosexual households - Lesbian couples (%)
Likely homosexual households - Lesbian couples (% change since 2000)
Likely homosexual households - Gay men (%)
Likely homosexual households - Gay men (% change since 2000)
Cost of living index
Median gross rent ($)
Median contract rent ($)
Median monthly housing costs ($)
Median house or condo value ($)
Median house or condo value ($ change since 2000)
Mean house or condo value by units in structure - 1, detached ($)
Mean house or condo value by units in structure - 1, attached ($)
Mean house or condo value by units in structure - 2 ($)
Mean house or condo value by units in structure by units in structure - 3 or 4 ($)
Mean house or condo value by units in structure - 5 or more ($)
Mean house or condo value by units in structure - Boat, RV, van, etc. ($)
Mean house or condo value by units in structure - Mobile home ($)
Median house or condo value ($) - White
Median house or condo value ($) - Black or African American
Median house or condo value ($) - Asian
Median house or condo value ($) - Hispanic or Latino
Median house or condo value ($) - American Indian and Alaska Native
Median house or condo value ($) - Multirace
Median house or condo value ($) - Other Race
Median resident age
Resident age diversity
Median resident age - Males
Median resident age - Females
Median resident age - White
Median resident age - Black or African American
Median resident age - Asian
Median resident age - Hispanic or Latino
Median resident age - American Indian and Alaska Native
Median resident age - Multirace
Median resident age - Other Race
Median resident age - Males - White
Median resident age - Males - Black or African American
Median resident age - Males - Asian
Median resident age - Males - Hispanic or Latino
Median resident age - Males - American Indian and Alaska Native
Median resident age - Males - Multirace
Median resident age - Males - Other Race
Median resident age - Females - White
Median resident age - Females - Black or African American
Median resident age - Females - Asian
Median resident age - Females - Hispanic or Latino
Median resident age - Females - American Indian and Alaska Native
Median resident age - Females - Multirace
Median resident age - Females - Other Race
Commute - mean travel time to work (minutes)
Travel time to work - Less than 5 minutes (%)
Travel time to work - Less than 5 minutes (% change since 2000)
Travel time to work - 5 to 9 minutes (%)
Travel time to work - 5 to 9 minutes (% change since 2000)
Travel time to work - 10 to 19 minutes (%)
Travel time to work - 10 to 19 minutes (% change since 2000)
Travel time to work - 20 to 29 minutes (%)
Travel time to work - 20 to 29 minutes (% change since 2000)
Travel time to work - 30 to 39 minutes (%)
Travel time to work - 30 to 39 minutes (% change since 2000)
Travel time to work - 40 to 59 minutes (%)
Travel time to work - 40 to 59 minutes (% change since 2000)
Travel time to work - 60 to 89 minutes (%)
Travel time to work - 60 to 89 minutes (% change since 2000)
Travel time to work - 90 or more minutes (%)
Travel time to work - 90 or more minutes (% change since 2000)
Marital status - Never married (%)
Marital status - Now married (%)
Marital status - Separated (%)
Marital status - Widowed (%)
Marital status - Divorced (%)
Median family income ($)
Median family income (% change since 2000)
Median non-family income ($)
Median non-family income (% change since 2000)
Median per capita income ($)
Median per capita income (% change since 2000)
Median family income ($) - White
Median family income ($) - Black or African American
Median family income ($) - Asian
Median family income ($) - Hispanic or Latino
Median family income ($) - American Indian and Alaska Native
Median family income ($) - Multirace
Median family income ($) - Other Race
Median year house/condo built
Median year apartment built
Year house built - Built 2005 or later (%)
Year house built - Built 2000 to 2004 (%)
Year house built - Built 1990 to 1999 (%)
Year house built - Built 1980 to 1989 (%)
Year house built - Built 1970 to 1979 (%)
Year house built - Built 1960 to 1969 (%)
Year house built - Built 1950 to 1959 (%)
Year house built - Built 1940 to 1949 (%)
Year house built - Built 1939 or earlier (%)
Average household size
Household density (households per square mile)
Average household size - White
Average household size - Black or African American
Average household size - Asian
Average household size - Hispanic or Latino
Average household size - American Indian and Alaska Native
Average household size - Multirace
Average household size - Other Race
Occupied housing units (%)
Vacant housing units (%)
Owner occupied housing units (%)
Renter occupied housing units (%)
Vacancy status - For rent (%)
Vacancy status - For sale only (%)
Vacancy status - Rented or sold, not occupied (%)
Vacancy status - For seasonal, recreational, or occasional use (%)
Vacancy status - For migrant workers (%)
Vacancy status - Other vacant (%)
Residents with income below the poverty level (%)
Residents with income below 50% of the poverty level (%)
Children below poverty level (%)
Poor families by family type - Married-couple family (%)
Poor families by family type - Male, no wife present (%)
Poor families by family type - Female, no husband present (%)
Poverty status for native-born residents (%)
Poverty status for foreign-born residents (%)
Poverty among high school graduates not in families (%)
Poverty among people who did not graduate high school not in families (%)
Residents with income below the poverty level (%) - White
Residents with income below the poverty level (%) - Black or African American
Residents with income below the poverty level (%) - Asian
Residents with income below the poverty level (%) - Hispanic or Latino
Residents with income below the poverty level (%) - American Indian and Alaska Native
Residents with income below the poverty level (%) - Multirace
Residents with income below the poverty level (%) - Other Race
Air pollution - Air Quality Index (AQI)
Air pollution - CO
Air pollution - NO2
Air pollution - SO2
Air pollution - Ozone
Air pollution - PM10
Air pollution - PM25
Air pollution - Pb
Crime - Murders per 100,000 population
Crime - Rapes per 100,000 population
Crime - Robberies per 100,000 population
Crime - Assaults per 100,000 population
Crime - Burglaries per 100,000 population
Crime - Thefts per 100,000 population
Crime - Auto thefts per 100,000 population
Crime - Arson per 100,000 population
Crime - City-data.com crime index
Crime - Violent crime index
Crime - Property crime index
Crime - Murders per 100,000 population (5 year average)
Crime - Rapes per 100,000 population (5 year average)
Crime - Robberies per 100,000 population (5 year average)
Crime - Assaults per 100,000 population (5 year average)
Crime - Burglaries per 100,000 population (5 year average)
Crime - Thefts per 100,000 population (5 year average)
Crime - Auto thefts per 100,000 population (5 year average)
Crime - Arson per 100,000 population (5 year average)
Crime - City-data.com crime index (5 year average)
Crime - Violent crime index (5 year average)
Crime - Property crime index (5 year average)
1996 Presidential Elections Results (%) - Democratic Party (Clinton)
1996 Presidential Elections Results (%) - Republican Party (Dole)
1996 Presidential Elections Results (%) - Other
2000 Presidential Elections Results (%) - Democratic Party (Gore)
2000 Presidential Elections Results (%) - Republican Party (Bush)
2000 Presidential Elections Results (%) - Other
2004 Presidential Elections Results (%) - Democratic Party (Kerry)
2004 Presidential Elections Results (%) - Republican Party (Bush)
2004 Presidential Elections Results (%) - Other
2008 Presidential Elections Results (%) - Democratic Party (Obama)
2008 Presidential Elections Results (%) - Republican Party (McCain)
2008 Presidential Elections Results (%) - Other
2012 Presidential Elections Results (%) - Democratic Party (Obama)
2012 Presidential Elections Results (%) - Republican Party (Romney)
2012 Presidential Elections Results (%) - Other
2016 Presidential Elections Results (%) - Democratic Party (Clinton)
2016 Presidential Elections Results (%) - Republican Party (Trump)
2016 Presidential Elections Results (%) - Other
2020 Presidential Elections Results (%) - Democratic Party (Biden)
2020 Presidential Elections Results (%) - Republican Party (Trump)
2020 Presidential Elections Results (%) - Other
Ancestries Reported - Arab (%)
Ancestries Reported - Czech (%)
Ancestries Reported - Danish (%)
Ancestries Reported - Dutch (%)
Ancestries Reported - English (%)
Ancestries Reported - French (%)
Ancestries Reported - French Canadian (%)
Ancestries Reported - German (%)
Ancestries Reported - Greek (%)
Ancestries Reported - Hungarian (%)
Ancestries Reported - Irish (%)
Ancestries Reported - Italian (%)
Ancestries Reported - Lithuanian (%)
Ancestries Reported - Norwegian (%)
Ancestries Reported - Polish (%)
Ancestries Reported - Portuguese (%)
Ancestries Reported - Russian (%)
Ancestries Reported - Scotch-Irish (%)
Ancestries Reported - Scottish (%)
Ancestries Reported - Slovak (%)
Ancestries Reported - Subsaharan African (%)
Ancestries Reported - Swedish (%)
Ancestries Reported - Swiss (%)
Ancestries Reported - Ukrainian (%)
Ancestries Reported - United States (%)
Ancestries Reported - Welsh (%)
Ancestries Reported - West Indian (%)
Ancestries Reported - Other (%)
Educational Attainment - No schooling completed (%)
Educational Attainment - Less than high school (%)
Educational Attainment - High school or equivalent (%)
Educational Attainment - Less than 1 year of college (%)
Educational Attainment - 1 or more years of college (%)
Educational Attainment - Associate degree (%)
Educational Attainment - Bachelor's degree (%)
Educational Attainment - Master's degree (%)
Educational Attainment - Professional school degree (%)
Educational Attainment - Doctorate degree (%)
School Enrollment - Nursery, preschool (%)
School Enrollment - Kindergarten (%)
School Enrollment - Grade 1 to 4 (%)
School Enrollment - Grade 5 to 8 (%)
School Enrollment - Grade 9 to 12 (%)
School Enrollment - College undergrad (%)
School Enrollment - Graduate or professional (%)
School Enrollment - Not enrolled in school (%)
School enrollment - Public schools (%)
School enrollment - Private schools (%)
School enrollment - Not enrolled (%)
Median number of rooms in houses and condos
Median number of rooms in apartments
Housing units lacking complete plumbing facilities (%)
Housing units lacking complete kitchen facilities (%)
Density of houses
Urban houses (%)
Rural houses (%)
Households with people 60 years and over (%)
Households with people 65 years and over (%)
Households with people 75 years and over (%)
Households with one or more nonrelatives (%)
Households with no nonrelatives (%)
Population in households (%)
Family households (%)
Nonfamily households (%)
Population in families (%)
Family households with own children (%)
Median number of bedrooms in owner occupied houses
Mean number of bedrooms in owner occupied houses
Median number of bedrooms in renter occupied houses
Mean number of bedrooms in renter occupied houses
Median number of vehichles in owner occupied houses
Mean number of vehichles in owner occupied houses
Median number of vehichles in renter occupied houses
Mean number of vehichles in renter occupied houses
Mortgage status - with mortgage (%)
Mortgage status - with second mortgage (%)
Mortgage status - with home equity loan (%)
Mortgage status - with both second mortgage and home equity loan (%)
Mortgage status - without a mortgage (%)
Average family size
Average family size - White
Average family size - Black or African American
Average family size - Asian
Average family size - Hispanic or Latino
Average family size - American Indian and Alaska Native
Average family size - Multirace
Average family size - Other Race
Geographical mobility - Same house 1 year ago (%)
Geographical mobility - Moved within same county (%)
Geographical mobility - Moved from different county within same state (%)
Geographical mobility - Moved from different state (%)
Geographical mobility - Moved from abroad (%)
Place of birth - Born in state of residence (%)
Place of birth - Born in other state (%)
Place of birth - Native, outside of US (%)
Place of birth - Foreign born (%)
Housing units in structures - 1, detached (%)
Housing units in structures - 1, attached (%)
Housing units in structures - 2 (%)
Housing units in structures - 3 or 4 (%)
Housing units in structures - 5 to 9 (%)
Housing units in structures - 10 to 19 (%)
Housing units in structures - 20 to 49 (%)
Housing units in structures - 50 or more (%)
Housing units in structures - Mobile home (%)
Housing units in structures - Boat, RV, van, etc. (%)
House/condo owner moved in on average (years ago)
Renter moved in on average (years ago)
Year householder moved into unit - Moved in 1999 to March 2000 (%)
Year householder moved into unit - Moved in 1995 to 1998 (%)
Year householder moved into unit - Moved in 1990 to 1994 (%)
Year householder moved into unit - Moved in 1980 to 1989 (%)
Year householder moved into unit - Moved in 1970 to 1979 (%)
Year householder moved into unit - Moved in 1969 or earlier (%)
Means of transportation to work - Drove car alone (%)
Means of transportation to work - Carpooled (%)
Means of transportation to work - Public transportation (%)
Means of transportation to work - Bus or trolley bus (%)
Means of transportation to work - Streetcar or trolley car (%)
Means of transportation to work - Subway or elevated (%)
Means of transportation to work - Railroad (%)
Means of transportation to work - Ferryboat (%)
Means of transportation to work - Taxicab (%)
Means of transportation to work - Motorcycle (%)
Means of transportation to work - Bicycle (%)
Means of transportation to work - Walked (%)
Means of transportation to work - Other means (%)
Working at home (%)
Industry diversity
Most Common Industries - Agriculture, forestry, fishing and hunting, and mining (%)
Most Common Industries - Agriculture, forestry, fishing and hunting (%)
Most Common Industries - Mining, quarrying, and oil and gas extraction (%)
Most Common Industries - Construction (%)
Most Common Industries - Manufacturing (%)
Most Common Industries - Wholesale trade (%)
Most Common Industries - Retail trade (%)
Most Common Industries - Transportation and warehousing, and utilities (%)
Most Common Industries - Transportation and warehousing (%)
Most Common Industries - Utilities (%)
Most Common Industries - Information (%)
Most Common Industries - Finance and insurance, and real estate and rental and leasing (%)
Most Common Industries - Finance and insurance (%)
Most Common Industries - Real estate and rental and leasing (%)
Most Common Industries - Professional, scientific, and management, and administrative and waste management services (%)
Most Common Industries - Professional, scientific, and technical services (%)
Most Common Industries - Management of companies and enterprises (%)
Most Common Industries - Administrative and support and waste management services (%)
Most Common Industries - Educational services, and health care and social assistance (%)
Most Common Industries - Educational services (%)
Most Common Industries - Health care and social assistance (%)
Most Common Industries - Arts, entertainment, and recreation, and accommodation and food services (%)
Most Common Industries - Arts, entertainment, and recreation (%)
Most Common Industries - Accommodation and food services (%)
Most Common Industries - Other services, except public administration (%)
Most Common Industries - Public administration (%)
Occupation diversity
Most Common Occupations - Management, business, science, and arts occupations (%)
Most Common Occupations - Management, business, and financial occupations (%)
Most Common Occupations - Management occupations (%)
Most Common Occupations - Business and financial operations occupations (%)
Most Common Occupations - Computer, engineering, and science occupations (%)
Most Common Occupations - Computer and mathematical occupations (%)
Most Common Occupations - Architecture and engineering occupations (%)
Most Common Occupations - Life, physical, and social science occupations (%)
Most Common Occupations - Education, legal, community service, arts, and media occupations (%)
Most Common Occupations - Community and social service occupations (%)
Most Common Occupations - Legal occupations (%)
Most Common Occupations - Education, training, and library occupations (%)
Most Common Occupations - Arts, design, entertainment, sports, and media occupations (%)
Most Common Occupations - Healthcare practitioners and technical occupations (%)
Most Common Occupations - Health diagnosing and treating practitioners and other technical occupations (%)
Most Common Occupations - Health technologists and technicians (%)
Most Common Occupations - Service occupations (%)
Most Common Occupations - Healthcare support occupations (%)
Most Common Occupations - Protective service occupations (%)
Most Common Occupations - Fire fighting and prevention, and other protective service workers including supervisors (%)
Most Common Occupations - Law enforcement workers including supervisors (%)
Most Common Occupations - Food preparation and serving related occupations (%)
Most Common Occupations - Building and grounds cleaning and maintenance occupations (%)
Most Common Occupations - Personal care and service occupations (%)
Most Common Occupations - Sales and office occupations (%)
Most Common Occupations - Sales and related occupations (%)
Most Common Occupations - Office and administrative support occupations (%)
Most Common Occupations - Natural resources, construction, and maintenance occupations (%)
Most Common Occupations - Farming, fishing, and forestry occupations (%)
Most Common Occupations - Construction and extraction occupations (%)
Most Common Occupations - Installation, maintenance, and repair occupations (%)
Most Common Occupations - Production, transportation, and material moving occupations (%)
Most Common Occupations - Production occupations (%)
Most Common Occupations - Transportation occupations (%)
Most Common Occupations - Material moving occupations (%)
People in Group quarters - Institutionalized population (%)
People in Group quarters - Correctional institutions (%)
People in Group quarters - Federal prisons and detention centers (%)
People in Group quarters - Halfway houses (%)
People in Group quarters - Local jails and other confinement facilities (including police lockups) (%)
People in Group quarters - Military disciplinary barracks (%)
People in Group quarters - State prisons (%)
People in Group quarters - Other types of correctional institutions (%)
People in Group quarters - Nursing homes (%)
People in Group quarters - Hospitals/wards, hospices, and schools for the handicapped (%)
People in Group quarters - Hospitals/wards and hospices for chronically ill (%)
People in Group quarters - Hospices or homes for chronically ill (%)
People in Group quarters - Military hospitals or wards for chronically ill (%)
People in Group quarters - Other hospitals or wards for chronically ill (%)
People in Group quarters - Hospitals or wards for drug/alcohol abuse (%)
People in Group quarters - Mental (Psychiatric) hospitals or wards (%)
People in Group quarters - Schools, hospitals, or wards for the mentally retarded (%)
People in Group quarters - Schools, hospitals, or wards for the physically handicapped (%)
People in Group quarters - Institutions for the deaf (%)
People in Group quarters - Institutions for the blind (%)
People in Group quarters - Orthopedic wards and institutions for the physically handicapped (%)
People in Group quarters - Wards in general hospitals for patients who have no usual home elsewhere (%)
People in Group quarters - Wards in military hospitals for patients who have no usual home elsewhere (%)
People in Group quarters - Juvenile institutions (%)
People in Group quarters - Long-term care (%)
People in Group quarters - Homes for abused, dependent, and neglected children (%)
People in Group quarters - Residential treatment centers for emotionally disturbed children (%)
People in Group quarters - Training schools for juvenile delinquents (%)
People in Group quarters - Short-term care, detention or diagnostic centers for delinquent children (%)
People in Group quarters - Type of juvenile institution unknown (%)
People in Group quarters - Noninstitutionalized population (%)
People in Group quarters - College dormitories (includes college quarters off campus) (%)
People in Group quarters - Military quarters (%)
People in Group quarters - On base (%)
People in Group quarters - Barracks, unaccompanied personnel housing (UPH), (Enlisted/Officer), ;and similar group living quarters for military personnel (%)
People in Group quarters - Transient quarters for temporary residents (%)
People in Group quarters - Military ships (%)
People in Group quarters - Group homes (%)
People in Group quarters - Homes or halfway houses for drug/alcohol abuse (%)
People in Group quarters - Homes for the mentally ill (%)
People in Group quarters - Homes for the mentally retarded (%)
People in Group quarters - Homes for the physically handicapped (%)
People in Group quarters - Other group homes (%)
People in Group quarters - Religious group quarters (%)
People in Group quarters - Dormitories (%)
People in Group quarters - Agriculture workers' dormitories on farms (%)
People in Group quarters - Job Corps and vocational training facilities (%)
People in Group quarters - Other workers' dormitories (%)
People in Group quarters - Crews of maritime vessels (%)
People in Group quarters - Other nonhousehold living situations (%)
People in Group quarters - Other noninstitutional group quarters (%)
Residents speaking English at home (%)
Residents speaking English at home - Born in the United States (%)
Residents speaking English at home - Native, born elsewhere (%)
Residents speaking English at home - Foreign born (%)
Residents speaking Spanish at home (%)
Residents speaking Spanish at home - Born in the United States (%)
Residents speaking Spanish at home - Native, born elsewhere (%)
Residents speaking Spanish at home - Foreign born (%)
Residents speaking other language at home (%)
Residents speaking other language at home - Born in the United States (%)
Residents speaking other language at home - Native, born elsewhere (%)
Residents speaking other language at home - Foreign born (%)
Class of Workers - Employee of private company (%)
Class of Workers - Self-employed in own incorporated business (%)
Class of Workers - Private not-for-profit wage and salary workers (%)
Class of Workers - Local government workers (%)
Class of Workers - State government workers (%)
Class of Workers - Federal government workers (%)
Class of Workers - Self-employed workers in own not incorporated business and Unpaid family workers (%)
House heating fuel used in houses and condos - Utility gas (%)
House heating fuel used in houses and condos - Bottled, tank, or LP gas (%)
House heating fuel used in houses and condos - Electricity (%)
House heating fuel used in houses and condos - Fuel oil, kerosene, etc. (%)
House heating fuel used in houses and condos - Coal or coke (%)
House heating fuel used in houses and condos - Wood (%)
House heating fuel used in houses and condos - Solar energy (%)
House heating fuel used in houses and condos - Other fuel (%)
House heating fuel used in houses and condos - No fuel used (%)
House heating fuel used in apartments - Utility gas (%)
House heating fuel used in apartments - Bottled, tank, or LP gas (%)
House heating fuel used in apartments - Electricity (%)
House heating fuel used in apartments - Fuel oil, kerosene, etc. (%)
House heating fuel used in apartments - Coal or coke (%)
House heating fuel used in apartments - Wood (%)
House heating fuel used in apartments - Solar energy (%)
House heating fuel used in apartments - Other fuel (%)
House heating fuel used in apartments - No fuel used (%)
Armed forces status - In Armed Forces (%)
Armed forces status - Civilian (%)
Armed forces status - Civilian - Veteran (%)
Armed forces status - Civilian - Nonveteran (%)
Fatal accidents locations in years 2005-2021
Fatal accidents locations in 2005
Fatal accidents locations in 2006
Fatal accidents locations in 2007
Fatal accidents locations in 2008
Fatal accidents locations in 2009
Fatal accidents locations in 2010
Fatal accidents locations in 2011
Fatal accidents locations in 2012
Fatal accidents locations in 2013
Fatal accidents locations in 2014
Fatal accidents locations in 2015
Fatal accidents locations in 2016
Fatal accidents locations in 2017
Fatal accidents locations in 2018
Fatal accidents locations in 2019
Fatal accidents locations in 2020
Fatal accidents locations in 2021
Alcohol use - People drinking some alcohol every month (%)
Alcohol use - People not drinking at all (%)
Alcohol use - Average days/month drinking alcohol
Alcohol use - Average drinks/week
Alcohol use - Average days/year people drink much
Audiometry - Average condition of hearing (%)
Audiometry - People that can hear a whisper from across a quiet room (%)
Audiometry - People that can hear normal voice from across a quiet room (%)
Audiometry - Ears ringing, roaring, buzzing (%)
Audiometry - Had a job exposure to loud noise (%)
Audiometry - Had off-work exposure to loud noise (%)
Blood Pressure & Cholesterol - Has high blood pressure (%)
Blood Pressure & Cholesterol - Checking blood pressure at home (%)
Blood Pressure & Cholesterol - Frequently checking blood cholesterol (%)
Blood Pressure & Cholesterol - Has high cholesterol level (%)
Consumer Behavior - Money monthly spent on food at supermarket/grocery store
Consumer Behavior - Money monthly spent on food at other stores
Consumer Behavior - Money monthly spent on eating out
Consumer Behavior - Money monthly spent on carryout/delivered foods
Consumer Behavior - Income spent on food at supermarket/grocery store (%)
Consumer Behavior - Income spent on food at other stores (%)
Consumer Behavior - Income spent on eating out (%)
Consumer Behavior - Income spent on carryout/delivered foods (%)
Current Health Status - General health condition (%)
Current Health Status - Blood donors (%)
Current Health Status - Has blood ever tested for HIV virus (%)
Current Health Status - Left-handed people (%)
Dermatology - People using sunscreen (%)
Diabetes - Diabetics (%)
Diabetes - Had a blood test for high blood sugar (%)
Diabetes - People taking insulin (%)
Diet Behavior & Nutrition - Diet health (%)
Diet Behavior & Nutrition - Milk product consumption (# of products/month)
Diet Behavior & Nutrition - Meals not home prepared (#/week)
Diet Behavior & Nutrition - Meals from fast food or pizza place (#/week)
Diet Behavior & Nutrition - Ready-to-eat foods (#/month)
Diet Behavior & Nutrition - Frozen meals/pizza (#/month)
Drug Use - People that ever used marijuana or hashish (%)
Drug Use - Ever used hard drugs (%)
Drug Use - Ever used any form of cocaine (%)
Drug Use - Ever used heroin (%)
Drug Use - Ever used methamphetamine (%)
Health Insurance - People covered by health insurance (%)
Kidney Conditions-Urology - Avg. # of times urinating at night
Medical Conditions - People with asthma (%)
Medical Conditions - People with anemia (%)
Medical Conditions - People with psoriasis (%)
Medical Conditions - People with overweight (%)
Medical Conditions - Elderly people having difficulties in thinking or remembering (%)
Medical Conditions - People who ever received blood transfusion (%)
Medical Conditions - People having trouble seeing even with glass/contacts (%)
Medical Conditions - People with arthritis (%)
Medical Conditions - People with gout (%)
Medical Conditions - People with congestive heart failure (%)
Medical Conditions - People with coronary heart disease (%)
Medical Conditions - People with angina pectoris (%)
Medical Conditions - People who ever had heart attack (%)
Medical Conditions - People who ever had stroke (%)
Medical Conditions - People with emphysema (%)
Medical Conditions - People with thyroid problem (%)
Medical Conditions - People with chronic bronchitis (%)
Medical Conditions - People with any liver condition (%)
Medical Conditions - People who ever had cancer or malignancy (%)
Mental Health - People who have little interest in doing things (%)
Mental Health - People feeling down, depressed, or hopeless (%)
Mental Health - People who have trouble sleeping or sleeping too much (%)
Mental Health - People feeling tired or having little energy (%)
Mental Health - People with poor appetite or overeating (%)
Mental Health - People feeling bad about themself (%)
Mental Health - People who have trouble concentrating on things (%)
Mental Health - People moving or speaking slowly or too fast (%)
Mental Health - People having thoughts they would be better off dead (%)
Oral Health - Average years since last visit a dentist
Oral Health - People embarrassed because of mouth (%)
Oral Health - People with gum disease (%)
Oral Health - General health of teeth and gums (%)
Oral Health - Average days a week using dental floss/device
Oral Health - Average days a week using mouthwash for dental problem
Oral Health - Average number of teeth
Pesticide Use - Households using pesticides to control insects (%)
Pesticide Use - Households using pesticides to kill weeds (%)
Physical Activity - People doing vigorous-intensity work activities (%)
Physical Activity - People doing moderate-intensity work activities (%)
Physical Activity - People walking or bicycling (%)
Physical Activity - People doing vigorous-intensity recreational activities (%)
Physical Activity - People doing moderate-intensity recreational activities (%)
Physical Activity - Average hours a day doing sedentary activities
Physical Activity - Average hours a day watching TV or videos
Physical Activity - Average hours a day using computer
Physical Functioning - People having limitations keeping them from working (%)
Physical Functioning - People limited in amount of work they can do (%)
Physical Functioning - People that need special equipment to walk (%)
Physical Functioning - People experiencing confusion/memory problems (%)
Physical Functioning - People requiring special healthcare equipment (%)
Prescription Medications - Average number of prescription medicines taking
Preventive Aspirin Use - Adults 40+ taking low-dose aspirin (%)
Reproductive Health - Vaginal deliveries (%)
Reproductive Health - Cesarean deliveries (%)
Reproductive Health - Deliveries resulted in a live birth (%)
Reproductive Health - Pregnancies resulted in a delivery (%)
Reproductive Health - Women breastfeeding newborns (%)
Reproductive Health - Women that had a hysterectomy (%)
Reproductive Health - Women that had both ovaries removed (%)
Reproductive Health - Women that have ever taken birth control pills (%)
Reproductive Health - Women taking birth control pills (%)
Reproductive Health - Women that have ever used Depo-Provera or injectables (%)
Reproductive Health - Women that have ever used female hormones (%)
Sexual Behavior - People 18+ that ever had sex (vaginal, anal, or oral) (%)
Sexual Behavior - Males 18+ that ever had vaginal sex with a woman (%)
Sexual Behavior - Males 18+ that ever performed oral sex on a woman (%)
Sexual Behavior - Males 18+ that ever had anal sex with a woman (%)
Sexual Behavior - Males 18+ that ever had any sex with a man (%)
Sexual Behavior - Females 18+ that ever had vaginal sex with a man (%)
Sexual Behavior - Females 18+ that ever performed oral sex on a man (%)
Sexual Behavior - Females 18+ that ever had anal sex with a man (%)
Sexual Behavior - Females 18+ that ever had any kind of sex with a woman (%)
Sexual Behavior - Average age people first had sex
Sexual Behavior - Average number of female sex partners in lifetime (males 18+)
Sexual Behavior - Average number of female vaginal sex partners in lifetime (males 18+)
Sexual Behavior - Average age people first performed oral sex on a woman (18+)
Sexual Behavior - Average number of woman performed oral sex on in lifetime (18+)
Sexual Behavior - Average number of male sex partners in lifetime (males 18+)
Sexual Behavior - Average number of male anal sex partners in lifetime (males 18+)
Sexual Behavior - Average age people first performed oral sex on a man (18+)
Sexual Behavior - Average number of male oral sex partners in lifetime (18+)
Sexual Behavior - People using protection when performing oral sex (%)
Sexual Behavior - Average number of times people have vaginal or anal sex a year
Sexual Behavior - People having sex without condom (%)
Sexual Behavior - Average number of male sex partners in lifetime (females 18+)
Sexual Behavior - Average number of male vaginal sex partners in lifetime (females 18+)
Sexual Behavior - Average number of female sex partners in lifetime (females 18+)
Sexual Behavior - Circumcised males 18+ (%)
Sleep Disorders - Average hours sleeping at night
Sleep Disorders - People that has trouble sleeping (%)
Smoking-Cigarette Use - People smoking cigarettes (%)
Taste & Smell - People 40+ having problems with smell (%)
Taste & Smell - People 40+ having problems with taste (%)
Taste & Smell - People 40+ that ever had wisdom teeth removed (%)
Taste & Smell - People 40+ that ever had tonsils teeth removed (%)
Taste & Smell - People 40+ that ever had a loss of consciousness because of a head injury (%)
Taste & Smell - People 40+ that ever had a broken nose or other serious injury to face or skull (%)
Taste & Smell - People 40+ that ever had two or more sinus infections (%)
Weight - Average height (inches)
Weight - Average weight (pounds)
Weight - Average BMI
Weight - People that are obese (%)
Weight - People that ever were obese (%)
Weight - People trying to lose weight (%)
100%
urban population.
Estimated median house/condo value in 2022: $443,764
75219:
$443,764Texas:
$275,400
According to our research of Texas and other state lists, there were 39 registered sex offenders living in 75219 zip code as of April 26, 2024 . The ratio of all residents to sex offenders in zip code 75219 is 596 to 1.The ratio of registered sex offenders to all residents in this zip code is lower than the state average.
Median resident age: This zip code:
34.2 yearsTexas median age:
35.6 years
Average household size: This zip code:
1.5 peopleTexas:
2.6 people
Averages for the 2020 tax year for zip code 75219, filed in 2021:
Average Adjusted Gross Income (AGI) in 2020: $186,337 (Individual Income Tax Returns) Here:
$186,337State:
$77,054
Salary/wage: $105,753 (reported on 84.6% of returns )Here:
$105,753State:
$62,766
(% of AGI for various income ranges: 1319.7% for AGIs below $25k , 4056.1% for AGIs $25k-50k , 7165.5% for AGIs $50k-75k , 11141.2% for AGIs $75k-100k , 19605.1% for AGIs $100k-200k , 152190.6% for AGIs over 200k ) Taxable interest for individuals: $20,502 (reported on 31.7% of returns )This zip code:
$20,502Texas:
$2,665
(% of AGI for various income ranges: 17.0% for AGIs below $25k , 25.9% for AGIs $25k-50k , 35.2% for AGIs $50k-75k , 67.9% for AGIs $75k-100k , 205.2% for AGIs $100k-200k , 21715.7% for AGIs over 200k ) Ordinary dividends: $56,713 (reported on 30.1% of returns )Here:
$56,713State:
$10,044
(% of AGI for various income ranges: 53.2% for AGIs below $25k , 69.5% for AGIs $25k-50k , 93.9% for AGIs $50k-75k , 215.4% for AGIs $75k-100k , 639.5% for AGIs $100k-200k , 56510.2% for AGIs over 200k ) Net capital gain/loss in AGI: +$163,074 (reported on 30.0% of returns )Here:
+$163,074State:
+$39,590
(% of AGI for various income ranges: 36.3% for AGIs below $25k , 73.4% for AGIs $25k-50k , 76.0% for AGIs $50k-75k , 244.6% for AGIs $75k-100k , 891.8% for AGIs $100k-200k , 168702.9% for AGIs over 200k ) Profit/loss from business: +$25,909 (reported on 20.4% of returns )Here:
+$25,909State:
+$10,888
(% of AGI for various income ranges: 177.3% for AGIs below $25k , 154.3% for AGIs $25k-50k , 160.6% for AGIs $50k-75k , 379.6% for AGIs $75k-100k , 733.6% for AGIs $100k-200k , 12568.8% for AGIs over 200k ) Taxable individual retirement arrangement distribution: $49,938 (reported on 6.2% of returns )75219:
$49,938Texas:
$24,740
(% of AGI for various income ranges: 35.3% for AGIs below $25k , 61.8% for AGIs $25k-50k , 101.1% for AGIs $50k-75k , 179.6% for AGIs $75k-100k , 630.4% for AGIs $100k-200k , 7321.2% for AGIs over 200k ) Self-employed (Keogh) retirement plans: $35,326 (reported on 1.1% of returns )75219:
$35,326Texas:
$29,298
(% of AGI for various income ranges: 9.1% for AGIs $25k-50k , 83.9% for AGIs $100k-200k , 1035.7% for AGIs over 200k ) Total itemized deductions: $111,123 (reported on 15.2% of returns )Here:
$111,123State:
$40,428
(% of AGI for various income ranges: 69.6% for AGIs below $25k , 163.0% for AGIs $25k-50k , 207.8% for AGIs $50k-75k , 491.3% for AGIs $75k-100k , 1223.0% for AGIs $100k-200k , 52014.1% for AGIs over 200k ) Charity contributions: $99,792 (reported on 12.3% of returns )Here:
$99,792State:
$18,201
(% of AGI for various income ranges: 4.0% for AGIs below $25k , 23.9% for AGIs $25k-50k , 35.3% for AGIs $50k-75k , 91.3% for AGIs $75k-100k , 269.5% for AGIs $100k-200k , 41870.6% for AGIs over 200k ) Taxes paid: $8,318 (reported on 15.0% of returns )(% of AGI for various income ranges: 16.8% for AGIs below $25k , 40.2% for AGIs $25k-50k , 50.9% for AGIs $50k-75k , 148.2% for AGIs $75k-100k , 364.1% for AGIs $100k-200k , 2192.2% for AGIs over 200k ) Earned income credit: $1,724 (reported on 6.9% of returns )(% of AGI for various income ranges: 67.1% for AGIs below $25k , 18.9% for AGIs $25k-50k ) Percentage of individuals using paid preparers for their 2020 taxes: 92.6%(% for various income ranges: 88.5% for AGIs below $25k , 90.9% for AGIs $25k-50k , 94.5% for AGIs $50k-75k , 94.2% for AGIs $75k-100k , 94.9% for AGIs $100k-200k , 93.6% for AGIs over 200k )
Averages for the 2012 tax year for zip code 75219, filed in 2013:
Average Adjusted Gross Income (AGI) in 2012: $166,946 (Individual Income Tax Returns) Here:
$166,946State:
$65,384
Salary/wage: $81,822 (reported on 84.9% of returns )Here:
$81,822State:
$52,524
(% of AGI for various income ranges: 78.3% for AGIs below $25k , 87.6% for AGIs $25k-50k , 86.5% for AGIs $50k-75k , 83.0% for AGIs $75k-100k , 76.5% for AGIs $100k-200k , 25.6% for AGIs over 200k ) Taxable interest for individuals: $11,168 (reported on 32.6% of returns )This zip code:
$11,168Texas:
$2,372
(% of AGI for various income ranges: 1.6% for AGIs below $25k , 0.5% for AGIs $25k-50k , 0.6% for AGIs $50k-75k , 0.9% for AGIs $75k-100k , 1.2% for AGIs $100k-200k , 2.7% for AGIs over 200k ) Ordinary dividends: $54,613 (reported on 25.2% of returns )(% of AGI for various income ranges: 4.9% for AGIs below $25k , 1.9% for AGIs $25k-50k , 1.7% for AGIs $50k-75k , 2.1% for AGIs $75k-100k , 2.7% for AGIs $100k-200k , 10.5% for AGIs over 200k ) Net capital gain/loss in AGI: +$237,913 (reported on 22.2% of returns )Here:
+$237,913State:
+$35,319
(% of AGI for various income ranges: 0.6% for AGIs $25k-50k , 0.7% for AGIs $50k-75k , 1.1% for AGIs $75k-100k , 2.9% for AGIs $100k-200k , 43.7% for AGIs over 200k ) Profit/loss from business: +$32,775 (reported on 19.4% of returns )Here:
+$32,775State:
+$13,732
(% of AGI for various income ranges: 11.2% for AGIs below $25k , 5.1% for AGIs $25k-50k , 3.7% for AGIs $50k-75k , 4.1% for AGIs $75k-100k , 5.4% for AGIs $100k-200k , 3.2% for AGIs over 200k ) Taxable individual retirement arrangement distribution: $46,118 (reported on 7.2% of returns )75219:
$46,118Texas:
$19,511
(% of AGI for various income ranges: 1.9% for AGIs below $25k , 1.3% for AGIs $25k-50k , 1.7% for AGIs $50k-75k , 2.2% for AGIs $75k-100k , 3.5% for AGIs $100k-200k , 1.8% for AGIs over 200k ) Self-employment retirement plans: $23,971 (reported on 1.5% of returns )75219:
$23,971Texas:
$23,938
(% of AGI for various income ranges: 0.2% for AGIs $25k-50k , 0.2% for AGIs $50k-75k , 0.4% for AGIs $100k-200k , 0.2% for AGIs over 200k ) Total itemized deductions: $54,146 (13% of AGI, reported on 32.4% of returns )Here:
$54,146State:
$24,724
Here:
12.9% of AGIState:
15.9% of AGI
(% of AGI for various income ranges: 9.1% for AGIs below $25k , 7.4% for AGIs $25k-50k , 9.5% for AGIs $50k-75k , 11.4% for AGIs $75k-100k , 11.5% for AGIs $100k-200k , 10.7% for AGIs over 200k ) Charity contributions: $28,308 (reported on 25.6% of returns )(% of AGI for various income ranges: 0.6% for AGIs below $25k , 0.9% for AGIs $25k-50k , 1.1% for AGIs $50k-75k , 1.4% for AGIs $75k-100k , 1.8% for AGIs $100k-200k , 5.5% for AGIs over 200k ) Taxes paid: $11,438 (reported on 31.5% of returns )75219:
$11,438State:
$6,921
(% of AGI for various income ranges: 1.9% for AGIs below $25k , 1.8% for AGIs $25k-50k , 2.7% for AGIs $50k-75k , 3.5% for AGIs $75k-100k , 3.8% for AGIs $100k-200k , 1.8% for AGIs over 200k ) Earned income credit: $1,960 (reported on 10.0% of returns )(% of AGI for various income ranges: 4.2% for AGIs below $25k , 0.3% for AGIs $25k-50k ) Percentage of individuals using paid preparers for their 2012 taxes: 47.8%(% for various income ranges: 45.6% for AGIs below $25k , 40.1% for AGIs $25k-50k , 39.6% for AGIs $50k-75k , 43.3% for AGIs $75k-100k , 56.8% for AGIs $100k-200k , 81.5% for AGIs over 200k )
Averages for the 2004 tax year for zip code 75219, filed in 2005:
Average Adjusted Gross Income (AGI) in 2004: $101,225 (Individual Income Tax Returns) Here:
$101,225State:
$47,881
Salary/wage: $73,644 (reported on 84.6% of returns )Here:
$73,644State:
$41,947
(% of AGI for various income ranges: 85.6% for AGIs $10k-25k , 89.5% for AGIs $25k-50k , 86.0% for AGIs $50k-75k , 81.8% for AGIs $75k-100k , 47.3% for AGIs over 100k ) Taxable interest for individuals: $9,342 (reported on 37.2% of returns )This zip code:
$9,342Texas:
$2,255
(% of AGI for various income ranges: 1.5% for AGIs $10k-25k , 1.2% for AGIs $25k-50k , 1.3% for AGIs $50k-75k , 1.7% for AGIs $75k-100k , 3.6% for AGIs over 100k ) Taxable dividends: $28,256 (reported on 25.4% of returns )(% of AGI for various income ranges: 1.7% for AGIs $10k-25k , 1.3% for AGIs $25k-50k , 1.6% for AGIs $50k-75k , 2.2% for AGIs $75k-100k , 8.1% for AGIs over 100k ) Net capital gain/loss: +$84,119 (reported on 23.9% of returns )Here:
+$84,119State:
+$16,110
(% of AGI for various income ranges: 0.2% for AGIs $10k-25k , 0.9% for AGIs $25k-50k , 1.1% for AGIs $50k-75k , 2.5% for AGIs $75k-100k , 24.3% for AGIs over 100k ) Profit/loss from business: +$22,983 (reported on 18.7% of returns )Here:
+$22,983State:
+$11,013
(% of AGI for various income ranges: 7.2% for AGIs $10k-25k , 4.4% for AGIs $25k-50k , 3.9% for AGIs $50k-75k , 5.6% for AGIs $75k-100k , 4.4% for AGIs over 100k ) IRA payment deduction: $2,828 (reported on 2.2% of returns )(% of AGI for various income ranges: 0.2% for AGIs $10k-25k , 0.1% for AGIs $25k-50k , 0.1% for AGIs $50k-75k , 0.1% for AGIs $75k-100k , 0.0% for AGIs over 100k ) Self-employed pension: $22,417 (reported on 1.9% of returns )Here:
$22,417Texas:
$16,401
(% of AGI for various income ranges: 0.1% for AGIs $10k-25k , 0.1% for AGIs $25k-50k , 0.3% for AGIs $50k-75k , 0.4% for AGIs $75k-100k , 0.5% for AGIs over 100k ) Total itemized deductions: $42,062 (16% of AGI, reported on 30.7% of returns )Here:
$42,062State:
$19,631
Here:
15.5% of AGIState:
18.9% of AGI
(% of AGI for various income ranges: 9.6% for AGIs $10k-25k , 8.2% for AGIs $25k-50k , 12.8% for AGIs $50k-75k , 14.0% for AGIs $75k-100k , 12.2% for AGIs over 100k ) Charity contributions deductions: $18,852 (6% of AGI, reported on 25.1% of returns )Here:
6.1% of AGIState:
4.2% of AGI
(% of AGI for various income ranges: 0.8% for AGIs $10k-25k , 0.9% for AGIs $25k-50k , 1.3% for AGIs $50k-75k , 1.9% for AGIs $75k-100k , 5.5% for AGIs over 100k ) Total tax: $27,616 (reported on 77.4% of returns )75219:
$27,616State:
$9,058
(% of AGI for various income ranges: 4.5% for AGIs $10k-25k , 9.4% for AGIs $25k-50k , 13.8% for AGIs $50k-75k , 16.0% for AGIs $75k-100k , 22.7% for AGIs over 100k ) Earned income credit: $1,688 (reported on 13.9% of returns )Percentage of individuals using paid preparers for their 2004 taxes: 52.0%(% for various income ranges: 53.1% for AGIs below $10k , 52.7% for AGIs $10k-25k , 42.3% for AGIs $25k-50k , 43.8% for AGIs $50k-75k , 53.3% for AGIs $75k-100k , 74.4% for AGIs over 100k )
Estimated median household income in 2022: This zip code:
$85,933Texas:
$72,284
Nearest zip codes: 75204 ,
75207 ,
75201 ,
75390 ,
75205 ,
75270 .
Highland Park Zip Code Map
Percentage of family households: This zip code:
20.0%Texas:
50.5%
Percentage of households with unmarried partners: This zip code:
6.1%Texas:
48.7%
Likely homosexual households (counted as self-reported same-sex unmarried-partner households)
Lesbian couples: 0.1% of all households Gay men: 1.9% of all households
Household received Food Stamps/SNAP in the past 12 months: 510Household did not receive Food Stamps/SNAP in the past 12 months: 16,805
Women who had a birth in the past 12 months: 154 (74 now married , 77 unmarried) Women who did not have a birth in the past 12 months: 7,711 (1,912 now married , 5,846 unmarried)
Housing units in zip code 75219 with a mortgage: 3,289 (45
second mortgage , 14
both second mortgage and home equity loan )
Median monthly owner costs for units with a mortgage: $2,413
Median monthly owner costs for units without a mortgage: $1,520
Residents with income below the poverty level in 2022:
This zip code:
9.3%Whole state:
14.0%
Residents with income below 50% of the poverty level in 2022:
This zip code:
3.0%Whole state:
7.4%
Median number of rooms in houses and condos: Median number of rooms in apartments: Notable locations in this zip code not listed on our city pages
Click to draw/clear zip code borders Notable locations in zip code 75219: (A) , John Hickman Miller House (B) , Dallas Fire - Rescue Station 11 (C) , Number 4 Hook and Ladder Company (D) . Display/hide their locations on the map
Churches in zip code 75219 include: (A) , Oak Lawn United Methodist Church (B) , Bethany Presbyterian Church (C) , Park Cities Presbyterian Church (D) , Church of the Holy Cross (E) , All Peoples Assembly of God Church (F) , Oak Hill Baptist Church (G) , North Dallas Baptist Church (H) , Oak Lawn Methodist Episcopal Church South (I) . Display/hide their locations on the map
Reservoir: (A) . Display/hide its location on the map
Parks in zip code 75219 include: (1) , Robert E Lee Park (2) , Reverschon Park (3) , Craddock Park (4) . Display/hide their locations on the map
Year house built (houses)
136 2020 or later5,637 2010 to 20195,009 2000 to 20092,061 1990 to 19991,995 1980 to 19891,429 1970 to 19791,988 1960 to 1969985 1950 to 1959228 1940 to 1949605 1939 or earlier
Zip code 75219 household income distribution in 2022 1,102 Less than $10,000241 $10,000 to $14,999240 $15,000 to $19,999422 $20,000 to $24,999357 $25,000 to $29,999207 $30,000 to $34,999358 $35,000 to $39,999394 $40,000 to $44,999679 $45,000 to $49,9991,477 $50,000 to $59,9992,134 $60,000 to $74,9991,962 $75,000 to $99,9991,649 $100,000 to $124,9991,722 $125,000 to $149,9991,601 $150,000 to $199,9992,824 $200,000 or moreEstimate of home value of owner-occupied houses/condos in 2022 in zip code 75219 46 Less than $10,0009 $30,000 to $34,99921 $50,000 to $59,99913 $60,000 to $69,99921 $90,000 to $99,99966 $100,000 to $124,99981 $125,000 to $149,999159 $150,000 to $174,999217 $175,000 to $199,999735 $200,000 to $249,999500 $250,000 to $299,999863 $300,000 to $399,999775 $400,000 to $499,9991,253 $500,000 to $749,999731 $750,000 to $999,999144 $1,000,000 to $1,499,999198 $1,500,000 to $1,999,999308 $2,000,000 or moreRent paid by renters in 2022 in zip code 75219 10 Less than $10020 $150 to $19939 $200 to $24921 $400 to $44948 $500 to $54919 $550 to $59965 $600 to $649162 $650 to $69997 $700 to $74976 $750 to $799360 $800 to $899456 $900 to $9991,601 $1,000 to $1,2492,561 $1,250 to $1,4993,981 $1,500 to $1,9991,935 $2,000 to $2,499547 $2,500 to $2,999192 $3,000 to $3,499454 $3,500 or more129 No cash rent
Median gross rent in 2022: $1,724.
Median price asked for vacant for-sale houses and condos in 2022: $415,706.
Estimated median house (or condo) value in 2022 for: White Non-Hispanic householders: $593,475Black or African American householders: $396,644Asian householders: $232,021Some other race householders: $146,132Two or more races householders: $626,280Hispanic or Latino householders: $199,514Estimated median house or condo value in 2022: $443,764
75219:
$443,764Texas:
$275,400
Lower value quartile - upper value quartile: $275,177 - $738,431
Mean price in 2022: Detached houses: $1,143,113Here:
$1,143,113State:
$369,058
Townhouses or other attached units: $506,877Here:
$506,877State:
$327,631
In 2-unit structures: $686,987Here:
$686,987State:
$374,947
In 3-to-4-unit structures: $368,883Here:
$368,883State:
$209,652
In 5-or-more-unit structures: $580,182Here:
$580,182State:
$413,944
Housing units in structures:
One, detached: 1,506One, attached: 1,912Two: 3023 or 4: 9635 to 9: 1,25410 to 19: 1,80120 to 49: 2,83250 or more: 10,575Boats, RVs, vans, etc.: 35Unemployment : 2.9%
Means of transportation to work in zip code 75219 67.2% 12,985 Drove a car alone5.4% 1,035 Carpooled0.8% 145 Bus or trolley bus0.0% 5 Streetcar or trolley car0.1% 22 Subway or elevated0.4% 70 Railroad0.1% 11 Motorcycle0.3% 62 Bicycle1.7% 336 Walked0.8% 151 Other means25.9% 5,001 Worked at homeTravel time to work (commute) in zip code 75219 339 Less than 5 minutes1,738 5 to 9 minutes2,746 10 to 14 minutes2,426 15 to 19 minutes1,759 20 to 24 minutes1,216 25 to 29 minutes2,263 30 to 34 minutes586 35 to 39 minutes720 40 to 44 minutes758 45 to 59 minutes276 60 to 89 minutes74 90 or more minutes
Neighborhoods in zip code 75219: Percentage of zip code residents living and working in this county: 85.5%
Household type by relationship:
Households: 25,463
Male householders: 9,601 (6,089 living alone ), Female householders: 7,779 (5,169 living alone )3,245 spouses (2,727 opposite-sex spouses ), 1,462 unmarried partners , (983 opposite-sex unmarried partners ), 2,043 children (1,899 natural , 80 adopted , 64 stepchildren ), 12 grandchildren , 375 brothers or sisters , 114 parents , 0 foster children , 201 other relatives , 1,051 non-relatives In group quarters: 76 (-1 institutionalized population )
Size of family households: 3,270 2-persons , 784 3-persons , 198 4-persons , 185 5-persons , 19 6-persons
Size of nonfamily households: 11,260 1-person , 1,982 2-persons , 39 3-persons , 29 4-persons
839 married couples with children. single-parent households (225 men , 536 women ).
71.1% of residents of 75219 zip code speak English at home. of residents speak Spanish at home (79% very well, 7% well, 11% not well, 4% not at all ).of residents speak other Indo-European language at home (89% very well, 10% well, 1% not well ).of residents speak Asian or Pacific Island language at home (86% very well, 2% well, 11% not well, 1% not at all ).of residents speak other language at home (84% very well, 16% well ).
Foreign born population: 4,860 (19.1%)
(49.8%
of them are naturalized citizens )
This zip code:
19.1%Whole state:
17.2%
25% Honduras 8% Thailand 8% Malaysia 6% Japan 4% Costa Rica 3% Bhutan 3% Liberia 11% English 7% American 5% Irish 4% German 4% European 2% Italian 1% African
Year of entry for the foreign-born population
2,614 2010 or later 1,109 2000 to 2009 808 1990 to 1999 1,138 Before 1990
There are
283 Other Medical Specialists in Zip Code 75219.
Facilities with environmental interests located in this zip code:
ARCADIA EXPLORATION & PROD CO (3838 OAK LAWN AVE STE 650 in DALLAS, TX)
ENFORCEMENT/COMPLIANCE ACTIVITY (Integrated Compliance Information System) - ICIS-06-1998-0387, FORMAL ENFORCEMENT ACTION, ICIS-06-1998-0522, (Integrated Compliance Information System) - ICIS-06-1998-0387, FORMAL ENFORCEMENT ACTION, ICIS-06-1998-0522, Business SIC classification: CRUDE PETROLEUM AND NATURAL GAS; OIL AND GAS FIELD EXPLORATION SERVICES
Housing units lacking complete plumbing facilities: 0.9%
Housing units lacking complete kitchen facilities: 1.2%
80.4% Electricity 18.5% Utility gas
Population in 1990: 19,178. Population change in the 1990s: +3,487 (+18.2%).
Place of birth for U.S.-born residents:
This state: 10,133Northeast: 1,229Midwest: 2,569South: 3,563West: 2,640
37% of the 75219 zip code residents lived in the same house 5 years ago.
Out of people who lived in different houses, 62% lived in this county.
Out of people who lived in different counties, 50% lived in Texas.
70% of the 75219 zip code residents lived in the same house 1 year ago.
Out of people who lived in different houses, 52% moved from this county.
Out of people who lived in different houses, 21% moved from different county within same state.
Out of people who lived in different houses, 23% moved from different state.
Out of people who lived in different houses, 3% moved from abroad.
Private vs. public school enrollment:
Students in private schools in grades 1 to 8 (elementary and middle school): 154
Students in private schools in grades 9 to 12 (high school): 128
Students in private undergraduate colleges: 297
Occupation by median earnings in the past 12 months ($)
128,986 Legal occupations 96,273 Management occupations 91,447 Business and financial operations occupations 85,875 Computer and mathematical occupations 78,312 Health diagnosing and treating practitioners and other technical occupations 77,428 Architecture and engineering occupations
Companies with federal contracts located in this zip code (DALLAS, TX):
BEARDEN INVESTIGATIVE AGENCY, (3131 TURTLE CREK BLVD 8 S; small business) employees , $480000 revenue . : $220,000 in 4 contracts from 2002 to 2005
$75,000 with SOCIAL SECURITY ADMINISTRATION for Security Studies (Physical and Personal). Signed on 2003-05-15. Completion date: 2005-05-15.
, same as above. Signed on 2002-05-15. Completion date: 2005-05-15.
, same as above. Signed on 2004-05-17. Completion date: 2005-05-31.
, same as above. Signed on 2005-05-18. Completion date: 2005-06-30.
BAY MODULAR, LLC (2911 TURTLE CREEK; small business) in 3 contracts from 2005 to 2006
$185,713 with Army for Prefabricated and Portable Buildings. Signed on 2006-02-02. Completion date: 2006-02-28.
with Air Force for Prefabricated and Portable Buildings. Signed on 2005-09-26. Completion date: 2005-11-07.
with Army for Prefabricated and Portable Buildings. Signed on 2006-05-04. Completion date: 2006-02-28.
DICKSON EQUIPMENT CO INC (131 EXPRESS ST; small business)
$124,000 with Army for Trucks and Truck Tractors, Wheeled. Signed on 2003-04-28. Completion date: 2003-05-15.
CITADEL TECHNOLOGY, INC. (3811 TURTLE CREEK BLVD.; small business)
$29,332 with Navy for Other ADP and Telecommunications Services (includes data storage on tapes, compact disks, etc.). Signed on 2000-09-26. Completion date: 2000-10-20.
RBI ADVERTISING, INC (3906 LEMMON AVE STE 207; small business) in 2 contracts from 2001 to 2003
$8,216 with Army for Time Measuring Instruments. Signed on 2001-11-15. Completion date: 2001-11-30.
, same as above. Signed on 2003-09-08. Completion date: 2003-09-26.
SUSQUEHANNA PFALTZGRAFF CO (3500 MAPLE AVE STE 1600)
$4,000 with Army for Miscellaneous Service and Trade Equipment. Signed on 2005-02-15. Completion date: 2005-02-19.
AGON MANAGEMENT GROUP LLC (3811 TURTLE CREEK BLVD; small business)
$3,500 with Navy for Maintenance, Repair and Rebuilding of Equipment -- Service and Trade Equipment. Signed on 2004-08-27. Completion date: 2004-09-04.
WEBLINK WIRELESS, INC (3333 LEE PARKWAY) in 4 contracts from 2001 to 2002
$250 with Army for Telephone and/or Communications Services (includes Telegraph, Telex, and Cablevision Services). Taking place in MD. Signed on 2001-10-18. Completion date: 2003-01-31.
, same as above. Signed on 2001-10-18. Completion date: 2003-01-31.
, same as above. Signed on 2002-09-05. Completion date: 2001-12-31.
, same as above. Signed on 2002-09-05. Completion date: 2001-12-31.
Top industries in this zip code by the number of employees in 2005:
Accommodation and Food Services: Full-Service Restaurants (100-249 employees: 2 establishments, 50-99 employees: 7 establishments, 20-49 employees: 18 establishments, 10-19 employees: 12 establishments, 5-9 employees: 3 establishments, 1-4 employees: 11 establishments)Professional, Scientific, and Technical Services: Offices of Lawyers (250-499: 1, 20-49: 3, 10-19: 11, 5-9: 34, 1-4: 119)Accommodation and Food Services: Limited-Service Restaurants (250-499: 1, 20-49: 11, 10-19: 11, 5-9: 3, 1-4: 5)Arts, Entertainment, and Recreation: Promoters of Performing Arts, Sports, and Similar Events with Facilities (500-999: 1, 1-4: 1)Health Care and Social Assistance: Specialty (except Psychiatric and Substance Abuse) Hospitals (500-999: 1)Accommodation and Food Services: Hotels (except Casino Hotels) and Motels (250-499: 1, 100-249: 1)Administrative and Support and Waste Management and Remediation Services: Temporary Help Services (100-249: 2, 20-49: 4, 5-9: 1, 1-4: 4)Finance and Insurance: Direct Property and Casualty Insurance Carriers (250-499: 1, 20-49: 2, 10-19: 2, 1-4: 3)
People in group quarters in 2010:
37 people in nursing facilities/skilled-nursing facilities
23 people in residential treatment centers for juveniles (non-correctional)
People in group quarters in 2000:
25 people in homes or halfway houses for drug/alcohol abuse
10 people in other noninstitutional group quarters
5 people in orthopedic wards and institutions for the physically handicapped
Fatal accident statistics in 2014:
Fatal accident count: 3Vehicles involved in fatal accidents: 3Fatal accidents caused by drunken drivers: 0Fatalities: 3Persons involved in fatal accidents: 4Pedestrians involved in fatal accidents: 1
Fatal accident statistics in 2012:
Fatal accident count: 2Vehicles involved in fatal accidents: 3Fatal accidents caused by drunken drivers: 1Fatalities: 2Persons involved in fatal accidents: 6Pedestrians involved in fatal accidents: 0
Home Mortgage Disclosure Act Aggregated Statistics For Year 2009(Based on 2 full and 12 partial tracts) A) FHA, FSA/RHS & VA B) Conventional C) Refinancings D) Home Improvement Loans E) Loans on Dwellings For 5+ Families F) Non-occupant Loans on Number Average Value Number Average Value Number Average Value Number Average Value Number Average Value Number Average Value
LOANS ORIGINATED 90 $160,368 327 $220,596 521 $251,517 15 $107,191 13 $3,390,756 74 $214,465 APPLICATIONS APPROVED, NOT ACCEPTED 9 $188,383 33 $238,144 47 $223,689 2 $180,305 0 $0 12 $218,947 APPLICATIONS DENIED 11 $205,053 69 $268,483 236 $299,586 15 $62,786 1 $32,692,220 39 $227,650 APPLICATIONS WITHDRAWN 19 $171,891 54 $171,313 141 $231,434 3 $242,667 0 $0 25 $179,455 FILES CLOSED FOR INCOMPLETENESS 3 $192,847 11 $328,766 33 $327,111 0 $0 0 $0 10 $238,653
Aggregated Statistics For Year 2008(Based on 2 full and 12 partial tracts) A) FHA, FSA/RHS & VA B) Conventional C) Refinancings D) Home Improvement Loans E) Loans on Dwellings For 5+ Families F) Non-occupant Loans on Number Average Value Number Average Value Number Average Value Number Average Value Number Average Value Number Average Value
LOANS ORIGINATED 55 $146,119 520 $246,444 266 $290,847 38 $126,729 8 $1,484,971 126 $235,860 APPLICATIONS APPROVED, NOT ACCEPTED 3 $155,337 59 $265,859 38 $212,059 4 $53,842 0 $0 10 $225,167 APPLICATIONS DENIED 5 $179,952 100 $258,041 160 $203,935 33 $83,177 4 $2,355,575 50 $192,011 APPLICATIONS WITHDRAWN 14 $153,009 88 $246,831 85 $209,814 6 $303,913 0 $0 24 $270,424 FILES CLOSED FOR INCOMPLETENESS 3 $111,987 19 $226,472 18 $248,584 9 $95,908 0 $0 7 $147,436
Aggregated Statistics For Year 2007(Based on 2 full and 12 partial tracts) A) FHA, FSA/RHS & VA B) Conventional C) Refinancings D) Home Improvement Loans E) Loans on Dwellings For 5+ Families F) Non-occupant Loans on G) Loans On Manufactured Number Average Value Number Average Value Number Average Value Number Average Value Number Average Value Number Average Value Number Average Value
LOANS ORIGINATED 12 $144,271 1,249 $204,495 251 $298,794 25 $126,870 21 $2,407,765 271 $224,472 1 $99,070 APPLICATIONS APPROVED, NOT ACCEPTED 1 $148,000 212 $174,485 64 $297,680 9 $100,306 1 $495,000 42 $251,586 0 $0 APPLICATIONS DENIED 2 $119,515 275 $232,024 175 $280,699 39 $75,157 8 $152,632 91 $245,806 1 $29,000 APPLICATIONS WITHDRAWN 1 $127,040 143 $252,604 75 $287,558 3 $78,577 0 $0 42 $224,191 0 $0 FILES CLOSED FOR INCOMPLETENESS 1 $267,060 35 $277,097 28 $212,659 5 $21,140 1 $1,877,010 13 $252,085 0 $0
Aggregated Statistics For Year 2006(Based on 2 full and 12 partial tracts) A) FHA, FSA/RHS & VA B) Conventional C) Refinancings D) Home Improvement Loans E) Loans on Dwellings For 5+ Families F) Non-occupant Loans on G) Loans On Manufactured Number Average Value Number Average Value Number Average Value Number Average Value Number Average Value Number Average Value Number Average Value
LOANS ORIGINATED 10 $106,844 1,880 $179,137 258 $286,416 43 $194,527 27 $2,368,627 361 $216,203 0 $0 APPLICATIONS APPROVED, NOT ACCEPTED 3 $91,493 249 $190,407 52 $293,909 8 $167,918 0 $0 40 $158,254 1 $18,660 APPLICATIONS DENIED 3 $164,457 419 $188,971 173 $226,901 39 $43,959 3 $6,561,273 111 $183,908 1 $12,330 APPLICATIONS WITHDRAWN 3 $78,917 254 $206,265 102 $239,371 10 $201,002 0 $0 52 $244,675 0 $0 FILES CLOSED FOR INCOMPLETENESS 0 $0 47 $233,609 34 $166,236 0 $0 0 $0 15 $127,779 0 $0
Aggregated Statistics For Year 2005(Based on 2 full and 12 partial tracts) A) FHA, FSA/RHS & VA B) Conventional C) Refinancings D) Home Improvement Loans E) Loans on Dwellings For 5+ Families F) Non-occupant Loans on G) Loans On Manufactured Number Average Value Number Average Value Number Average Value Number Average Value Number Average Value Number Average Value Number Average Value
LOANS ORIGINATED 14 $103,938 1,664 $174,743 317 $242,418 54 $103,091 21 $1,176,180 275 $156,411 2 $43,000 APPLICATIONS APPROVED, NOT ACCEPTED 2 $121,480 182 $155,559 48 $186,535 8 $58,724 0 $0 29 $162,925 3 $44,217 APPLICATIONS DENIED 7 $123,269 315 $135,041 219 $198,517 45 $80,394 0 $0 72 $152,703 3 $56,953 APPLICATIONS WITHDRAWN 1 $180,710 238 $156,437 121 $239,848 16 $245,321 0 $0 42 $241,061 0 $0 FILES CLOSED FOR INCOMPLETENESS 2 $44,755 42 $187,757 75 $197,825 1 $52,380 0 $0 16 $332,918 0 $0
Aggregated Statistics For Year 2004(Based on 2 full and 12 partial tracts) A) FHA, FSA/RHS & VA B) Conventional C) Refinancings D) Home Improvement Loans E) Loans on Dwellings For 5+ Families F) Non-occupant Loans on G) Loans On Manufactured Number Average Value Number Average Value Number Average Value Number Average Value Number Average Value Number Average Value Number Average Value
LOANS ORIGINATED 20 $121,793 1,509 $186,429 482 $201,008 46 $67,396 20 $933,404 260 $186,907 4 $71,150 APPLICATIONS APPROVED, NOT ACCEPTED 1 $215,370 152 $173,858 61 $190,641 9 $127,189 0 $0 27 $156,618 0 $0 APPLICATIONS DENIED 2 $85,765 224 $130,117 201 $202,587 29 $75,436 2 $244,460 70 $114,313 3 $87,610 APPLICATIONS WITHDRAWN 6 $113,533 148 $235,915 108 $191,103 6 $164,770 0 $0 33 $267,493 1 $20,000 FILES CLOSED FOR INCOMPLETENESS 7 $123,596 30 $211,023 56 $173,244 0 $0 0 $0 8 $126,474 0 $0
Aggregated Statistics For Year 2003(Based on 2 full and 12 partial tracts) A) FHA, FSA/RHS & VA B) Conventional C) Refinancings D) Home Improvement Loans E) Loans on Dwellings For 5+ Families F) Non-occupant Loans on Number Average Value Number Average Value Number Average Value Number Average Value Number Average Value Number Average Value
LOANS ORIGINATED 26 $106,978 1,033 $200,190 1,174 $208,413 40 $118,973 25 $2,909,667 267 $182,638 APPLICATIONS APPROVED, NOT ACCEPTED 0 $0 114 $148,333 146 $147,469 12 $40,048 1 $442,230 36 $171,774 APPLICATIONS DENIED 4 $140,460 152 $139,316 308 $154,971 25 $41,708 11 $803,302 66 $136,784 APPLICATIONS WITHDRAWN 0 $0 125 $207,788 182 $206,993 6 $109,603 2 $1,255,925 46 $190,350 FILES CLOSED FOR INCOMPLETENESS 2 $112,350 30 $310,933 33 $173,192 3 $138,657 1 $867,570 10 $102,859
Aggregated Statistics For Year 2002(Based on 2 full and 12 partial tracts) A) FHA, FSA/RHS & VA B) Conventional C) Refinancings D) Home Improvement Loans E) Loans on Dwellings For 5+ Families F) Non-occupant Loans on Number Average Value Number Average Value Number Average Value Number Average Value Number Average Value Number Average Value
LOANS ORIGINATED 22 $98,411 845 $186,707 710 $201,930 45 $100,245 19 $3,069,336 163 $172,202 APPLICATIONS APPROVED, NOT ACCEPTED 0 $0 92 $142,391 106 $157,824 17 $70,045 2 $433,865 12 $91,259 APPLICATIONS DENIED 3 $84,987 139 $168,590 166 $169,119 38 $41,004 6 $599,527 25 $198,112 APPLICATIONS WITHDRAWN 3 $87,950 78 $202,601 111 $191,758 3 $44,627 4 $1,169,268 18 $93,850 FILES CLOSED FOR INCOMPLETENESS 3 $51,253 32 $124,145 39 $305,248 0 $0 5 $18,607,676 4 $237,072
Aggregated Statistics For Year 2001(Based on 2 full and 12 partial tracts) A) FHA, FSA/RHS & VA B) Conventional C) Refinancings D) Home Improvement Loans E) Loans on Dwellings For 5+ Families F) Non-occupant Loans on Number Average Value Number Average Value Number Average Value Number Average Value Number Average Value Number Average Value
LOANS ORIGINATED 37 $99,157 1,002 $194,429 511 $201,593 56 $56,841 23 $972,930 128 $159,557 APPLICATIONS APPROVED, NOT ACCEPTED 7 $143,460 79 $213,334 75 $177,060 17 $79,618 5 $1,114,348 16 $102,326 APPLICATIONS DENIED 3 $157,430 117 $129,656 118 $139,946 27 $34,995 5 $1,123,520 27 $156,263 APPLICATIONS WITHDRAWN 7 $63,054 75 $206,001 92 $171,039 3 $14,103 5 $1,617,976 25 $218,745 FILES CLOSED FOR INCOMPLETENESS 0 $0 43 $155,846 20 $136,998 3 $33,867 1 $3,900,000 7 $84,053
Aggregated Statistics For Year 2000(Based on 2 full and 12 partial tracts) A) FHA, FSA/RHS & VA B) Conventional C) Refinancings D) Home Improvement Loans E) Loans on Dwellings For 5+ Families F) Non-occupant Loans on Number Average Value Number Average Value Number Average Value Number Average Value Number Average Value Number Average Value
LOANS ORIGINATED 39 $108,071 879 $177,908 119 $143,135 41 $43,313 10 $490,900 117 $139,971 APPLICATIONS APPROVED, NOT ACCEPTED 7 $80,356 96 $243,247 24 $226,642 18 $46,347 0 $0 15 $93,989 APPLICATIONS DENIED 12 $97,750 160 $126,690 67 $120,150 19 $23,081 3 $68,493 33 $83,966 APPLICATIONS WITHDRAWN 13 $108,420 71 $173,607 36 $111,612 3 $64,507 2 $2,094,100 3 $121,717 FILES CLOSED FOR INCOMPLETENESS 3 $88,097 24 $110,264 12 $138,833 0 $0 2 $3,011,820 1 $38,000
Aggregated Statistics For Year 1999(Based on 2 full and 6 partial tracts) A) FHA, FSA/RHS & VA B) Conventional C) Refinancings D) Home Improvement Loans E) Loans on Dwellings For 5+ Families F) Non-occupant Loans on Number Average Value Number Average Value Number Average Value Number Average Value Number Average Value Number Average Value
LOANS ORIGINATED 18 $77,446 448 $160,319 125 $144,333 34 $54,658 8 $438,648 74 $136,292 APPLICATIONS APPROVED, NOT ACCEPTED 0 $0 76 $132,999 30 $181,716 14 $50,583 1 $205,000 7 $89,393 APPLICATIONS DENIED 2 $86,445 116 $115,790 57 $134,094 26 $29,358 4 $212,408 16 $97,303 APPLICATIONS WITHDRAWN 5 $126,706 48 $183,469 40 $106,014 0 $0 0 $0 6 $114,557 FILES CLOSED FOR INCOMPLETENESS 1 $62,310 10 $130,465 12 $145,428 0 $0 0 $0 4 $95,915
Private Mortgage Insurance Companies Aggregated Statistics For Year 2009(Based on 1 full and 10 partial tracts) A) Conventional B) Refinancings Number Average Value Number Average Value
LOANS ORIGINATED 53 $186,661 22 $206,820 APPLICATIONS APPROVED, NOT ACCEPTED 8 $145,519 5 $208,680 APPLICATIONS DENIED 11 $178,077 9 $205,750 APPLICATIONS WITHDRAWN 2 $125,500 4 $210,935 FILES CLOSED FOR INCOMPLETENESS 0 $0 1 $598,730
Aggregated Statistics For Year 2008(Based on 2 full and 12 partial tracts) A) Conventional B) Refinancings C) Non-occupant Loans on Number Average Value Number Average Value Number Average Value
LOANS ORIGINATED 128 $197,830 23 $240,841 15 $168,749 APPLICATIONS APPROVED, NOT ACCEPTED 28 $293,079 11 $234,471 4 $193,128 APPLICATIONS DENIED 14 $173,919 2 $249,500 3 $297,093 APPLICATIONS WITHDRAWN 3 $140,230 1 $499,660 0 $0 FILES CLOSED FOR INCOMPLETENESS 2 $473,140 0 $0 2 $473,140
Aggregated Statistics For Year 2007(Based on 2 full and 12 partial tracts) A) Conventional B) Refinancings C) Non-occupant Loans on Number Average Value Number Average Value Number Average Value
LOANS ORIGINATED 180 $190,897 16 $205,482 33 $197,295 APPLICATIONS APPROVED, NOT ACCEPTED 23 $169,748 4 $367,345 4 $130,132 APPLICATIONS DENIED 1 $149,320 0 $0 0 $0 APPLICATIONS WITHDRAWN 13 $165,452 0 $0 1 $386,230 FILES CLOSED FOR INCOMPLETENESS 1 $346,000 0 $0 0 $0
Aggregated Statistics For Year 2006(Based on 2 full and 12 partial tracts) A) Conventional B) Refinancings C) Non-occupant Loans on Number Average Value Number Average Value Number Average Value
LOANS ORIGINATED 131 $132,883 9 $222,633 22 $158,358 APPLICATIONS APPROVED, NOT ACCEPTED 16 $111,581 7 $156,870 9 $120,833 APPLICATIONS DENIED 4 $201,862 1 $129,220 3 $166,080 APPLICATIONS WITHDRAWN 14 $170,881 1 $48,190 6 $243,905 FILES CLOSED FOR INCOMPLETENESS 0 $0 0 $0 0 $0
Aggregated Statistics For Year 2005(Based on 2 full and 12 partial tracts) A) Conventional B) Refinancings C) Non-occupant Loans on Number Average Value Number Average Value Number Average Value
LOANS ORIGINATED 136 $149,359 9 $188,667 27 $155,887 APPLICATIONS APPROVED, NOT ACCEPTED 30 $175,464 4 $318,725 4 $255,635 APPLICATIONS DENIED 0 $0 2 $703,320 2 $703,320 APPLICATIONS WITHDRAWN 4 $88,325 0 $0 0 $0 FILES CLOSED FOR INCOMPLETENESS 0 $0 0 $0 0 $0
Aggregated Statistics For Year 2004(Based on 2 full and 12 partial tracts) A) Conventional B) Refinancings C) Non-occupant Loans on Number Average Value Number Average Value Number Average Value
LOANS ORIGINATED 163 $146,597 19 $151,652 16 $165,128 APPLICATIONS APPROVED, NOT ACCEPTED 23 $151,669 11 $135,247 5 $115,044 APPLICATIONS DENIED 0 $0 0 $0 0 $0 APPLICATIONS WITHDRAWN 10 $177,719 0 $0 0 $0 FILES CLOSED FOR INCOMPLETENESS 3 $101,730 1 $126,630 2 $117,315
Aggregated Statistics For Year 2003(Based on 2 full and 12 partial tracts) A) Conventional B) Refinancings C) Non-occupant Loans on Number Average Value Number Average Value Number Average Value
LOANS ORIGINATED 179 $155,764 56 $167,458 24 $178,417 APPLICATIONS APPROVED, NOT ACCEPTED 36 $149,200 12 $186,718 6 $143,235 APPLICATIONS DENIED 11 $188,479 0 $0 3 $254,177 APPLICATIONS WITHDRAWN 13 $132,202 4 $240,108 1 $96,000 FILES CLOSED FOR INCOMPLETENESS 3 $87,950 0 $0 0 $0
Aggregated Statistics For Year 2002(Based on 2 full and 12 partial tracts) A) Conventional B) Refinancings C) Non-occupant Loans on Number Average Value Number Average Value Number Average Value
LOANS ORIGINATED 195 $126,612 37 $166,664 17 $112,675 APPLICATIONS APPROVED, NOT ACCEPTED 21 $134,158 13 $136,015 2 $13,700 APPLICATIONS DENIED 8 $192,681 2 $62,590 1 $69,840 APPLICATIONS WITHDRAWN 5 $170,098 3 $145,973 1 $314,440 FILES CLOSED FOR INCOMPLETENESS 1 $715,030 0 $0 0 $0
Aggregated Statistics For Year 2001(Based on 2 full and 12 partial tracts) A) Conventional B) Refinancings C) Non-occupant Loans on Number Average Value Number Average Value Number Average Value
LOANS ORIGINATED 180 $140,522 20 $132,697 15 $135,028 APPLICATIONS APPROVED, NOT ACCEPTED 12 $170,339 6 $284,333 0 $0 APPLICATIONS DENIED 6 $83,488 1 $142,140 1 $110,560 APPLICATIONS WITHDRAWN 3 $101,020 0 $0 0 $0 FILES CLOSED FOR INCOMPLETENESS 3 $59,443 0 $0 0 $0
Aggregated Statistics For Year 2000(Based on 2 full and 12 partial tracts) A) Conventional B) Refinancings C) Non-occupant Loans on Number Average Value Number Average Value Number Average Value
LOANS ORIGINATED 178 $136,408 7 $128,843 20 $95,138 APPLICATIONS APPROVED, NOT ACCEPTED 20 $128,713 1 $85,000 3 $173,373 APPLICATIONS DENIED 5 $206,904 0 $0 0 $0 APPLICATIONS WITHDRAWN 15 $144,399 0 $0 2 $149,370 FILES CLOSED FOR INCOMPLETENESS 6 $127,910 0 $0 0 $0
Aggregated Statistics For Year 1999(Based on 2 full and 6 partial tracts) A) Conventional B) Refinancings C) Non-occupant Loans on Number Average Value Number Average Value Number Average Value
LOANS ORIGINATED 109 $115,445 4 $123,525 7 $105,564 APPLICATIONS APPROVED, NOT ACCEPTED 11 $160,019 4 $121,485 2 $142,225 APPLICATIONS DENIED 8 $92,625 0 $0 2 $68,320 APPLICATIONS WITHDRAWN 6 $185,758 1 $44,250 1 $87,700 FILES CLOSED FOR INCOMPLETENESS 7 $122,217 1 $79,020 0 $0
2002 - 2018 National Fire Incident Reporting System (NFIRS) incidents See full 2006 National Fire Incident Reporting System statistics for zip code 75219, Texas
Most common first names in zip code 75219 among deceased individuals Name Count Lived (average)
Mary 124 82.0 years John 113 63.7 years James 109 63.5 years William 96 70.1 years Robert 73 62.9 years George 58 68.8 years Charles 56 69.8 years Margaret 44 81.4 years Thomas 42 64.4 years David 37 52.7 years
Most common last names in zip code 75219 among deceased individuals Last name Count Lived (average)
Smith 44 72.4 years Jones 32 73.9 years Williams 31 67.4 years Johnson 31 70.3 years Hernandez 26 63.3 years Moore 25 71.8 years Davis 23 69.4 years Brown 23 68.2 years Thompson 17 71.1 years Miller 16 78.7 years
Businesses in zip code 75219
Name Count Name Count
7-Eleven 3 Nike 2 AT&T 1 Office Depot 1 Burger King 1 Panera Bread 1 CVS 1 Pizza Hut 1 Carl\s Jr. 1 Quiznos 1 Chico's 1 RadioShack 1 Chipotle 1 Sprint Nextel 1 DHL 1 Starbucks 2 FedEx 6 Subway 1 Holiday Inn 1 T-Mobile 1 Jack In The Box 1 UPS 6 JoS. A. Bank 1 Walgreens 1 KFC 1 Wendy's 1 Kroger 1 Whole Foods Market 1 McDonald's 1
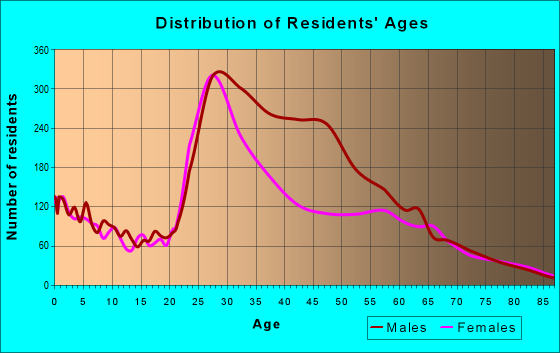
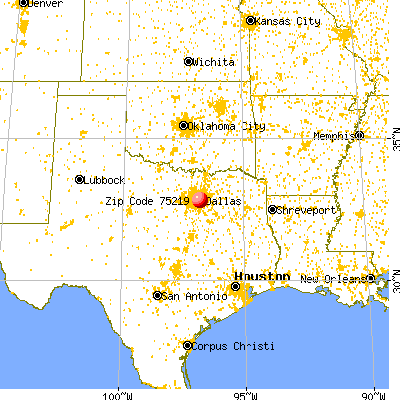


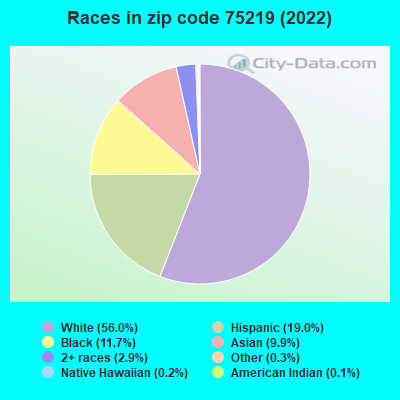


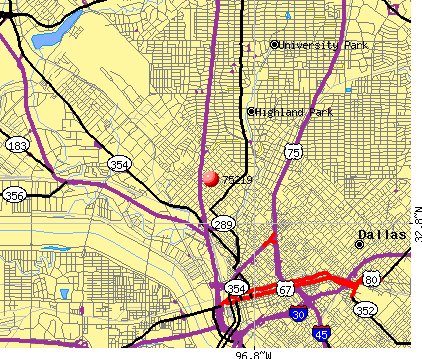 Nearest zip codes: 75204, 75207, 75201, 75390, 75205, 75270.
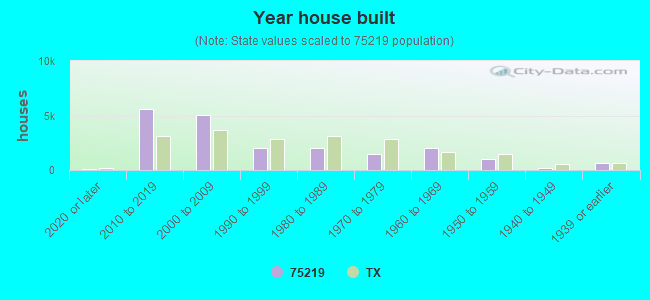

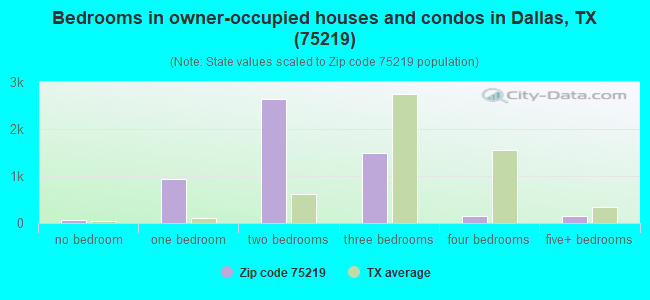
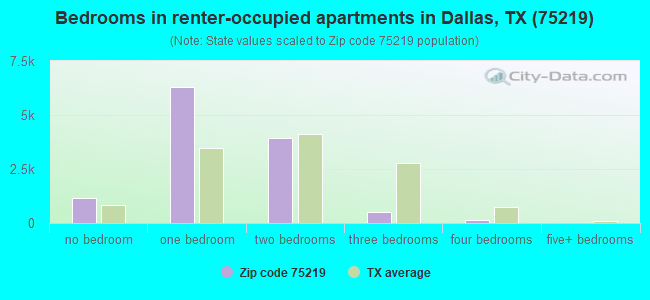
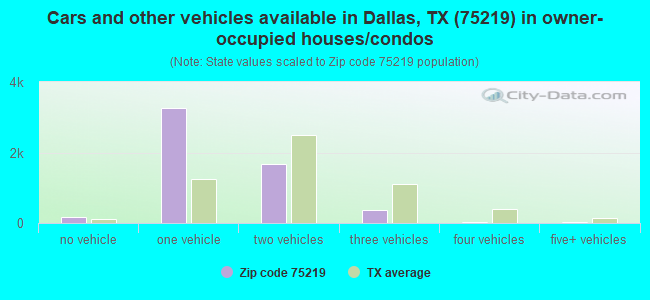
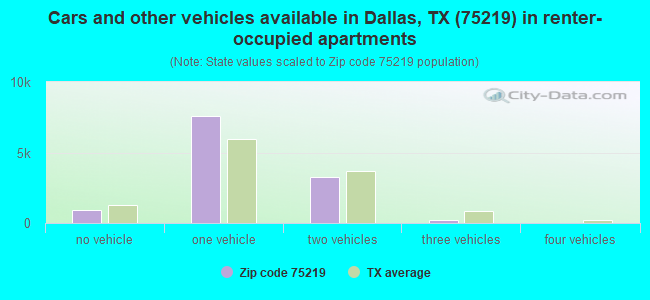


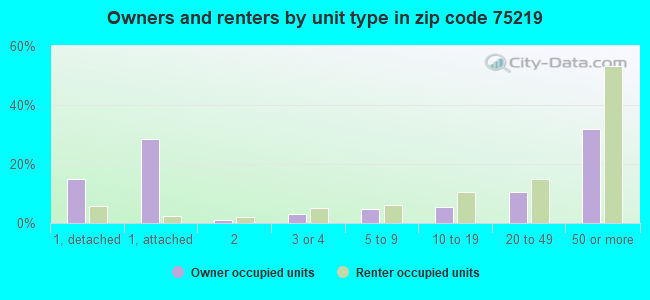
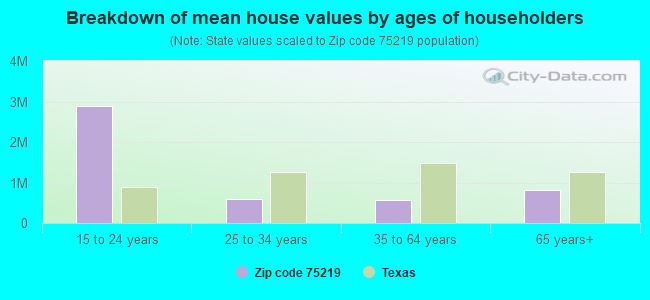


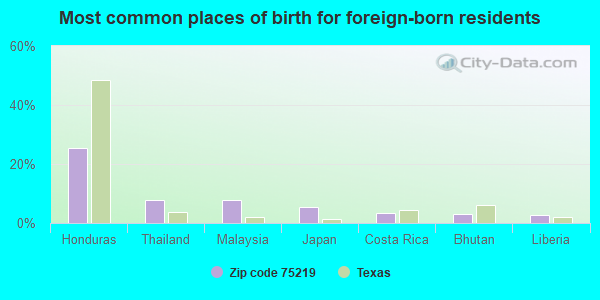
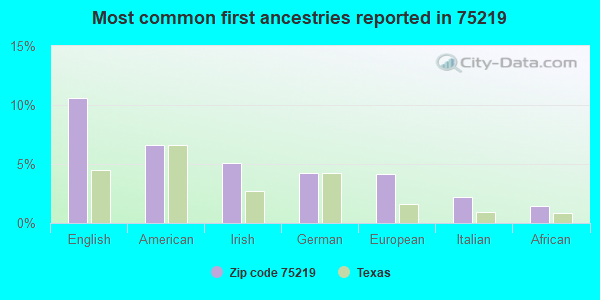
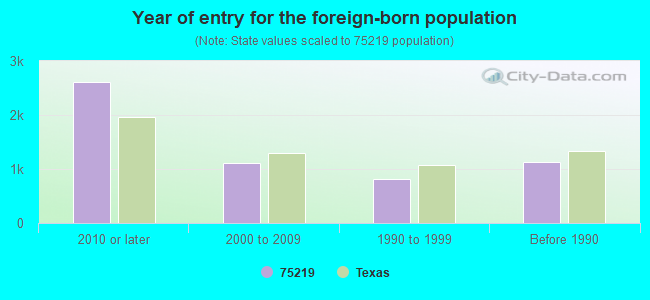


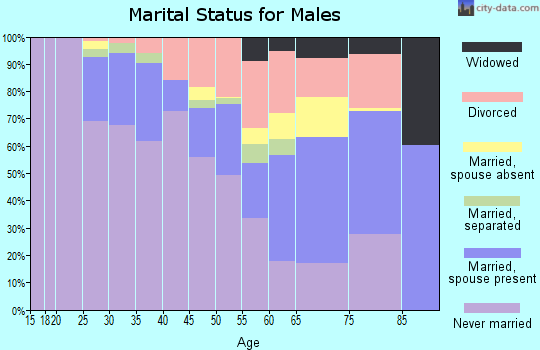
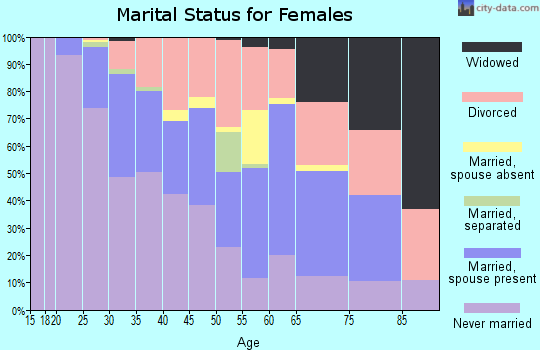
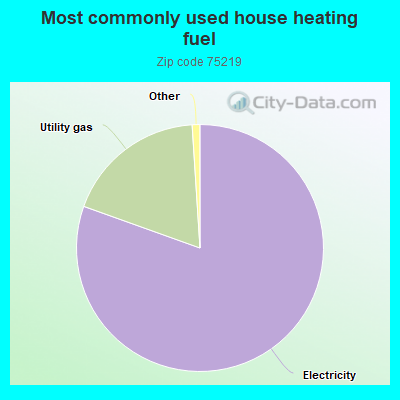
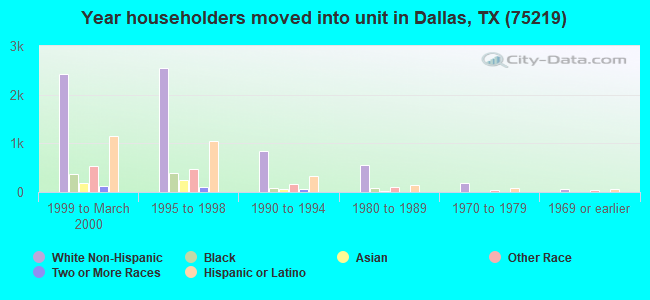
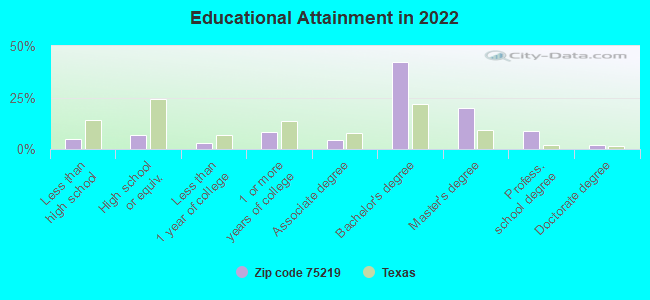
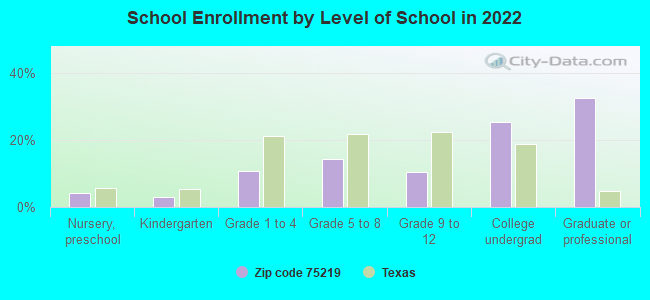
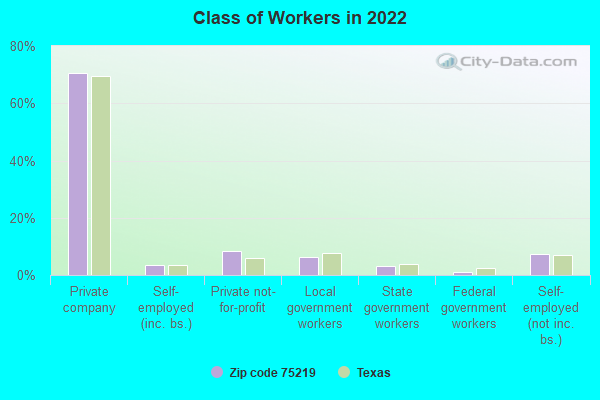
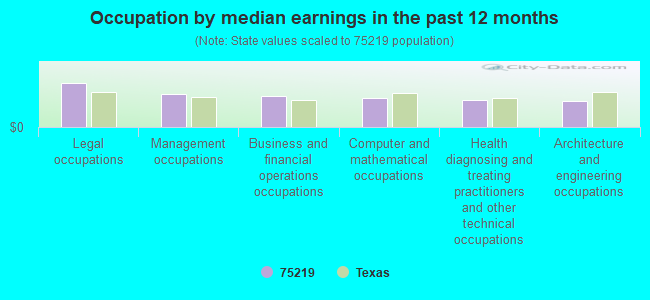
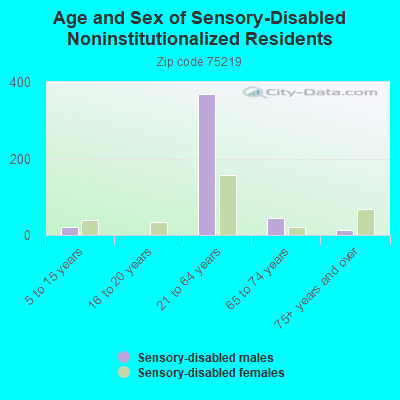
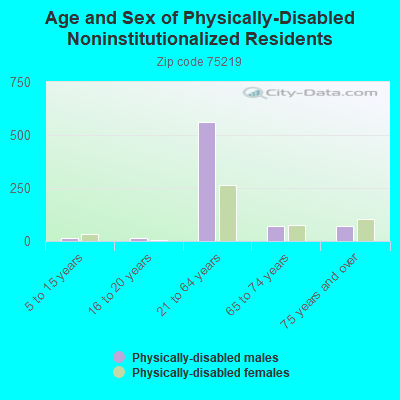
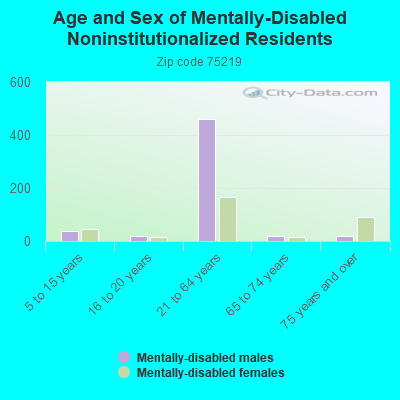
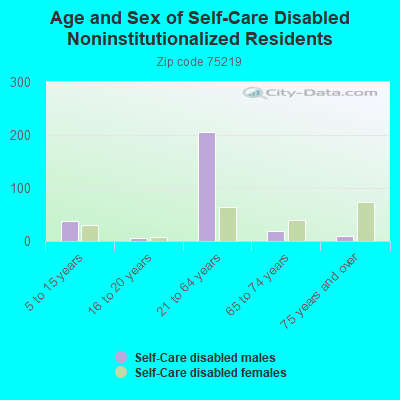
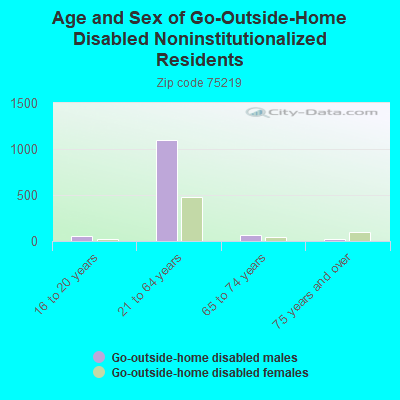
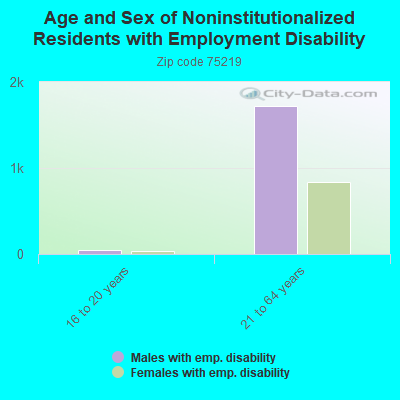
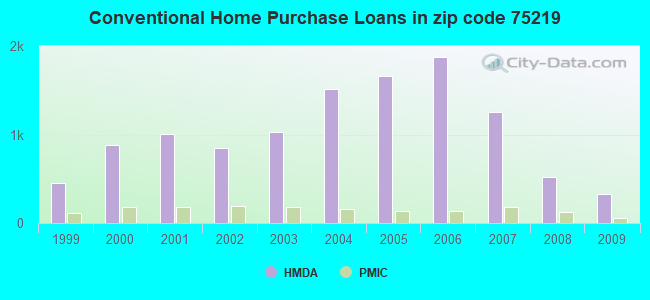
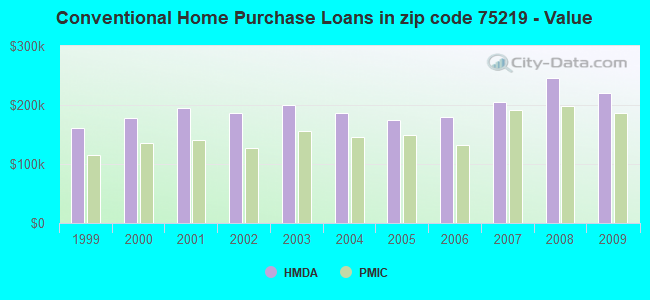
 Based on the data from the years 2002 - 2018 the average number of fire incidents per year is 40. The highest number of fires - 121 took place in 2002, and the least - 0 in 2008. The data has a decreasing trend.
 When looking into fire subcategories, the most reports belonged to: Outside Fires (48.3%), and Other (19.0%).