Estimated zip code population in 2022: 27,215 Zip code population in 2010: 26,934 Zip code population in 2000: 27,631
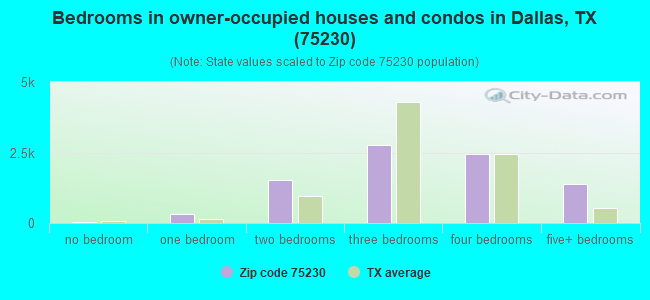
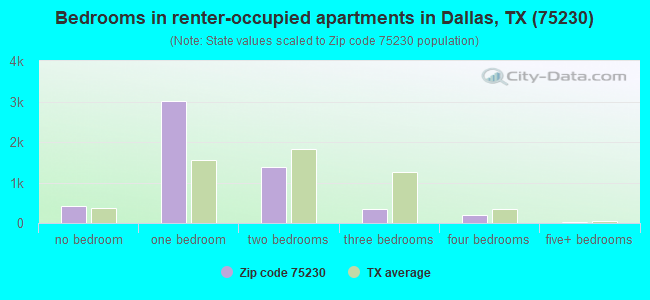
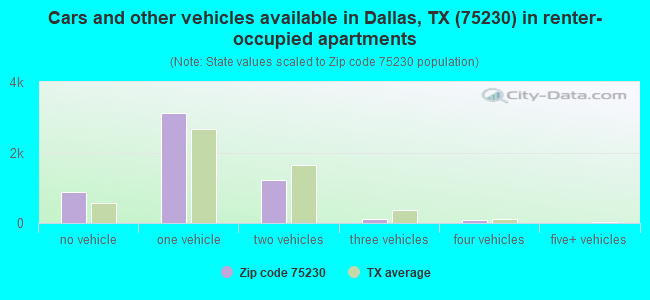
Houses and condos: 15,217 Renter-occupied apartments: 5,367
% of renters here:
39%
State:
38%
March 2022 cost of living index in zip code 75230: 99.7 (near average, U.S. average is 100)
Land area: 7.2 sq. mi. Water area: 0.0 sq. mi.
Population density: 3,756 people per square mile
(average).
OSM Map
General Map
Google Map
MSN Map
OSM Map
General Map
Google Map
MSN Map
OSM Map
General Map
Google Map
MSN Map
OSM Map
General Map
Google Map
MSN Map
Please wait while loading the map...
Real estate property taxes paid for housing units in 2022:
This zip code:
1.1% ($10,460)
Texas:
1.5% ($4,050)
Median real estate property taxes paid for housing units with mortgages in 2022: $10,505 (1.1%) Median real estate property taxes paid for housing units with no mortgage in 2022: $10,700 (1.2%)
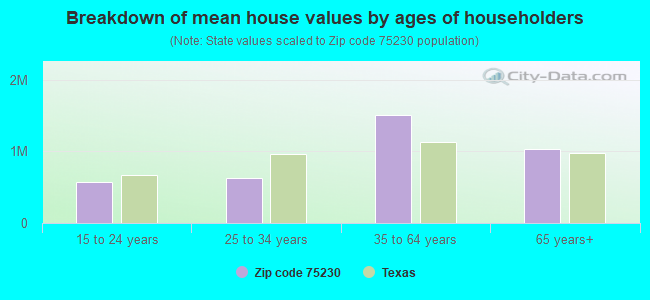
Estimated median house/condo value in 2022: $916,573
75230:
$916,573
Texas:
$275,400
According to our research of Texas and other state lists, there were 18 registered sex offenders living in 75230 zip code as of April 26, 2024. The ratio of all residents to sex offenders in zip code 75230 is 1,530 to 1. The ratio of registered sex offenders to all residents in this zip code is much lower than the state average.
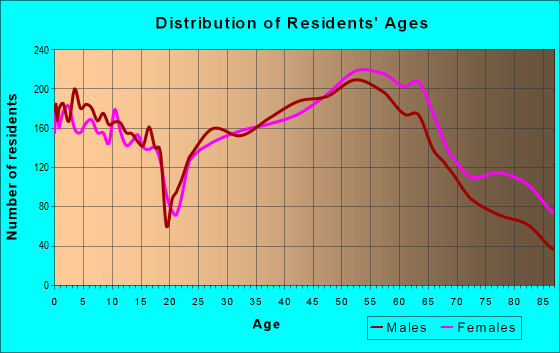
Median resident age:
This zip code:
48.1 years
Texas median age:
35.6 years
Average household size:
This zip code:
2.0 people
Texas:
2.6 people
Averages for the 2020 tax year for zip code 75230, filed in 2021:
Average Adjusted Gross Income (AGI) in 2020: $386,605 (Individual Income Tax Returns)
Here:
$386,605
State:
$77,054
Salary/wage: $201,340 (reported on 73.2% of returns)
Here:
$201,340
State:
$62,766
(% of AGI for various income ranges: 1236.5% for AGIs below $25k, 3793.6% for AGIs $25k-50k, 6775.1% for AGIs $50k-75k, 9670.2% for AGIs $75k-100k, 17967.8% for AGIs $100k-200k, 197540.1% for AGIs over 200k)
Taxable interest for individuals: $13,234 (reported on 51.5% of returns)
This zip code:
$13,234
Texas:
$2,665
(% of AGI for various income ranges: 54.1% for AGIs below $25k, 68.2% for AGIs $25k-50k, 126.0% for AGIs $50k-75k, 307.8% for AGIs $75k-100k, 637.4% for AGIs $100k-200k, 9844.9% for AGIs over 200k)
Ordinary dividends: $33,035 (reported on 49.0% of returns)
Here:
$33,035
State:
$10,044
(% of AGI for various income ranges: 152.1% for AGIs below $25k, 200.4% for AGIs $25k-50k, 544.3% for AGIs $50k-75k, 1007.6% for AGIs $75k-100k, 2663.3% for AGIs $100k-200k, 21728.5% for AGIs over 200k)
Net capital gain/loss in AGI: +$140,974 (reported on 48.0% of returns)
Here:
+$140,974
State:
+$39,590
(% of AGI for various income ranges: 119.7% for AGIs below $25k, 123.4% for AGIs $25k-50k, 268.0% for AGIs $50k-75k, 892.4% for AGIs $75k-100k, 2305.4% for AGIs $100k-200k, 106084.3% for AGIs over 200k)
Profit/loss from business: +$50,864 (reported on 25.7% of returns)
Here:
+$50,864
State:
+$10,888
(% of AGI for various income ranges: 165.1% for AGIs below $25k, 241.0% for AGIs $25k-50k, 451.2% for AGIs $50k-75k, 911.6% for AGIs $75k-100k, 1889.6% for AGIs $100k-200k, 17504.9% for AGIs over 200k)
Taxable individual retirement arrangement distribution: $49,292 (reported on 13.2% of returns)
75230:
$49,292
Texas:
$24,740
(% of AGI for various income ranges: 92.2% for AGIs below $25k, 124.7% for AGIs $25k-50k, 288.4% for AGIs $50k-75k, 778.8% for AGIs $75k-100k, 2311.7% for AGIs $100k-200k, 7093.6% for AGIs over 200k)
Self-employed (Keogh) retirement plans: $43,594 (reported on 3.9% of returns)
75230:
$43,594
Texas:
$29,298
(% of AGI for various income ranges: 37.8% for AGIs $50k-75k, 132.9% for AGIs $100k-200k, 2582.1% for AGIs over 200k)
Total itemized deductions: $62,956 (reported on 27.4% of returns)
Here:
$62,956
State:
$40,428
(% of AGI for various income ranges: 180.3% for AGIs below $25k, 246.3% for AGIs $25k-50k, 506.6% for AGIs $50k-75k, 1346.4% for AGIs $75k-100k, 3032.1% for AGIs $100k-200k, 22761.9% for AGIs over 200k)
Charity contributions: $32,000 (reported on 24.5% of returns)
Here:
$32,000
State:
$18,201
(% of AGI for various income ranges: 15.1% for AGIs below $25k, 29.9% for AGIs $25k-50k, 94.6% for AGIs $50k-75k, 221.2% for AGIs $75k-100k, 816.3% for AGIs $100k-200k, 11589.4% for AGIs over 200k)
Taxes paid: $9,138 (reported on 27.2% of returns)
75230:
$9,138
State:
$7,821
(% of AGI for various income ranges: 36.1% for AGIs below $25k, 48.4% for AGIs $25k-50k, 117.6% for AGIs $50k-75k, 296.8% for AGIs $75k-100k, 700.8% for AGIs $100k-200k, 2879.5% for AGIs over 200k)
Earned income credit: $1,886 (reported on 7.0% of returns)
Here:
$1,886
State:
$2,584
(% of AGI for various income ranges: 67.1% for AGIs below $25k, 32.2% for AGIs $25k-50k)
Percentage of individuals using paid preparers for their 2020 taxes: 91.5%
Here:
91%
State:
92%
(% for various income ranges: 89.2% for AGIs below $25k, 91.6% for AGIs $25k-50k, 92.3% for AGIs $50k-75k, 92.5% for AGIs $75k-100k, 91.1% for AGIs $100k-200k, 92.9% for AGIs over 200k)
Averages for the 2012 tax year for zip code 75230, filed in 2013:
Average Adjusted Gross Income (AGI) in 2012: $261,759 (Individual Income Tax Returns)
Here:
$261,759
State:
$65,384
Salary/wage: $154,066 (reported on 74.2% of returns)
Here:
$154,066
State:
$52,524
(% of AGI for various income ranges: 69.5% for AGIs below $25k, 75.7% for AGIs $25k-50k, 62.3% for AGIs $50k-75k, 60.1% for AGIs $75k-100k, 56.0% for AGIs $100k-200k, 40.5% for AGIs over 200k)
Taxable interest for individuals: $12,400 (reported on 49.9% of returns)
This zip code:
$12,400
Texas:
$2,372
(% of AGI for various income ranges: 2.5% for AGIs below $25k, 1.5% for AGIs $25k-50k, 2.2% for AGIs $50k-75k, 2.7% for AGIs $75k-100k, 2.2% for AGIs $100k-200k, 2.4% for AGIs over 200k)
Ordinary dividends: $28,103 (reported on 44.6% of returns)
Here:
$28,103
State:
$9,721
(% of AGI for various income ranges: 6.4% for AGIs below $25k, 3.5% for AGIs $25k-50k, 5.4% for AGIs $50k-75k, 5.6% for AGIs $75k-100k, 6.0% for AGIs $100k-200k, 4.7% for AGIs over 200k)
Net capital gain/loss in AGI: +$113,013 (reported on 42.1% of returns)
Here:
+$113,013
State:
+$35,319
(% of AGI for various income ranges: 0.2% for AGIs below $25k, 0.3% for AGIs $25k-50k, 1.3% for AGIs $50k-75k, 2.9% for AGIs $75k-100k, 3.7% for AGIs $100k-200k, 21.0% for AGIs over 200k)
Profit/loss from business: +$48,097 (reported on 24.7% of returns)
Here:
+$48,097
State:
+$13,732
(% of AGI for various income ranges: 10.8% for AGIs below $25k, 5.1% for AGIs $25k-50k, 6.9% for AGIs $50k-75k, 6.7% for AGIs $75k-100k, 8.8% for AGIs $100k-200k, 4.0% for AGIs over 200k)
Taxable individual retirement arrangement distribution: $47,323 (reported on 16.2% of returns)
75230:
$47,323
Texas:
$19,511
(% of AGI for various income ranges: 4.1% for AGIs below $25k, 3.4% for AGIs $25k-50k, 5.3% for AGIs $50k-75k, 6.6% for AGIs $75k-100k, 6.9% for AGIs $100k-200k, 2.4% for AGIs over 200k)
Self-employment retirement plans: $35,248 (reported on 3.9% of returns)
75230:
$35,248
Texas:
$23,938
(% of AGI for various income ranges: 0.5% for AGIs $50k-75k, 0.4% for AGIs $75k-100k, 0.7% for AGIs $100k-200k, 0.5% for AGIs over 200k)
Total itemized deductions: $64,341 (12% of AGI, reported on 46.7% of returns)
Here:
$64,341
State:
$24,724
Here:
12.4% of AGI
State:
15.9% of AGI
(% of AGI for various income ranges: 17.8% for AGIs below $25k, 13.0% for AGIs $25k-50k, 17.2% for AGIs $50k-75k, 17.1% for AGIs $75k-100k, 18.3% for AGIs $100k-200k, 10.5% for AGIs over 200k)
Charity contributions: $21,887 (reported on 41.5% of returns)
Here:
$21,887
State:
$6,808
(% of AGI for various income ranges: 1.3% for AGIs below $25k, 1.3% for AGIs $25k-50k, 2.3% for AGIs $50k-75k, 2.5% for AGIs $75k-100k, 3.3% for AGIs $100k-200k, 3.6% for AGIs over 200k)
Taxes paid: $20,357 (reported on 46.0% of returns)
75230:
$20,357
State:
$6,921
(% of AGI for various income ranges: 4.9% for AGIs below $25k, 3.4% for AGIs $25k-50k, 5.0% for AGIs $50k-75k, 5.7% for AGIs $75k-100k, 6.4% for AGIs $100k-200k, 3.3% for AGIs over 200k)
Earned income credit: $2,022 (reported on 9.4% of returns)
Here:
$2,022
State:
$2,570
(% of AGI for various income ranges: 4.2% for AGIs below $25k, 0.5% for AGIs $25k-50k)
Percentage of individuals using paid preparers for their 2012 taxes: 63.7%
Here:
64%
State:
51%
(% for various income ranges: 57.4% for AGIs below $25k, 54.1% for AGIs $25k-50k, 58.8% for AGIs $50k-75k, 59.0% for AGIs $75k-100k, 68.8% for AGIs $100k-200k, 80.9% for AGIs over 200k)
Averages for the 2004 tax year for zip code 75230, filed in 2005:
Average Adjusted Gross Income (AGI) in 2004: $156,857 (Individual Income Tax Returns)
Here:
$156,857
State:
$47,881
Salary/wage: $115,762 (reported on 71.6% of returns)
Here:
$115,762
State:
$41,947
(% of AGI for various income ranges: 70.5% for AGIs $10k-25k, 72.6% for AGIs $25k-50k, 58.0% for AGIs $50k-75k, 52.7% for AGIs $75k-100k, 48.9% for AGIs over 100k)
Taxable interest for individuals: $7,658 (reported on 60.6% of returns)
This zip code:
$7,658
Texas:
$2,255
(% of AGI for various income ranges: 5.6% for AGIs $10k-25k, 3.9% for AGIs $25k-50k, 5.0% for AGIs $50k-75k, 6.0% for AGIs $75k-100k, 2.4% for AGIs over 100k)
Taxable dividends: $13,936 (reported on 51.5% of returns)
Here:
$13,936
State:
$4,261
(% of AGI for various income ranges: 5.0% for AGIs $10k-25k, 4.1% for AGIs $25k-50k, 5.3% for AGIs $50k-75k, 6.7% for AGIs $75k-100k, 4.1% for AGIs over 100k)
Net capital gain/loss: +$48,541 (reported on 48.6% of returns)
Here:
+$48,541
State:
+$16,110
(% of AGI for various income ranges: 0.5% for AGIs $10k-25k, 1.3% for AGIs $25k-50k, 2.5% for AGIs $50k-75k, 4.5% for AGIs $75k-100k, 16.2% for AGIs over 100k)
Profit/loss from business: +$35,188 (reported on 23.8% of returns)
Here:
+$35,188
State:
+$11,013
(% of AGI for various income ranges: 5.1% for AGIs $10k-25k, 4.7% for AGIs $25k-50k, 7.8% for AGIs $50k-75k, 7.4% for AGIs $75k-100k, 5.1% for AGIs over 100k)
IRA payment deduction: $3,600 (reported on 2.9% of returns)
75230:
$3,600
Texas:
$3,120
(% of AGI for various income ranges: 0.3% for AGIs $10k-25k, 0.2% for AGIs $25k-50k, 0.2% for AGIs $50k-75k, 0.2% for AGIs $75k-100k, 0.0% for AGIs over 100k)
Self-employed pension: $21,992 (reported on 4.5% of returns)
Here:
$21,992
Texas:
$16,401
(% of AGI for various income ranges: 0.2% for AGIs $25k-50k, 0.4% for AGIs $50k-75k, 0.6% for AGIs $75k-100k, 0.7% for AGIs over 100k)
Total itemized deductions: $37,946 (13% of AGI, reported on 46.5% of returns)
Here:
$37,946
State:
$19,631
Here:
12.9% of AGI
State:
18.9% of AGI
(% of AGI for various income ranges: 17.8% for AGIs $10k-25k, 16.7% for AGIs $25k-50k, 19.3% for AGIs $50k-75k, 23.1% for AGIs $75k-100k, 9.6% for AGIs over 100k)
Charity contributions deductions: $12,175 (4% of AGI, reported on 41.8% of returns)
Here:
$12,175
State:
$4,753
Here:
4.1% of AGI
State:
4.2% of AGI
(% of AGI for various income ranges: 1.7% for AGIs $10k-25k, 2.0% for AGIs $25k-50k, 3.0% for AGIs $50k-75k, 3.8% for AGIs $75k-100k, 3.2% for AGIs over 100k)
Total tax: $44,245 (reported on 79.0% of returns)
75230:
$44,245
State:
$9,058
(% of AGI for various income ranges: 4.6% for AGIs $10k-25k, 8.3% for AGIs $25k-50k, 11.7% for AGIs $50k-75k, 12.7% for AGIs $75k-100k, 23.3% for AGIs over 100k)
Earned income credit: $1,604 (reported on 8.2% of returns)
Here:
$1,604
State:
$2,024
Percentage of individuals using paid preparers for their 2004 taxes: 67.9%
Here:
68%
State:
57%
(% for various income ranges: 63.9% for AGIs below $10k, 65.7% for AGIs $10k-25k, 59.2% for AGIs $25k-50k, 66.5% for AGIs $50k-75k, 65.7% for AGIs $75k-100k, 78.2% for AGIs over 100k)
Likely homosexual households (counted as self-reported same-sex unmarried-partner households)
Lesbian couples: 0.4% of all households
Gay men: 0.4% of all households
Household received Food Stamps/SNAP in the past 12 months: 426 Household did not receive Food Stamps/SNAP in the past 12 months: 13,327
Women who had a birth in the past 12 months: 437 (363 now married, 77 unmarried) Women who did not have a birth in the past 12 months: 5,454 (2,360 now married, 3,094 unmarried)
Housing units in zip code 75230 with a mortgage: 4,694 (365 second mortgage, 44 home equity loan, 199 both second mortgage and home equity loan) Houses without a mortgage: 63
Median monthly owner costs for units with a mortgage: $3,982 Median monthly owner costs for units without a mortgage: $1,537
Residents with income below the poverty level in 2022:
This zip code:
5.0%
Whole state:
14.0%
Residents with income below 50% of the poverty level in 2022:
This zip code:
2.9%
Whole state:
7.4%
Median number of rooms in houses and condos:
Here:
7.9
State:
6.3
Median number of rooms in apartments:
Here:
3.1
State:
4.0
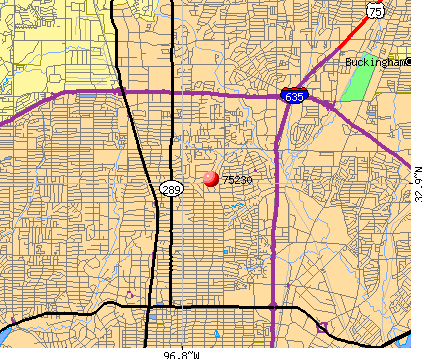
Notable locations in this zip code not listed on our city pages
Notable locations in zip code 75230: Preston Hollow Country Club (A), Spencer Gymnasium (B), Dallas Fire - Rescue Station 20 (C), Dallas Fire - Rescue Station 41 (D), Dallas Memorial Center for Holocaust Studies (E). Display/hide their locations on the map
Churches in zip code 75230 include: Believers Chapel Tape Ministry Church (A), Young NAK Presbyterian Church (B), Royal Lane Baptist Church (C), Saint Rita Catholic Church (D), Trinity Episcopal Church (E), Saint Lukes Episcopal Church (F), Dallas Texas Temple (G), Preston Hollow Presbyterian Church (H), King of Glory Church (I). Display/hide their locations on the map
Parks in zip code 75230 include: Jamestown Park (1), Franklin Stadium (2), Arthur P Ruff Field (3), Bailey Field (4), Dealey Park (5), Churchill Park (6), Anderson Bonner Park (7). Display/hide their locations on the map
Tourist attraction (not listed on the city page) : EquiSource Capital- L.L.P. (Cultural Attractions- Events- & Facilities; 9800 Preston Road).
3,703 married couples with children.
436 single-parent households (123 men, 313 women).
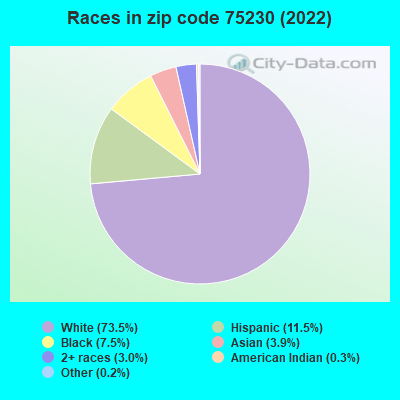
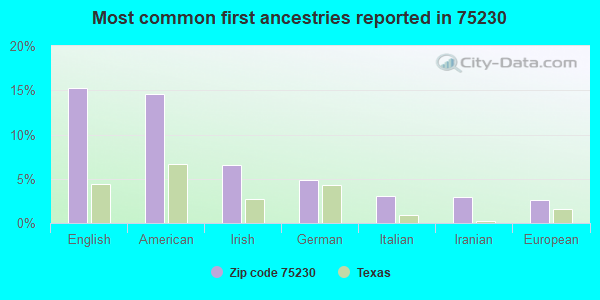
83.3% of residents of 75230 zip code speak English at home.
8.6% of residents speak Spanish at home (80% very well, 13% well, 3% not well, 4% not at all).
5.3% of residents speak other Indo-European language at home (82% very well, 13% well, 5% not well).
1.7% of residents speak Asian or Pacific Island language at home (66% very well, 20% well, 6% not well, 8% not at all).
1.9% of residents speak other language at home (92% very well, 8% not well).
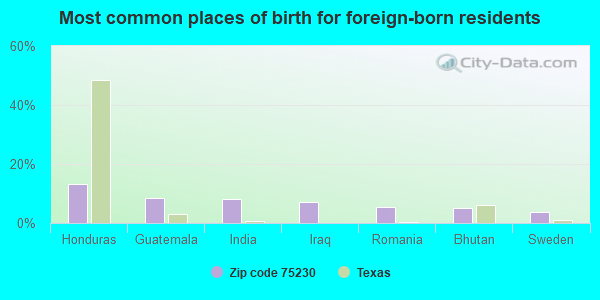
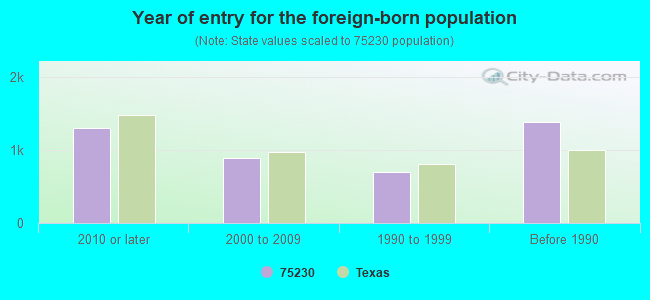
Foreign born population: 3,564 (13.1%) (64.1% of them are naturalized citizens)
Facilities with environmental interests located in this zip code:
ARTHUR KRAMER EL (7131 MIDBURY DR in DALLAS, TX)
(National Center for Education Statistics) - STATE ID-057905169 Organizations: DALLAS ISD (SCHOOL DISTRICT)
AKIBA ACADEMY OF DALLAS (6210 CHURCHILL WAY in DALLAS, TX)
COMPLIANCE ACTIVITY (Tracking inspections of insecticide, fungicide, and rodenticide, and toxic substances) Business SIC classification: ELEMENTARY AND SECONDARY SCHOOLS
Housing units lacking complete plumbing facilities: 0.7% Housing units lacking complete kitchen facilities: 2.6%
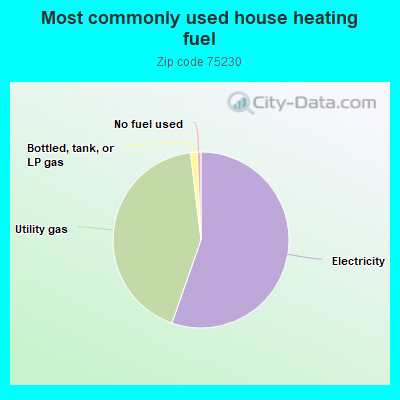
55.2%Electricity
42.6%Utility gas
1.2%Bottled, tank, or LP gas
0.7%No fuel used
Population in 1990: 24,281. Population change in the 1990s: +3,350 (+13.8%).
Place of birth for U.S.-born residents:
This state: 12,898
Northeast: 1,678
Midwest: 3,425
South: 3,522
West: 1,436
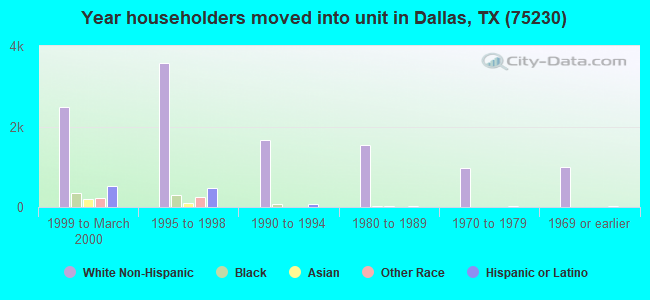
47% of the 75230 zip code residents lived in the same house 5 years ago. Out of people who lived in different houses, 64% lived in this county. Out of people who lived in different counties, 50% lived in Texas.
83% of the 75230 zip code residents lived in the same house 1 year ago. Out of people who lived in different houses, 58% moved from this county. Out of people who lived in different houses, 20% moved from different county within same state. Out of people who lived in different houses, 15% moved from different state. Out of people who lived in different houses, 5% moved from abroad.
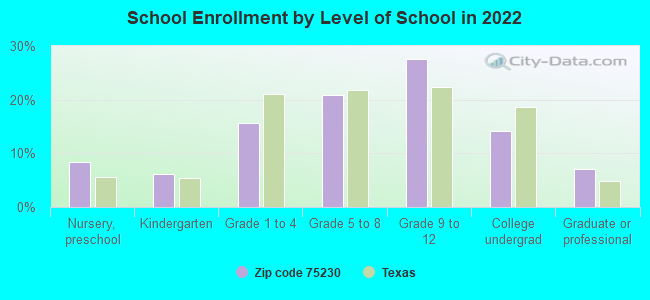
Private vs. public school enrollment:
Students in private schools in grades 1 to 8 (elementary and middle school): 1,189
Here:
66.7%
Texas:
8.8%
Students in private schools in grades 9 to 12 (high school): 799
Here:
59.9%
Texas:
8.0%
Students in private undergraduate colleges: 460
Here:
68.8%
Texas:
16.2%
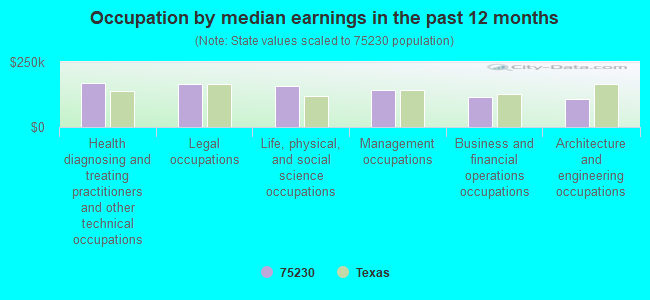
Occupation by median earnings in the past 12 months ($)
168,606Health diagnosing and treating practitioners and other technical occupations
166,206Legal occupations
155,412Life, physical, and social science occupations
142,615Management occupations
115,249Business and financial operations occupations
107,691Architecture and engineering occupations
Companies with federal contracts located in this zip code (DALLAS, TX):
C-CON, INC (3 CAPE COURT; small business) : $834,209 in 13 contractsfrom 1999 to 2006
Contracts for Maintenance, Repair and Rebuilding of Equipment -- Engines, Turbines, and Components, Relocation Services, Other Quality Control, Testing and Inspection Services -- Measuring Tools, Maintenance, Repair and Rebuilding of Equipment -- Instruments and Laboratory Equipment, and moreby Air Force, Army Signed by year:2000: $201,614; 2001: $147,520; 2002: $132,218; 2003: $88,690; 2004: $89,560; 2005: $89,560; 2006: $16,995.
Biggest contracts:
$147,520 with Air Force for Maintenance, Repair and Rebuilding of Equipment -- Engines, Turbines, and Components. Signed on 2001-06-12. Completion date: 2002-06-01.
$132,326 with Air Force for Relocation Services. Signed on 2000-04-07. Completion date: 2000-08-30.
$89,560 with Air Force for Other Quality Control, Testing and Inspection Services -- Measuring Tools. Taking place in UT. Signed on 2004-10-19. Completion date: 2005-08-31.
$89,560 with Air Force for Maintenance, Repair and Rebuilding of Equipment -- Instruments and Laboratory Equipment. Taking place in UT. Signed on 2005-08-24. Completion date: 2006-08-31.
BROOKHOLLOW HOLDINGS LP (10600 STEPPINGTON DR STE 2; small business) : $119,879 in 2 contractsin 2003
$82,245 with Army for Lease or Rental of Facilities -- Troop Housing Facilities. Signed on 2003-06-09. Completion date: 2003-05-19.
$37,634, same as above.Signed on 2003-07-02. Completion date: 2003-07-16.
SKIN IMAGING CENTERS OF AMERIC (5925 FOREST LN; small business)
$35,000 with Army for Medical and Surgical Instruments, Equipment, and Supplies. Signed on 2000-09-30. Completion date: 2000-11-30.
CONSTRUCTIVE BUSINESS SYSTEMS, (5310 HARVEST HILL ROAD; small business) : $15,348 in 2 contractsfrom 2005 to 2006
$10,668 with Air Force for ADP Software. Signed on 2006-05-04. Completion date: 2006-05-19.
$4,680, same as above.Signed on 2005-06-13. Completion date: 2005-07-15.
JCOM (5952 ROYAL LANE, SUITE 155; small business)
$3,214 with Air Force for Electrical and Electronic assemblies, Boards, Cards, and Associated Hardware. Signed on 2005-06-20. Completion date: 2005-10-21.
SUPPLY OUTFITTERS, LLC (6307 PRESTONCREST LANE; small business)
$2,999 with Army for Kitchen Equipment and Appliances. Signed on 2004-09-28. Completion date: 2004-11-30.
Top industries in this zip code by the number of employees in 2005:
Health Care and Social Assistance: Offices of Physicians (except Mental Health Specialists) (100-249 employees: 1 establishment, 50-99 employees: 3 establishments, 20-49 employees: 13 establishments, 10-19 employees: 23 establishments, 5-9 employees: 43 establishments, 1-4 employees: 120 establishments)
Health Care and Social Assistance: General Medical and Surgical Hospitals (over 1000: 1)
Other Services (except Public Administration): Religious Organizations (500-999: 1, 50-99: 2, 20-49: 4, 10-19: 5, 5-9: 1, 1-4: 7)
2002 - 2018 National Fire Incident Reporting System (NFIRS) incidents
Based on the data from the years 2002 - 2018 the average number of fires per year is 30. The highest number of fire incidents - 75 took place in 2003, and the least - 0 in 2008. The data has a declining trend.
When looking into fire subcategories, the most incidents belonged to: Outside Fires (41.2%), and Structure Fires (22.2%).
Fire incident types reported to NFIRS in Zip Code 75230
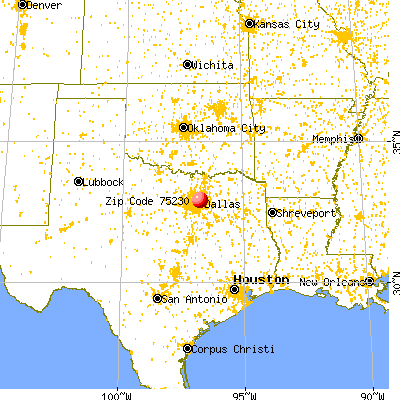


 Nearest zip codes: 75251, 75240, 75225, 75254, 75244, 75231.
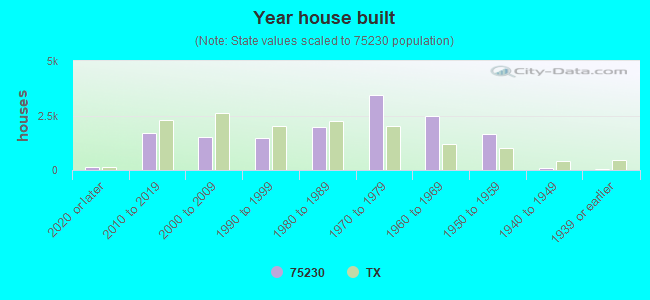


 Based on the data from the years 2002 - 2018 the average number of fires per year is 30. The highest number of fire incidents - 75 took place in 2003, and the least - 0 in 2008. The data has a declining trend.
 When looking into fire subcategories, the most incidents belonged to: Outside Fires (41.2%), and Structure Fires (22.2%).