Estimated zip code population in 2022: 13,076 Zip code population in 2010: 13,266 Zip code population in 2000: 17,487
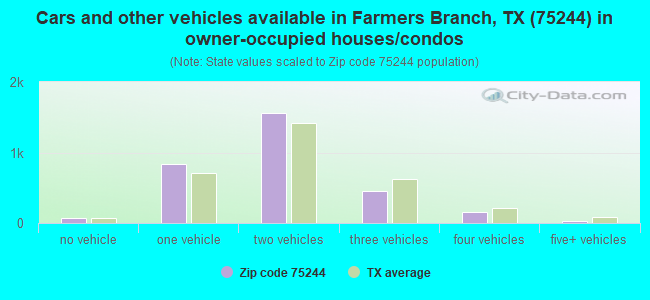
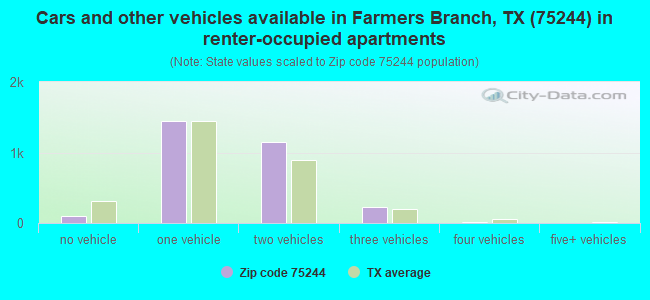
Houses and condos: 6,681 Renter-occupied apartments: 2,939
% of renters here:
49%
State:
38%
March 2022 cost of living index in zip code 75244: 98.1 (near average, U.S. average is 100)
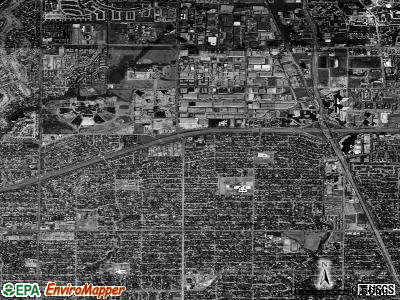
Land area: 4.6 sq. mi. Water area: 0.0 sq. mi.
Population density: 2,836 people per square mile
(average).
OSM Map
General Map
Google Map
MSN Map
OSM Map
General Map
Google Map
MSN Map
OSM Map
General Map
Google Map
MSN Map
OSM Map
General Map
Google Map
MSN Map
Please wait while loading the map...
Real estate property taxes paid for housing units in 2022:
This zip code:
1.6% ($9,712)
Texas:
1.5% ($4,050)
Median real estate property taxes paid for housing units with mortgages in 2022: $10,505 (1.5%) Median real estate property taxes paid for housing units with no mortgage in 2022: $7,455 (1.5%)
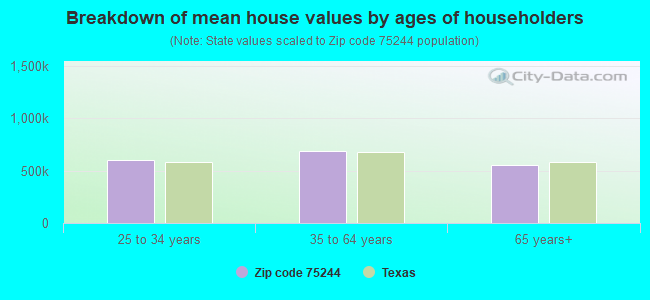
Estimated median house/condo value in 2022: $610,740
75244:
$610,740
Texas:
$275,400
According to our research of Texas and other state lists, there were 2 registered sex offenders living in 75244 zip code as of April 27, 2024. The ratio of all residents to sex offenders in zip code 75244 is 6,658 to 1. The ratio of registered sex offenders to all residents in this zip code is much lower than the state average.
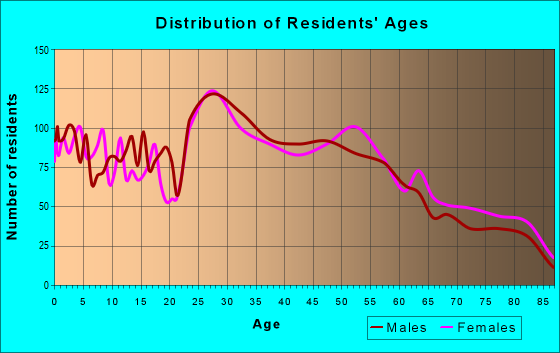
Median resident age:
This zip code:
38.2 years
Texas median age:
35.6 years
Average household size:
This zip code:
2.2 people
Texas:
2.6 people
Averages for the 2020 tax year for zip code 75244, filed in 2021:
Average Adjusted Gross Income (AGI) in 2020: $132,326 (Individual Income Tax Returns)
Here:
$132,326
State:
$77,054
Salary/wage: $108,388 (reported on 80.9% of returns)
Here:
$108,388
State:
$62,766
(% of AGI for various income ranges: 1203.0% for AGIs below $25k, 3695.1% for AGIs $25k-50k, 6874.0% for AGIs $50k-75k, 10463.5% for AGIs $75k-100k, 20026.8% for AGIs $100k-200k, 106354.5% for AGIs over 200k)
Taxable interest for individuals: $4,507 (reported on 36.7% of returns)
This zip code:
$4,507
Texas:
$2,665
(% of AGI for various income ranges: 19.8% for AGIs below $25k, 29.0% for AGIs $25k-50k, 52.2% for AGIs $50k-75k, 79.1% for AGIs $75k-100k, 261.2% for AGIs $100k-200k, 2696.4% for AGIs over 200k)
Ordinary dividends: $12,716 (reported on 33.9% of returns)
Here:
$12,716
State:
$10,044
(% of AGI for various income ranges: 79.5% for AGIs below $25k, 92.8% for AGIs $25k-50k, 175.5% for AGIs $50k-75k, 271.5% for AGIs $75k-100k, 880.7% for AGIs $100k-200k, 6333.9% for AGIs over 200k)
Net capital gain/loss in AGI: +$33,119 (reported on 33.3% of returns)
Here:
+$33,119
State:
+$39,590
(% of AGI for various income ranges: 14.3% for AGIs below $25k, 54.6% for AGIs $25k-50k, 169.4% for AGIs $50k-75k, 328.9% for AGIs $75k-100k, 1170.0% for AGIs $100k-200k, 20521.5% for AGIs over 200k)
Profit/loss from business: +$22,792 (reported on 23.9% of returns)
Here:
+$22,792
State:
+$10,888
(% of AGI for various income ranges: 170.5% for AGIs below $25k, 215.7% for AGIs $25k-50k, 315.9% for AGIs $50k-75k, 292.0% for AGIs $75k-100k, 1053.1% for AGIs $100k-200k, 7413.9% for AGIs over 200k)
Taxable individual retirement arrangement distribution: $29,452 (reported on 9.7% of returns)
75244:
$29,452
Texas:
$24,740
(% of AGI for various income ranges: 61.8% for AGIs below $25k, 105.3% for AGIs $25k-50k, 212.6% for AGIs $50k-75k, 407.8% for AGIs $75k-100k, 959.5% for AGIs $100k-200k, 2846.7% for AGIs over 200k)
Self-employed (Keogh) retirement plans: $29,150 (reported on 1.7% of returns)
75244:
$29,150
Texas:
$29,298
(% of AGI for various income ranges: 107.4% for AGIs $75k-100k, 910.3% for AGIs over 200k)
Total itemized deductions: $37,277 (reported on 17.5% of returns)
Here:
$37,277
State:
$40,428
(% of AGI for various income ranges: 77.1% for AGIs below $25k, 167.9% for AGIs $25k-50k, 377.2% for AGIs $50k-75k, 641.1% for AGIs $75k-100k, 1536.6% for AGIs $100k-200k, 8709.1% for AGIs over 200k)
Charity contributions: $12,859 (reported on 15.1% of returns)
Here:
$12,859
State:
$18,201
(% of AGI for various income ranges: 6.5% for AGIs below $25k, 32.4% for AGIs $25k-50k, 60.1% for AGIs $50k-75k, 113.9% for AGIs $75k-100k, 291.2% for AGIs $100k-200k, 3227.9% for AGIs over 200k)
Taxes paid: $8,693 (reported on 17.4% of returns)
75244:
$8,693
State:
$7,821
(% of AGI for various income ranges: 20.0% for AGIs below $25k, 39.2% for AGIs $25k-50k, 91.4% for AGIs $50k-75k, 185.4% for AGIs $75k-100k, 416.9% for AGIs $100k-200k, 1834.5% for AGIs over 200k)
Earned income credit: $1,902 (reported on 8.6% of returns)
Here:
$1,902
State:
$2,584
(% of AGI for various income ranges: 68.7% for AGIs below $25k, 40.4% for AGIs $25k-50k)
Percentage of individuals using paid preparers for their 2020 taxes: 91.5%
Here:
92%
State:
92%
(% for various income ranges: 87.8% for AGIs below $25k, 93.0% for AGIs $25k-50k, 92.9% for AGIs $50k-75k, 93.0% for AGIs $75k-100k, 90.5% for AGIs $100k-200k, 94.0% for AGIs over 200k)
Averages for the 2012 tax year for zip code 75244, filed in 2013:
Average Adjusted Gross Income (AGI) in 2012: $97,030 (Individual Income Tax Returns)
Here:
$97,030
State:
$65,384
Salary/wage: $76,921 (reported on 81.3% of returns)
Here:
$76,921
State:
$52,524
(% of AGI for various income ranges: 74.0% for AGIs below $25k, 79.5% for AGIs $25k-50k, 79.0% for AGIs $50k-75k, 73.5% for AGIs $75k-100k, 72.6% for AGIs $100k-200k, 52.6% for AGIs over 200k)
Taxable interest for individuals: $2,891 (reported on 38.0% of returns)
This zip code:
$2,891
Texas:
$2,372
(% of AGI for various income ranges: 1.4% for AGIs below $25k, 0.7% for AGIs $25k-50k, 1.0% for AGIs $50k-75k, 1.0% for AGIs $75k-100k, 1.2% for AGIs $100k-200k, 1.2% for AGIs over 200k)
Ordinary dividends: $9,109 (reported on 30.8% of returns)
Here:
$9,109
State:
$9,721
(% of AGI for various income ranges: 3.6% for AGIs below $25k, 2.2% for AGIs $25k-50k, 2.4% for AGIs $50k-75k, 2.9% for AGIs $75k-100k, 3.1% for AGIs $100k-200k, 3.0% for AGIs over 200k)
Net capital gain/loss in AGI: +$27,767 (reported on 27.8% of returns)
Here:
+$27,767
State:
+$35,319
(% of AGI for various income ranges: 0.3% for AGIs below $25k, 0.1% for AGIs $25k-50k, 0.6% for AGIs $50k-75k, 1.0% for AGIs $75k-100k, 1.3% for AGIs $100k-200k, 15.9% for AGIs over 200k)
Profit/loss from business: +$23,084 (reported on 22.1% of returns)
Here:
+$23,084
State:
+$13,732
(% of AGI for various income ranges: 12.7% for AGIs below $25k, 5.1% for AGIs $25k-50k, 4.0% for AGIs $50k-75k, 4.2% for AGIs $75k-100k, 5.9% for AGIs $100k-200k, 4.9% for AGIs over 200k)
Taxable individual retirement arrangement distribution: $23,510 (reported on 13.1% of returns)
75244:
$23,510
Texas:
$19,511
(% of AGI for various income ranges: 3.2% for AGIs below $25k, 2.7% for AGIs $25k-50k, 3.1% for AGIs $50k-75k, 4.3% for AGIs $75k-100k, 4.9% for AGIs $100k-200k, 2.2% for AGIs over 200k)
Self-employment retirement plans: $22,850 (reported on 2.1% of returns)
75244:
$22,850
Texas:
$23,938
(% of AGI for various income ranges: 0.4% for AGIs $25k-50k, 0.3% for AGIs $100k-200k, 0.8% for AGIs over 200k)
Total itemized deductions: $28,690 (16% of AGI, reported on 37.1% of returns)
Here:
$28,690
State:
$24,724
Here:
16.0% of AGI
State:
15.9% of AGI
(% of AGI for various income ranges: 13.0% for AGIs below $25k, 10.0% for AGIs $25k-50k, 10.6% for AGIs $50k-75k, 11.4% for AGIs $75k-100k, 13.3% for AGIs $100k-200k, 9.9% for AGIs over 200k)
Charity contributions: $5,703 (reported on 31.4% of returns)
Here:
$5,703
State:
$6,808
(% of AGI for various income ranges: 0.9% for AGIs below $25k, 1.1% for AGIs $25k-50k, 1.5% for AGIs $50k-75k, 1.5% for AGIs $75k-100k, 2.0% for AGIs $100k-200k, 2.1% for AGIs over 200k)
Taxes paid: $8,387 (reported on 36.7% of returns)
75244:
$8,387
State:
$6,921
(% of AGI for various income ranges: 2.8% for AGIs below $25k, 2.4% for AGIs $25k-50k, 2.8% for AGIs $50k-75k, 3.5% for AGIs $75k-100k, 4.4% for AGIs $100k-200k, 2.8% for AGIs over 200k)
Earned income credit: $2,119 (reported on 10.3% of returns)
Here:
$2,119
State:
$2,570
(% of AGI for various income ranges: 5.2% for AGIs below $25k, 0.5% for AGIs $25k-50k)
Percentage of individuals using paid preparers for their 2012 taxes: 52.1%
Here:
52%
State:
51%
(% for various income ranges: 52.4% for AGIs below $25k, 45.9% for AGIs $25k-50k, 44.1% for AGIs $50k-75k, 51.6% for AGIs $75k-100k, 56.9% for AGIs $100k-200k, 70.1% for AGIs over 200k)
Averages for the 2004 tax year for zip code 75244, filed in 2005:
Average Adjusted Gross Income (AGI) in 2004: $74,468 (Individual Income Tax Returns)
Here:
$74,468
State:
$47,881
Salary/wage: $64,419 (reported on 77.3% of returns)
Here:
$64,419
State:
$41,947
(% of AGI for various income ranges: 71.3% for AGIs $10k-25k, 75.4% for AGIs $25k-50k, 69.8% for AGIs $50k-75k, 67.3% for AGIs $75k-100k, 63.1% for AGIs over 100k)
Taxable interest for individuals: $3,738 (reported on 55.0% of returns)
This zip code:
$3,738
Texas:
$2,255
(% of AGI for various income ranges: 3.6% for AGIs $10k-25k, 2.8% for AGIs $25k-50k, 2.3% for AGIs $50k-75k, 2.9% for AGIs $75k-100k, 2.6% for AGIs over 100k)
Taxable dividends: $4,853 (reported on 41.2% of returns)
Here:
$4,853
State:
$4,261
(% of AGI for various income ranges: 3.3% for AGIs $10k-25k, 2.8% for AGIs $25k-50k, 3.1% for AGIs $50k-75k, 2.8% for AGIs $75k-100k, 2.4% for AGIs over 100k)
Net capital gain/loss: +$11,556 (reported on 36.9% of returns)
Here:
+$11,556
State:
+$16,110
(% of AGI for various income ranges: -0.5% for AGIs $10k-25k, 0.2% for AGIs $25k-50k, 0.9% for AGIs $50k-75k, 2.1% for AGIs $75k-100k, 8.5% for AGIs over 100k)
Profit/loss from business: +$19,180 (reported on 21.5% of returns)
Here:
+$19,180
State:
+$11,013
(% of AGI for various income ranges: 9.7% for AGIs $10k-25k, 4.0% for AGIs $25k-50k, 6.1% for AGIs $50k-75k, 2.2% for AGIs $75k-100k, 5.9% for AGIs over 100k)
IRA payment deduction: $3,586 (reported on 3.4% of returns)
75244:
$3,586
Texas:
$3,120
(% of AGI for various income ranges: 0.4% for AGIs $10k-25k, 0.3% for AGIs $25k-50k, 0.3% for AGIs $50k-75k, 0.2% for AGIs $75k-100k, 0.1% for AGIs over 100k)
Self-employed pension: $16,856 (reported on 2.8% of returns)
Here:
$16,856
Texas:
$16,401
(% of AGI for various income ranges: 0.3% for AGIs $10k-25k, 0.3% for AGIs $50k-75k, 0.4% for AGIs $75k-100k, 0.9% for AGIs over 100k)
Total itemized deductions: $22,858 (18% of AGI, reported on 40.9% of returns)
Here:
$22,858
State:
$19,631
Here:
18.2% of AGI
State:
18.9% of AGI
(% of AGI for various income ranges: 14.2% for AGIs $10k-25k, 14.7% for AGIs $25k-50k, 15.0% for AGIs $50k-75k, 15.8% for AGIs $75k-100k, 10.8% for AGIs over 100k)
Charity contributions deductions: $5,357 (4% of AGI, reported on 36.4% of returns)
Here:
$5,357
State:
$4,753
Here:
4.1% of AGI
State:
4.2% of AGI
(% of AGI for various income ranges: 1.3% for AGIs $10k-25k, 2.1% for AGIs $25k-50k, 2.3% for AGIs $50k-75k, 2.5% for AGIs $75k-100k, 2.8% for AGIs over 100k)
Total tax: $15,860 (reported on 79.6% of returns)
75244:
$15,860
State:
$9,058
(% of AGI for various income ranges: 4.7% for AGIs $10k-25k, 8.0% for AGIs $25k-50k, 11.6% for AGIs $50k-75k, 12.5% for AGIs $75k-100k, 20.8% for AGIs over 100k)
Earned income credit: $1,764 (reported on 9.3% of returns)
Here:
$1,764
State:
$2,024
Percentage of individuals using paid preparers for their 2004 taxes: 56.5%
Here:
56%
State:
57%
(% for various income ranges: 49.9% for AGIs below $10k, 59.9% for AGIs $10k-25k, 54.5% for AGIs $25k-50k, 55.4% for AGIs $50k-75k, 55.7% for AGIs $75k-100k, 61.3% for AGIs over 100k)
Likely homosexual households (counted as self-reported same-sex unmarried-partner households)
Lesbian couples: 0.3% of all households
Gay men: 1.0% of all households
Household received Food Stamps/SNAP in the past 12 months: 123 Household did not receive Food Stamps/SNAP in the past 12 months: 5,899
Women who had a birth in the past 12 months: 157 (135 now married, 22 unmarried) Women who did not have a birth in the past 12 months: 3,227 (1,525 now married, 1,698 unmarried)
Housing units in zip code 75244 with a mortgage: 1,894 (156 second mortgage, 126 both second mortgage and home equity loan) Median monthly owner costs for units with a mortgage: $2,942 Median monthly owner costs for units without a mortgage: $1,119
Residents with income below the poverty level in 2022:
This zip code:
4.5%
Whole state:
14.0%
Residents with income below 50% of the poverty level in 2022:
This zip code:
1.7%
Whole state:
7.4%
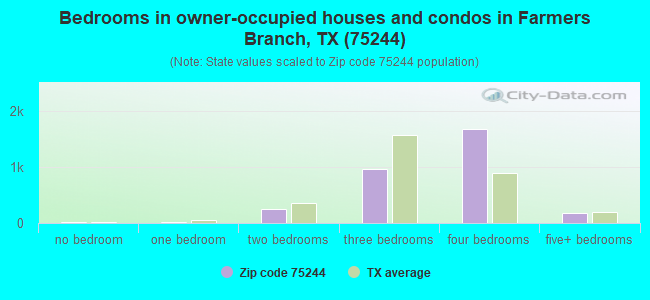
Median number of rooms in houses and condos:
Here:
7.3
State:
6.3
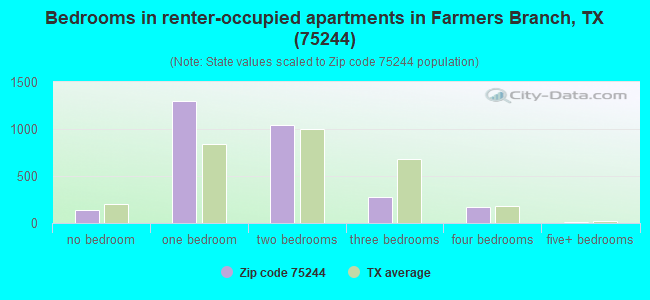
Median number of rooms in apartments:
Here:
3.4
State:
4.0
Notable locations in this zip code not listed on our city pages
Churches in zip code 75244 include: Schreiber Memorial United Methodist Church (A), United Synagogue of America (B), Christian Science Foundation (C), Saint Rita Catholic Church (D). Display/hide their locations on the map
2,001 married couples with children.
394 single-parent households (30 men, 364 women).
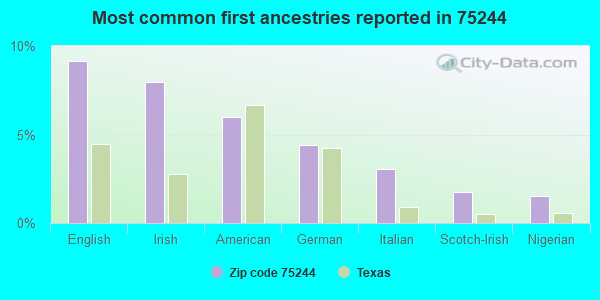
75.0% of residents of 75244 zip code speak English at home.
15.1% of residents speak Spanish at home (67% very well, 13% well, 10% not well, 10% not at all).
3.4% of residents speak other Indo-European language at home (87% very well, 8% well, 5% not well).
5.2% of residents speak Asian or Pacific Island language at home (79% very well, 18% well, 3% not well).
1.8% of residents speak other language at home (86% very well, 7% well, 8% not well).
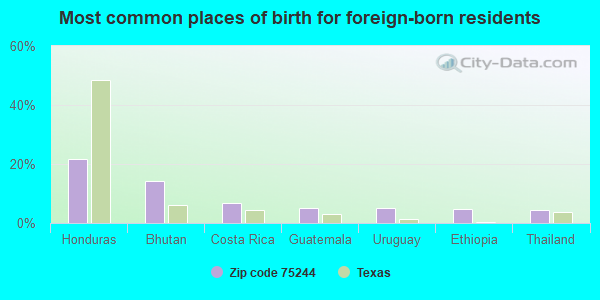
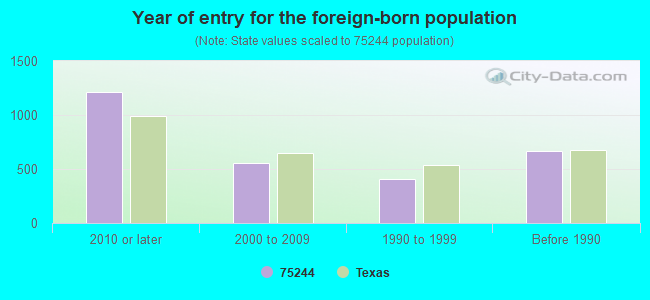
Foreign born population: 2,502 (19.1%) (45.2% of them are naturalized citizens)
Facilities with environmental interests located in this zip code:
AMERICAN FOOD SERVICE, INC. (4721 SIMONTON RD in DALLAS, TX)
(Integrated Compliance Information System) - ICIS-06-2001-4331, FORMAL ENFORCEMENT ACTION Business SIC classification: FOOD PREPARATIONS
ADINFINITUM INC (4250 SPRING VALLEY RD in DALLAS, TX)
(Resource Conservation and Recovery Act (tracking hazardous waste)) Business NAICS classification: PREPRESS SERVICES. Organizations: WARD SKINNER (CONTACT/OPERATOR)
AMERICAN COLOR (14320 MIDWAY RD in DALLAS, TX)
(Resource Conservation and Recovery Act (tracking hazardous waste)) Business NAICS classification: OTHER COMMERCIAL PRINTING.
AJAX DPC 2803 NO1862 (PORT COMPRESSOR IN EDDY COUNTY in UNKNOWN, NM)
AIR MINOR (AIRS/AFS) CRITERIA AND HAZARDOUS AIR POLLUTANT INVENTORY (Inventory of air pollution sources) Business SIC classification: NATURAL GAS TRANSMISSION Business NAICS classification: PIPELINE TRANSPORTATION OF NATURAL GAS. Alternative names: KERR-MCGEE, KERR-MCGEE AJAX DPC 2803, KERR-MCGEE AJAX DPC 2803 NO1862, KERR-MCGEE KERRMCGEE - AJAX DPC 2803 NO1
AMERIPATH (4350 ALPHA RD in DALLAS, TX)
Small Quantity Generators, between 100 kg and 1000 kg of hazardous waste/month (Resource Conservation and Recovery Act (tracking hazardous waste))
FED 28-2 COMPRESSOR STATION (PORTABLE SOURCE in PORTABLE SOURCE, NM)
AIR MINOR (AIRS/AFS) Business SIC classification: NATURAL GAS TRANSMISSION Alternative names: CHEVRON USA AJAX DPC540LE
ARCHER GENERATING STATION (4100 SPRING VALLEY SUITE 1001 in FARMERS BRANCH, TX)
AIR PROGRAM (Clean Air Markets Division Business System) AIR MAJOR ("Best Available" air pollution technologies tracking) Business SIC classification: ELECTRIC SERVICES Organizations: ARCHER POWER PARTNERS, LP (OWNER/OPERATOR)
AMERICAN HOMEWARE INC (4715 MC EWEN ROAD in DALLAS, TX)
COMPLIANCE ACTIVITY (Tracking inspections of insecticide, fungicide, and rodenticide, and toxic substances)
Housing units lacking complete plumbing facilities: 0.2% Housing units lacking complete kitchen facilities: 1.0%
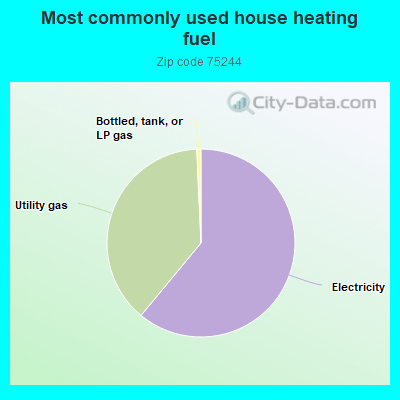
60.9%Electricity
38.2%Utility gas
0.7%Bottled, tank, or LP gas
Population in 1990: 16,870. Population change in the 1990s: +617 (+3.7%).
Place of birth for U.S.-born residents:
This state: 6,215
Northeast: 801
Midwest: 1,296
South: 1,267
West: 727
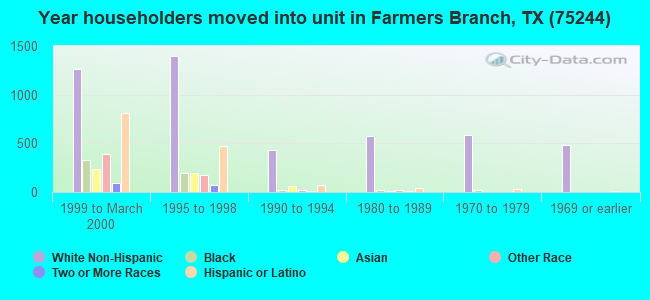
39% of the 75244 zip code residents lived in the same house 5 years ago. Out of people who lived in different houses, 59% lived in this county. Out of people who lived in different counties, 50% lived in Texas.
82% of the 75244 zip code residents lived in the same house 1 year ago. Out of people who lived in different houses, 51% moved from this county. Out of people who lived in different houses, 24% moved from different county within same state. Out of people who lived in different houses, 20% moved from different state. Out of people who lived in different houses, 4% moved from abroad.
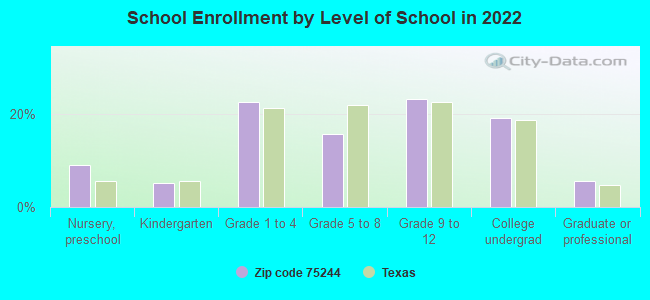
Private vs. public school enrollment:
Students in private schools in grades 1 to 8 (elementary and middle school): 658
Here:
60.3%
Texas:
8.8%
Students in private schools in grades 9 to 12 (high school): 290
Here:
45.0%
Texas:
8.0%
Students in private undergraduate colleges: 32
Here:
6.2%
Texas:
16.2%
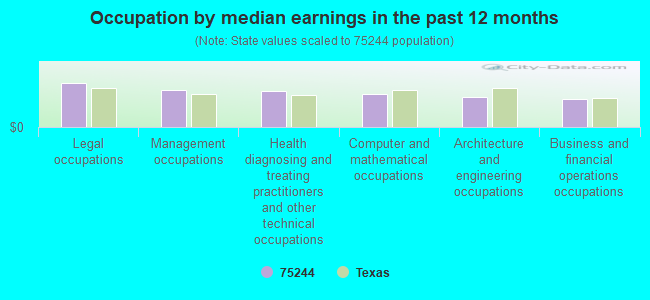
Occupation by median earnings in the past 12 months ($)
130,822Legal occupations
111,160Management occupations
106,039Health diagnosing and treating practitioners and other technical occupations
96,649Computer and mathematical occupations
89,434Architecture and engineering occupations
83,519Business and financial operations occupations
Companies with biggest federal contracts located in this zip code:
SIDRAN, INC (14280 GILLIS ROAD in FARMERS BRANCH, TX; small business) : $27,935,338 in 65 contractsfrom 1999 to 2006
Contracts for Outerwear, Men's, Clothing, Special Purpose by Defense Logistics Agency Signed by year:2000: $2,804,575; 2001: $8,231,668; 2002: $2,859,727; 2003: $861,489; 2004: $4,478,878; 2005: $6,773,349; 2006: $1,838,688.
Biggest contracts:
$3,379,471 with Defense Logistics Agency for Outerwear, Men's. Signed on 2001-09-30. Completion date: 2002-05-24.
$1,223,922, same as above.Signed on 2004-02-09. Completion date: 2004-07-28.
$1,141,938 with Defense Logistics Agency for Clothing, Special Purpose. Signed on 2006-04-05. Completion date: 2006-11-23.
$1,123,470, same as above.Signed on 2005-10-24. Completion date: 2006-02-13.
DG21 LLC (4801 SPRING VALLEY ROAD SU in DALLAS, TX) : $5,688,768 in 85 contractsfrom 1999 to 2001
Contracts for Other Housekeeping Services by Navy Signed by year:2000: $4,459,032; 2001: $950,826; 2002: $0; 2003: $0; 2004: $0; 2005: $0; 2006: $0.
Biggest contracts:
$422,921 with Navy for Other Housekeeping Services. Taking place in HI. Signed on 2000-09-26. Completion date: 2002-11-30.
$318,194, same as above.Signed on 2000-09-28. Completion date: 2002-06-30.
$260,529, same as above.Signed on 2000-09-29. Completion date: 2002-05-31.
$184,406, same as above.Signed on 2001-02-01. Completion date: 2002-06-30.
OCCIDENTAL CHEMICAL CORP (5005 LYNDON B JOHNSON FWY in DALLAS, TX) : $959,768 in 2 contractsin 1999
$548,500 with Navy for Marine Charter for Things. Taking place in VA. Signed on 1999-10-01. Completion date: 1999-07-15.
$411,268 with Navy for Marine Charter for Things. Signed on 1999-10-01. Completion date: 1999-07-25.
R F MONOLITHICS INC (4347 SIGMA RD in DALLAS, TX; small business) : $813,680 in 5 contractsin 2002
Contracts for Defense Electronics and Communication Equipment -- Basic Research (R&D), Defense Electronics and Communication Equipment -- Applied Research and Exploratory Development (R&D) by Army Signed by year:2000: $0; 2001: $0; 2002: $813,680; 2003: $0; 2004: $0; 2005: $0; 2006: $0.
Biggest contracts:
$350,000 with Army for Defense Electronics and Communication Equipment -- Basic Research (R&D). Signed on 2002-08-22. Completion date: 2004-08-31.
$350,000, same as above.Signed on 2002-09-16. Completion date: 2004-08-31.
$65,985 with Army for Defense Electronics and Communication Equipment -- Applied Research and Exploratory Development (R&D). Signed on 2002-02-11. Completion date: 2002-08-07.
$25,000, same as above.Signed on 2002-08-20. Completion date: 2002-12-12.
INTERVEST-HOUSTON NLW, LTD (4131 CENTURION WAY in DALLAS, TX; small business) 2 employees, $110000 revenue. : $603,399 in 18 contractsfrom 1999 to 2003
Contracts for Lease or Rental of Facilities -- Office Buildings by Public Buildings Service Signed by year:2000: $132,000; 2001: $119,000; 2002: $133,758; 2003: $185,641; 2004: $0; 2005: $0; 2006: $0.
Biggest contracts:
$43,000 with Public Buildings Service for Lease or Rental of Facilities -- Office Buildings. Signed on 2002-03-15. Completion date: 2002-03-15.
$43,000, same as above.Signed on 2001-12-15. Completion date: 2001-12-15.
$43,000, same as above.Signed on 2001-09-15. Completion date: 2001-09-15.
$42,189, same as above.Signed on 2003-06-15. Completion date: 2003-06-15.
HONEYWELL INC (14350 PROTON RD in DALLAS, TX) : $381,832 in 11 contractsfrom 1999 to 2006
Contracts for Technology Sharing/Utilization Services, ADP Support Equipment, Maintenance, Repair or Alteration of Real Property -- Other Educational Buildings, Maintenance, Repair and Rebuilding of Equipment -- Fire Fighting, Rescue, and Safety Equipment; and Environmental Protection Equipment and Materials, and moreby National Oceanic and Atmospheric Administration/Under Secretary for Oceans and Atmosphere, Air Force, EPA Signed by year:2000: $0; 2001: $0; 2002: $0; 2003: $0; 2004: $207,005; 2005: $84,121; 2006: $43,824.
Biggest contracts:
$207,005 with National Oceanic and Atmospheric Administration/Under Secretary for Oceans and Atmosphere for Technology Sharing/Utilization Services. Taking place in CO. Signed on 2004-09-02. Completion date: 2004-09-04.
$51,302 with Air Force for ADP Support Equipment. Signed on 2005-09-28. Completion date: 2005-11-27.
$46,882 with Air Force for Maintenance, Repair or Alteration of Real Property -- Other Educational Buildings. Signed on 1999-12-20. Completion date: 2000-03-31.
$16,812 with EPA for Maintenance, Repair and Rebuilding of Equipment -- Fire Fighting, Rescue, and Safety Equipment; and Environmental Protection Equipment and Materials. Taking place in MD. Signed on 2005-11-23. Completion date: 2006-12-31.
FIRST INTERNATIONAL FINANCIAL (4010 DEEP VALLEY in DALLAS, TX; small business)
$353,400 with Defense Logistics Agency for Specialized Shipping and Storage Containers. Signed on 2002-06-14. Completion date: 2002-10-07.
ANI DIRECT, LLC (13610 MIDWAY RD STE#240 in DALLAS, TX; small business) : $262,173 in 11 contractsfrom 2003 to 2006
Contracts for ADP Software, ADP Components, ADP Support Equipment, ADPE System Configuration by Bureau of Reclamation, Air Force, Department of Defense, Public Buildings Service, and others Signed by year:2000: $0; 2001: $0; 2002: $0; 2003: $78,305; 2004: $119,783; 2005: $50,380; 2006: $13,705.
Biggest contracts:
$92,852 with Bureau of Reclamation for ADP Software. Taking place in CO. Signed on 2004-06-28. Completion date: 2006-06-30.
$71,400 with Air Force for ADP Software. Signed on 2003-10-01. Completion date: 2003-10-01.
$26,931 with Air Force for ADP Components. Taking place in NE. Signed on 2004-07-13. Completion date: 2004-08-03.
$24,320 with Air Force for ADP Support Equipment. Signed on 2005-09-23. Completion date: 2005-10-23.
DALLAS MIDWEST COMPANY (4100 ALPHA ROAD SUITE 111 in DALLAS, TX; small business) : $215,159 in 24 contractsfrom 2002 to 2006
Contracts for Office Furniture, Miscellaneous Communication Equipment, Miscellaneous Waxes, Oils, and Fats, Miscellaneous Furniture and Fixtures, and moreby Army, Navy, U.S. Army Corps of Engineers - civil program financing only, Air Force, and others Signed by year:2000: $0; 2001: $0; 2002: $11,308; 2003: $26,759; 2004: $65,321; 2005: $84,472; 2006: $27,299.
Biggest contracts:
$23,848 with Army for Office Furniture. Signed on 2003-09-17. Completion date: 2003-10-10.
$22,308 with Army for Miscellaneous Communication Equipment. Signed on 2004-09-20. Completion date: 2004-11-19.
$21,725 with Army for Miscellaneous Waxes, Oils, and Fats. Signed on 2005-09-14. Completion date: 2005-10-14.
$19,758 with Army for Office Furniture. Signed on 2005-07-11. Completion date: 2005-08-04.
LAN-TEC TEXAS INC (14348 PROTON RD in DALLAS, TX; small business) : $117,578 in 4 contractsfrom 2002 to 2005
$92,675 with Army for Chain and Wire Rope. Signed on 2002-02-04. Completion date: 2002-03-01.
$21,840 with Army for Cable, Cord, and Wire Assemblies: Communications Equipment. Taking place in AZ. Signed on 2004-07-30. Completion date: 2004-08-18.
$3,131 with Army for Miscellaneous Electrical and Electronic Components. Signed on 2004-04-13. Completion date: 2004-04-16.
-$68 with Army for Cable, Cord, and Wire Assemblies: Communications Equipment. Taking place in AZ. Signed on 2005-09-17. Completion date: 2004-08-18.
Top industries in this zip code by the number of employees in 2005:
Administrative and Support and Waste Management and Remediation Services: Temporary Help Services (500-999 employees: 1 establishment, 250-499 employees: 4 establishments, 100-249 employees: 6 establishments, 50-99 employees: 3 establishments, 20-49 employees: 8 establishments, 10-19 employees: 2 establishments, 5-9 employees: 1 establishment, 1-4 employees: 5 establishments)
Finance and Insurance: Insurance Agencies and Brokerages (250-499: 2, 50-99: 2, 20-49: 2, 10-19: 3, 5-9: 2, 1-4: 21)
Management of Companies and Enterprises: Corporate, Subsidiary, and Regional Managing Offices (250-499: 1, 50-99: 3, 20-49: 6, 10-19: 2, 5-9: 4, 1-4: 10)
Finance and Insurance: Direct Life Insurance Carriers (250-499: 1, 50-99: 3, 20-49: 3, 10-19: 1, 1-4: 3)
2002 - 2018 National Fire Incident Reporting System (NFIRS) incidents
According to the data from the years 2002 - 2018 the average number of fire incidents per year is 23. The highest number of fires - 45 took place in 2002, and the least - 2 in 2005. The data has a declining trend.
When looking into fire subcategories, the most reports belonged to: Outside Fires (39.2%), and Structure Fires (27.8%).
Fire incident types reported to NFIRS in Zip Code 75244


 Nearest zip codes: 75001, 75254, 75229, 75230, 75240, 75234.
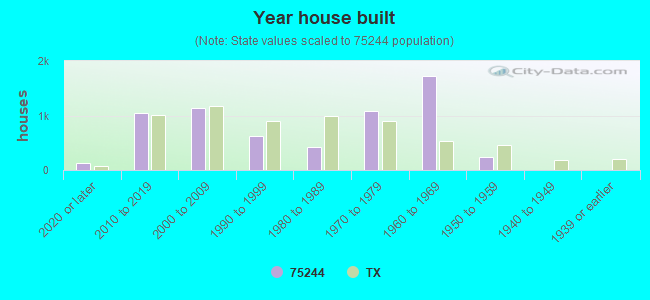


 According to the data from the years 2002 - 2018 the average number of fire incidents per year is 23. The highest number of fires - 45 took place in 2002, and the least - 2 in 2005. The data has a declining trend.
 When looking into fire subcategories, the most reports belonged to: Outside Fires (39.2%), and Structure Fires (27.8%).