Estimated zip code population in 2022: 27,536 Zip code population in 2010: 28,293 Zip code population in 2000: 24,737
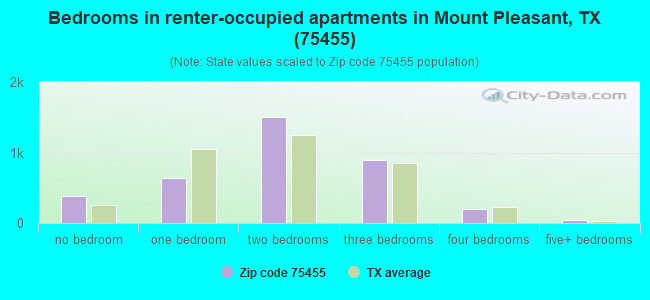
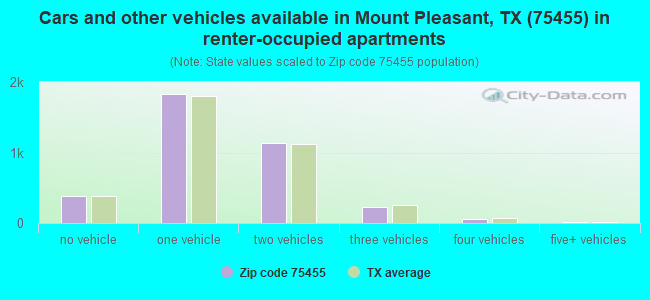
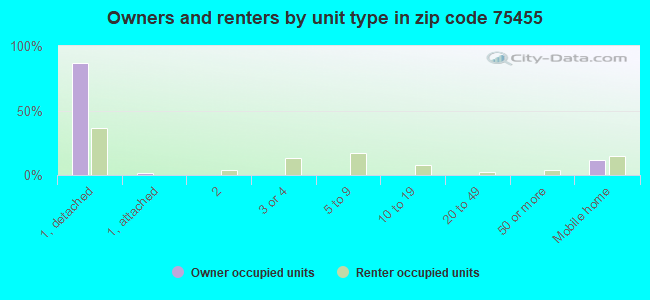
Houses and condos: 10,661 Renter-occupied apartments: 3,647
% of renters here:
37%
State:
38%
March 2022 cost of living index in zip code 75455: 78.1 (low, U.S. average is 100)
Land area: 295.2 sq. mi. Water area: 11.6 sq. mi.
Population density: 93 people per square mile
(very low).
OSM Map
General Map
Google Map
MSN Map
OSM Map
General Map
Google Map
MSN Map
OSM Map
General Map
Google Map
MSN Map
OSM Map
General Map
Google Map
MSN Map
Please wait while loading the map...
Real estate property taxes paid for housing units in 2022:
This zip code:
1.1% ($1,925)
Texas:
1.5% ($4,050)
Median real estate property taxes paid for housing units with mortgages in 2022: $2,404 (1.1%) Median real estate property taxes paid for housing units with no mortgage in 2022: $1,727 (1.1%)
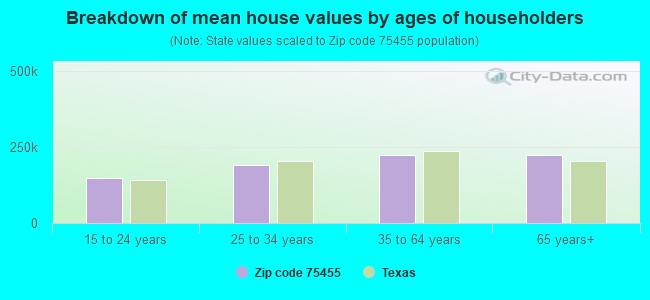
Estimated median house/condo value in 2022: $172,183
75455:
$172,183
Texas:
$275,400
According to our research of Texas and other state lists, there were 66 registered sex offenders living in 75455 zip code as of April 27, 2024. The ratio of all residents to sex offenders in zip code 75455 is 440 to 1. The ratio of registered sex offenders to all residents in this zip code is near the state average.
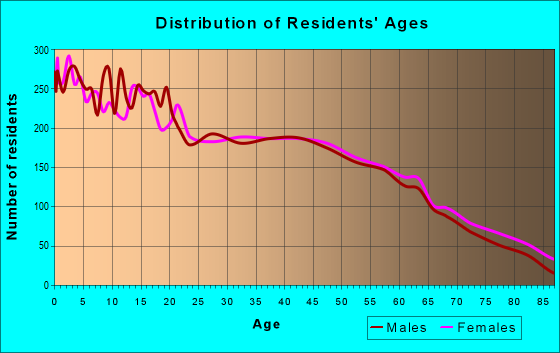
Median resident age:
This zip code:
33.8 years
Texas median age:
35.6 years
Average household size:
This zip code:
2.8 people
Texas:
2.6 people
Averages for the 2020 tax year for zip code 75455, filed in 2021:
Average Adjusted Gross Income (AGI) in 2020: $50,722 (Individual Income Tax Returns)
Here:
$50,722
State:
$77,054
Salary/wage: $42,790 (reported on 86.6% of returns)
Here:
$42,790
State:
$62,766
(% of AGI for various income ranges: 1396.2% for AGIs below $25k, 3840.7% for AGIs $25k-50k, 6713.5% for AGIs $50k-75k, 9257.7% for AGIs $75k-100k, 15718.5% for AGIs $100k-200k, 69447.1% for AGIs over 200k)
Taxable interest for individuals: $1,595 (reported on 16.8% of returns)
This zip code:
$1,595
Texas:
$2,665
(% of AGI for various income ranges: 8.7% for AGIs below $25k, 10.1% for AGIs $25k-50k, 25.2% for AGIs $50k-75k, 67.0% for AGIs $75k-100k, 147.6% for AGIs $100k-200k, 1534.3% for AGIs over 200k)
Ordinary dividends: $5,033 (reported on 8.1% of returns)
Here:
$5,033
State:
$10,044
(% of AGI for various income ranges: 8.6% for AGIs below $25k, 10.1% for AGIs $25k-50k, 46.5% for AGIs $50k-75k, 83.2% for AGIs $75k-100k, 202.8% for AGIs $100k-200k, 2982.9% for AGIs over 200k)
Net capital gain/loss in AGI: +$21,529 (reported on 8.0% of returns)
Here:
+$21,529
State:
+$39,590
(% of AGI for various income ranges: 6.0% for AGIs below $25k, 10.7% for AGIs $25k-50k, 34.6% for AGIs $50k-75k, 132.1% for AGIs $75k-100k, 503.1% for AGIs $100k-200k, 23138.6% for AGIs over 200k)
Profit/loss from business: +$10,660 (reported on 16.2% of returns)
Here:
+$10,660
State:
+$10,888
(% of AGI for various income ranges: 92.3% for AGIs below $25k, 29.1% for AGIs $25k-50k, 134.7% for AGIs $50k-75k, 239.8% for AGIs $75k-100k, 778.9% for AGIs $100k-200k, 13147.1% for AGIs over 200k)
Taxable individual retirement arrangement distribution: $21,950 (reported on 5.7% of returns)
75455:
$21,950
Texas:
$24,740
(% of AGI for various income ranges: 24.1% for AGIs below $25k, 48.8% for AGIs $25k-50k, 149.8% for AGIs $50k-75k, 442.5% for AGIs $75k-100k, 1020.9% for AGIs $100k-200k, 3648.6% for AGIs over 200k)
Total itemized deductions: $38,603 (reported on 3.2% of returns)
Here:
$38,603
State:
$40,428
(% of AGI for various income ranges: 62.7% for AGIs $25k-50k, 109.9% for AGIs $50k-75k, 237.0% for AGIs $75k-100k, 712.8% for AGIs $100k-200k, 8644.3% for AGIs over 200k)
Charity contributions: $15,887 (reported on 2.5% of returns)
Here:
$15,887
State:
$18,201
(% of AGI for various income ranges: 5.7% for AGIs $25k-50k, 21.3% for AGIs $50k-75k, 54.7% for AGIs $75k-100k, 219.1% for AGIs $100k-200k, 4017.1% for AGIs over 200k)
Taxes paid: $6,267 (reported on 3.0% of returns)
75455:
$6,267
State:
$7,821
(% of AGI for various income ranges: 5.7% for AGIs $25k-50k, 16.5% for AGIs $50k-75k, 53.9% for AGIs $75k-100k, 120.9% for AGIs $100k-200k, 1285.7% for AGIs over 200k)
Earned income credit: $2,648 (reported on 24.7% of returns)
Here:
$2,648
State:
$2,584
(% of AGI for various income ranges: 138.9% for AGIs below $25k, 93.0% for AGIs $25k-50k, 2.2% for AGIs $50k-75k)
Percentage of individuals using paid preparers for their 2020 taxes: 92.0%
Here:
92%
State:
92%
(% for various income ranges: 90.6% for AGIs below $25k, 92.5% for AGIs $25k-50k, 92.4% for AGIs $50k-75k, 93.8% for AGIs $75k-100k, 93.4% for AGIs $100k-200k, 95.8% for AGIs over 200k)
Averages for the 2012 tax year for zip code 75455, filed in 2013:
Average Adjusted Gross Income (AGI) in 2012: $43,805 (Individual Income Tax Returns)
Here:
$43,805
State:
$65,384
Salary/wage: $36,248 (reported on 88.8% of returns)
Here:
$36,248
State:
$52,524
(% of AGI for various income ranges: 86.3% for AGIs below $25k, 89.0% for AGIs $25k-50k, 80.6% for AGIs $50k-75k, 75.6% for AGIs $75k-100k, 74.6% for AGIs $100k-200k, 38.3% for AGIs over 200k)
Taxable interest for individuals: $1,832 (reported on 17.7% of returns)
This zip code:
$1,832
Texas:
$2,372
(% of AGI for various income ranges: 0.6% for AGIs below $25k, 0.5% for AGIs $25k-50k, 0.7% for AGIs $50k-75k, 0.8% for AGIs $75k-100k, 0.9% for AGIs $100k-200k, 1.0% for AGIs over 200k)
Ordinary dividends: $5,179 (reported on 8.9% of returns)
Here:
$5,179
State:
$9,721
(% of AGI for various income ranges: 0.7% for AGIs below $25k, 0.3% for AGIs $25k-50k, 0.7% for AGIs $50k-75k, 0.6% for AGIs $75k-100k, 0.9% for AGIs $100k-200k, 2.8% for AGIs over 200k)
Net capital gain/loss in AGI: +$37,872 (reported on 7.6% of returns)
Here:
+$37,872
State:
+$35,319
(% of AGI for various income ranges: 0.5% for AGIs $50k-75k, 0.6% for AGIs $75k-100k, 1.7% for AGIs $100k-200k, 30.8% for AGIs over 200k)
Profit/loss from business: +$15,356 (reported on 13.0% of returns)
Here:
+$15,356
State:
+$13,732
(% of AGI for various income ranges: 5.4% for AGIs below $25k, 1.9% for AGIs $25k-50k, 2.9% for AGIs $50k-75k, 2.9% for AGIs $75k-100k, 5.9% for AGIs $100k-200k, 8.0% for AGIs over 200k)
Taxable individual retirement arrangement distribution: $15,028 (reported on 6.5% of returns)
75455:
$15,028
Texas:
$19,511
(% of AGI for various income ranges: 1.6% for AGIs below $25k, 1.6% for AGIs $25k-50k, 1.9% for AGIs $50k-75k, 3.9% for AGIs $75k-100k, 2.9% for AGIs $100k-200k, 2.1% for AGIs over 200k)
Self-employment retirement plans: $16,567 (reported on 0.3% of returns)
75455:
$16,567
Texas:
$23,938
Total itemized deductions: $22,322 (18% of AGI, reported on 13.0% of returns)
Here:
$22,322
State:
$24,724
Here:
17.6% of AGI
State:
15.9% of AGI
(% of AGI for various income ranges: 3.2% for AGIs below $25k, 4.4% for AGIs $25k-50k, 6.9% for AGIs $50k-75k, 8.8% for AGIs $75k-100k, 9.8% for AGIs $100k-200k, 7.9% for AGIs over 200k)
Charity contributions: $8,066 (reported on 9.8% of returns)
Here:
$8,066
State:
$6,808
(% of AGI for various income ranges: 0.4% for AGIs below $25k, 0.6% for AGIs $25k-50k, 1.3% for AGIs $50k-75k, 2.2% for AGIs $75k-100k, 2.8% for AGIs $100k-200k, 3.6% for AGIs over 200k)
Taxes paid: $4,408 (reported on 12.5% of returns)
75455:
$4,408
State:
$6,921
(% of AGI for various income ranges: 0.4% for AGIs below $25k, 0.6% for AGIs $25k-50k, 1.2% for AGIs $50k-75k, 1.8% for AGIs $75k-100k, 2.3% for AGIs $100k-200k, 1.6% for AGIs over 200k)
Earned income credit: $2,722 (reported on 30.2% of returns)
Here:
$2,722
State:
$2,570
(% of AGI for various income ranges: 9.0% for AGIs below $25k, 2.1% for AGIs $25k-50k)
Percentage of individuals using paid preparers for their 2012 taxes: 56.2%
Here:
56%
State:
51%
(% for various income ranges: 53.6% for AGIs below $25k, 56.6% for AGIs $25k-50k, 56.9% for AGIs $50k-75k, 58.9% for AGIs $75k-100k, 63.8% for AGIs $100k-200k, 87.5% for AGIs over 200k)
Averages for the 2004 tax year for zip code 75455, filed in 2005:
Average Adjusted Gross Income (AGI) in 2004: $34,553 (Individual Income Tax Returns)
Here:
$34,553
State:
$47,881
Salary/wage: $31,721 (reported on 87.2% of returns)
Here:
$31,721
State:
$41,947
(% of AGI for various income ranges: 133.3% for AGIs below $10k, 87.6% for AGIs $10k-25k, 84.3% for AGIs $25k-50k, 81.0% for AGIs $50k-75k, 81.1% for AGIs $75k-100k, 64.6% for AGIs over 100k)
Taxable interest for individuals: $2,250 (reported on 27.5% of returns)
This zip code:
$2,250
Texas:
$2,255
(% of AGI for various income ranges: 7.6% for AGIs below $10k, 1.9% for AGIs $10k-25k, 1.7% for AGIs $25k-50k, 1.7% for AGIs $50k-75k, 1.5% for AGIs $75k-100k, 1.6% for AGIs over 100k)
Taxable dividends: $2,157 (reported on 12.8% of returns)
Here:
$2,157
State:
$4,261
(% of AGI for various income ranges: 2.7% for AGIs below $10k, 0.4% for AGIs $10k-25k, 0.6% for AGIs $25k-50k, 0.6% for AGIs $50k-75k, 0.6% for AGIs $75k-100k, 1.4% for AGIs over 100k)
Net capital gain/loss: +$5,713 (reported on 12.6% of returns)
Here:
+$5,713
State:
+$16,110
(% of AGI for various income ranges: 1.7% for AGIs below $10k, 0.3% for AGIs $10k-25k, 0.5% for AGIs $25k-50k, 1.0% for AGIs $50k-75k, 2.0% for AGIs $75k-100k, 5.8% for AGIs over 100k)
Profit/loss from business: +$12,463 (reported on 13.7% of returns)
Here:
+$12,463
State:
+$11,013
(% of AGI for various income ranges: 10.0% for AGIs below $10k, 4.2% for AGIs $10k-25k, 3.0% for AGIs $25k-50k, 3.1% for AGIs $50k-75k, 3.5% for AGIs $75k-100k, 9.1% for AGIs over 100k)
IRA payment deduction: $3,469 (reported on 1.6% of returns)
75455:
$3,469
Texas:
$3,120
(% of AGI for various income ranges: 0.1% for AGIs $10k-25k, 0.2% for AGIs $25k-50k, 0.2% for AGIs $50k-75k, 0.1% for AGIs $75k-100k, 0.2% for AGIs over 100k)
Self-employed pension: $21,400 (reported on 0.3% of returns)
Here:
$21,400
Texas:
$16,401
Total itemized deductions: $17,671 (21% of AGI, reported on 13.3% of returns)
Here:
$17,671
State:
$19,631
Here:
21.0% of AGI
State:
18.9% of AGI
(% of AGI for various income ranges: 7.5% for AGIs below $10k, 3.3% for AGIs $10k-25k, 5.2% for AGIs $25k-50k, 7.6% for AGIs $50k-75k, 9.4% for AGIs $75k-100k, 9.1% for AGIs over 100k)
Charity contributions deductions: $5,273 (6% of AGI, reported on 11.4% of returns)
Here:
$5,273
State:
$4,753
Here:
6.0% of AGI
State:
4.2% of AGI
(% of AGI for various income ranges: 0.7% for AGIs below $10k, 0.5% for AGIs $10k-25k, 1.0% for AGIs $25k-50k, 2.0% for AGIs $50k-75k, 2.4% for AGIs $75k-100k, 3.0% for AGIs over 100k)
Total tax: $5,531 (reported on 59.1% of returns)
75455:
$5,531
State:
$9,058
(% of AGI for various income ranges: 3.4% for AGIs below $10k, 2.5% for AGIs $10k-25k, 4.9% for AGIs $25k-50k, 8.4% for AGIs $50k-75k, 10.8% for AGIs $75k-100k, 19.8% for AGIs over 100k)
Earned income credit: $2,046 (reported on 28.1% of returns)
Here:
$2,046
State:
$2,024
Percentage of individuals using paid preparers for their 2004 taxes: 65.1%
Here:
65%
State:
57%
(% for various income ranges: 55.3% for AGIs below $10k, 68.5% for AGIs $10k-25k, 68.4% for AGIs $25k-50k, 64.9% for AGIs $50k-75k, 60.5% for AGIs $75k-100k, 71.2% for AGIs over 100k)
Household received Food Stamps/SNAP in the past 12 months: 1,645 Household did not receive Food Stamps/SNAP in the past 12 months: 8,234
Women who had a birth in the past 12 months: 622 (356 now married, 261 unmarried) Women who did not have a birth in the past 12 months: 6,014 (2,745 now married, 3,265 unmarried)
Housing units in zip code 75455 with a mortgage: 2,716 (89 second mortgage, 61 both second mortgage and home equity loan) Houses without a mortgage: 15
Median monthly owner costs for units with a mortgage: $1,250 Median monthly owner costs for units without a mortgage: $511
Residents with income below the poverty level in 2022:
This zip code:
17.4%
Whole state:
14.0%
Residents with income below 50% of the poverty level in 2022:
This zip code:
11.1%
Whole state:
7.4%
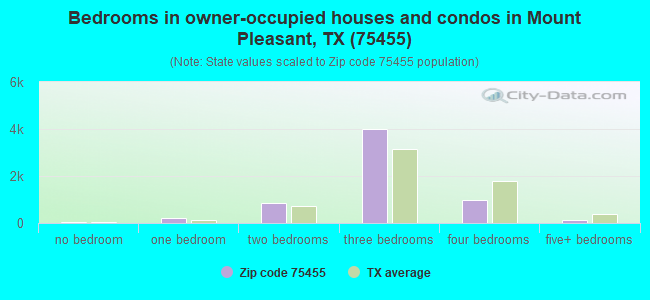
Median number of rooms in houses and condos:
Here:
5.8
State:
6.3
Median number of rooms in apartments:
Here:
4.1
State:
4.0
Notable locations in this zip code not listed on our city pages
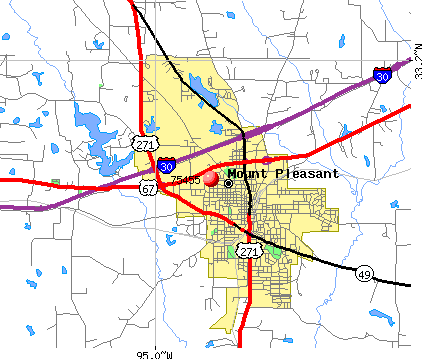
Notable locations in zip code 75455: Talco Rodeo Ground (A), White Oak (B), Piney (C), Center Point (D), Farmers Academy (E), Forest Grove (F), Bridges Chapel (G), Titus County Courthouse (H), Cookville Volunteer Fire Department (I), Five Star Volunteer Fire Department (J), Mount Pleasant Fire Department (K), Sugar Hill Volunteer Fire Department (L), Nortex Volunteer Fire Department (M). Display/hide their locations on the map
Churches in zip code 75455 include: Pleasant Grove Church (A), Ripley Church (B), Union Hill Church (C), Mount Sylvia Church (D), Harris Church (E), Adams Chapel (F), Bethel Church (G), Blundell Creek Church (H), First Baptist Church (I). Display/hide their locations on the map
Cemeteries: Springhill Cemetery (1), Barrett Cemetery (2), Snodgrass Cemetery (3), Blevens Cemetery (4), Deshiell Cemetery (5), Concord Cemetery (6), Cook Cemetery (7). Display/hide their locations on the map
Lakes, reservoirs, and swamps: Oliver Lake (A), Little Grass Lake (B), Hill Hole (C), Cuckoo Pond (D), Blue Lake (E), Brown Lake (F), Brooks Lake (G), Melody Lake (H). Display/hide their locations on the map
Streams, rivers, and creeks: Tankersley Creek (A), Smith Creek (B), Justiss Creek (C), Stinking Creek (D), South Lacy Creek (E), Snake Creek (F), Evans Creek (G), Hart Creek (H), Hayes Creek (I). Display/hide their locations on the map
Parks in zip code 75455 include: Kieth Park (1), Jurney Park (2), Oaklawn Park (3), Monticello Park (4), Dellwood Park (5), Ocotillo Siding (6), Sam Parker Field (7), Fair Park (8), Edwards Park (9). Display/hide their locations on the map
3,982 married couples with children.
2,092 single-parent households (411 men, 1,681 women).
62.3% of residents of 75455 zip code speak English at home.
35.5% of residents speak Spanish at home (59% very well, 19% well, 16% not well, 6% not at all).
0.6% of residents speak other Indo-European language at home (82% very well, 18% not well).
0.9% of residents speak Asian or Pacific Island language at home (13% very well, 9% well, 77% not well).
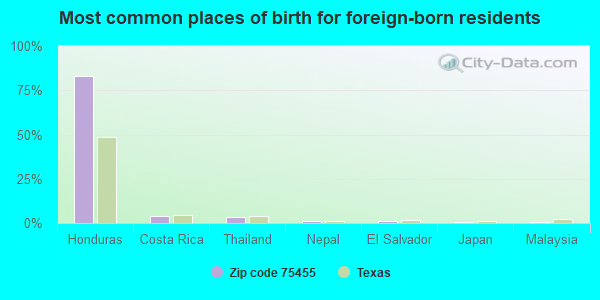
Foreign born population: 5,284 (19.2%) (34.7% of them are naturalized citizens)
This zip code:
19.2%
Whole state:
17.2%
83%Honduras
4%Costa Rica
4%Thailand
1%Nepal
1%El Salvador
1%Japan
0%Malaysia
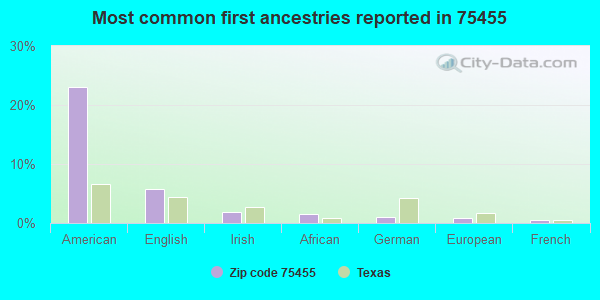
23%American
6%English
2%Irish
2%African
1%German
1%European
1%French
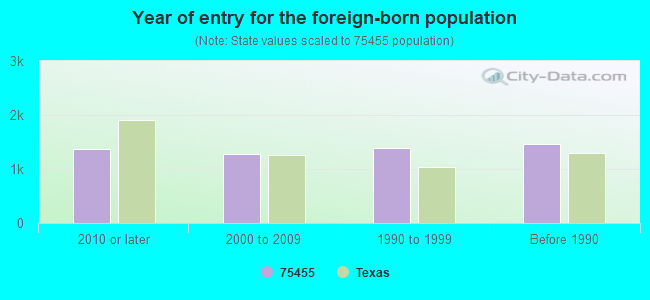
Year of entry for the foreign-born population
1,3742010 or later
1,2692000 to 2009
1,3891990 to 1999
1,459Before 1990
Housing units lacking complete plumbing facilities: 4.5% Housing units lacking complete kitchen facilities: 4.1%
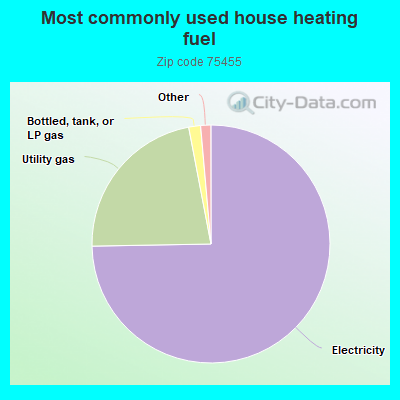
74.8%Electricity
22.3%Utility gas
1.6%Bottled, tank, or LP gas
0.7%Wood
0.6%No fuel used
Population in 1990: 16,878. Population change in the 1990s: +7,859 (+46.6%).
Place of birth for U.S.-born residents:
This state: 17,487
Northeast: 297
Midwest: 638
South: 2,168
West: 1,260
52% of the 75455 zip code residents lived in the same house 5 years ago. Out of people who lived in different houses, 60% lived in this county. Out of people who lived in different counties, 50% lived in Texas.
93% of the 75455 zip code residents lived in the same house 1 year ago. Out of people who lived in different houses, 54% moved from this county. Out of people who lived in different houses, 33% moved from different county within same state. Out of people who lived in different houses, 14% moved from different state.
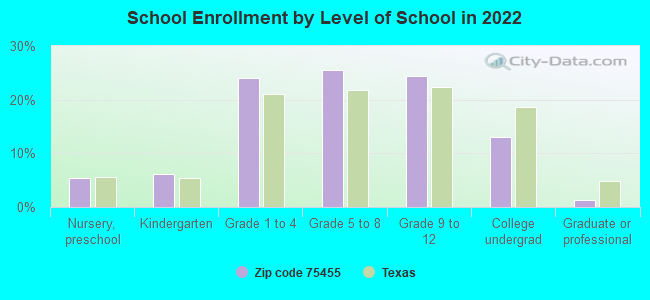
Private vs. public school enrollment:
Students in private schools in grades 1 to 8 (elementary and middle school): 121
Here:
3.4%
Texas:
8.8%
Students in private schools in grades 9 to 12 (high school): 110
Here:
6.2%
Texas:
8.0%
Students in private undergraduate colleges: 87
Here:
9.2%
Texas:
16.2%
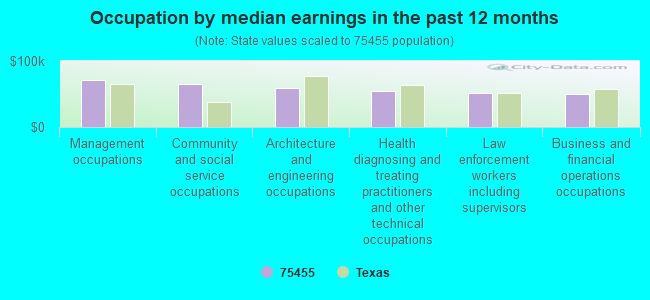
Occupation by median earnings in the past 12 months ($)
71,173Management occupations
64,894Community and social service occupations
58,422Architecture and engineering occupations
54,847Health diagnosing and treating practitioners and other technical occupations
51,997Law enforcement workers including supervisors
50,485Business and financial operations occupations
Companies with federal contracts located in this zip code (MOUNT PLEASANT, TX):
JAY-TEX AVIATION INC (2540 S JEFFERSON AVE; small business) 50 employees, $0 revenue. : $984,966 in 90 contractsfrom 2001 to 2006
Contracts for Aircraft Landing Gear Components, Pressure, Temperature, and Humidity Measuring and Controlling Instruments, Airframe Structural Components, Electrical Hardware and Supplies, and moreby Defense Logistics Agency, Navy, Department of Defense, Air Force, and others Signed by year:2000: $0; 2001: $683,775; 2002: $0; 2003: $32,000; 2004: $109,003; 2005: $104,746; 2006: $55,442.
Biggest contracts:
$421,800 with Defense Logistics Agency for Aircraft Landing Gear Components. Signed on 2001-09-27. Completion date: 2001-10-28.
$100,000 with Navy for Pressure, Temperature, and Humidity Measuring and Controlling Instruments. Signed on 2001-02-07. Completion date: 2001-02-16.
$70,000 with Defense Logistics Agency for Aircraft Landing Gear Components. Signed on 2001-02-12. Completion date: 2001-03-14.
$54,000 with Defense Logistics Agency for Airframe Structural Components. Signed on 2001-02-23. Completion date: 2001-03-25.
NETEX INDUSTRIES (1700 N EDWARD STREET; small business) : $133,912 in 4 contractsfrom 2000 to 2004
$46,926 with Defense Logistics Agency for Lugs, Terminals, and Terminal Strips. Signed on 2002-08-22. Completion date: 2002-11-13.
$46,926, same as above.Signed on 2002-09-20. Completion date: 2002-12-08.
$32,470 with Navy for Batteries, Rechargeable. Signed on 2000-09-26. Completion date: 2001-05-25.
$7,590 with Army for Gardening Implements and Tools. Signed on 2004-05-19. Completion date: 2004-05-24.
KAREN M CAMPBELL (418 WALNUT; small business) : $131,753 in 29 contractsfrom 2003 to 2006
Contracts for Batteries, Rechargeable, Packing and Gasket Materials, Vehicular Furniture and Accessories, Nuts and Washers, and moreby Defense Logistics Agency Signed by year:2000: $0; 2001: $0; 2002: $0; 2003: $0; 2004: $9,327; 2005: $75,901; 2006: $46,525.
Biggest contracts:
$20,222 with Defense Logistics Agency for Batteries, Rechargeable. Signed on 2006-03-28. Completion date: 2006-07-26.
$17,189, same as above.Signed on 2005-07-12. Completion date: 2005-11-08.
$16,015, same as above.Signed on 2005-08-10. Completion date: 2005-11-19.
$14,850 with Defense Logistics Agency for Packing and Gasket Materials. Signed on 2006-03-29. Completion date: 2006-07-04.
A P EQUIPMENT & RENTALS, INC (1700 N EDWARDS AVE; small business)
$28,800 with Defense Logistics Agency for Batteries, Rechargeable. Signed on 2000-04-28. Completion date: 2000-10-12.
SURRATT-KENNINGTON AUTO & TRUC (600 E 16TH STREET; small business) : $17,331 in 2 contractsin 2004
$32,500 with Army for Maintenance, Repair and Rebuilding of Equipment -- Ground Effect Vehicles, Motor Vehicles, Trailers, and Cycles. Signed on 2004-05-10. Completion date: 2004-05-28.
-$15,169, same as above.Signed on 2004-06-09. Completion date: 2004-05-28.
GRIFFITH,LISA (1913 GENE DR)
$9,996 with Air Force for Library Services. Taking place in NY. Signed on 2004-11-15. Completion date: 2005-09-30.
Top industries in this zip code by the number of employees in 2005:
Health Care and Social Assistance: General Medical and Surgical Hospitals (500-999 employees: 1 establishment)
257 people in nursing facilities/skilled-nursing facilities
91 people in college/university student housing
9 people in group homes intended for adults
People in group quarters in 2000:
261 people in nursing homes
122 people in other types of correctional institutions
90 people in wards in general hospitals for patients who have no usual home elsewhere
68 people in college dormitories (includes college quarters off campus)
59 people in homes or halfway houses for drug/alcohol abuse
41 people in hospitals/wards and hospices for chronically ill
41 people in hospices or homes for chronically ill
11 people in other noninstitutional group quarters
Fatal accident statistics in 2014:
Fatal accident count: 6
Vehicles involved in fatal accidents: 9
Fatal accidents caused by drunken drivers: 2
Fatalities: 6
Persons involved in fatal accidents: 13
Pedestrians involved in fatal accidents: 0
Fatal accident statistics in 2013:
Fatal accident count: 4
Vehicles involved in fatal accidents: 7
Fatal accidents caused by drunken drivers: 1
Fatalities: 5
Persons involved in fatal accidents: 14
Pedestrians involved in fatal accidents: 0
2002 - 2018 National Fire Incident Reporting System (NFIRS) incidents
Based on the data from the years 2002 - 2018 the average number of fire incidents per year is 304. The highest number of reported fire incidents - 446 took place in 2011, and the least - 186 in 2018. The data has a declining trend.
When looking into fire subcategories, the most reports belonged to: Outside Fires (56.8%), and Structure Fires (28.0%).
Fire incident types reported to NFIRS in Zip Code 75455


 Nearest zip codes: 75558, 75493, 75571, 75487, 75457, 75686.
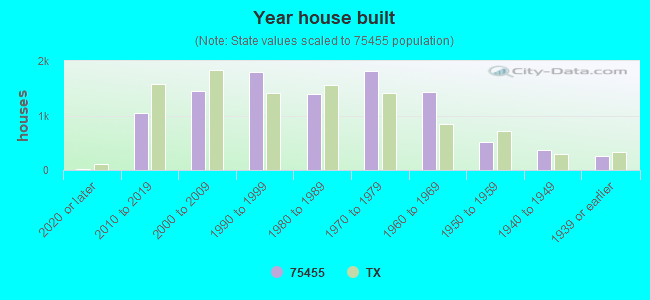


 Based on the data from the years 2002 - 2018 the average number of fire incidents per year is 304. The highest number of reported fire incidents - 446 took place in 2011, and the least - 186 in 2018. The data has a declining trend.
 When looking into fire subcategories, the most reports belonged to: Outside Fires (56.8%), and Structure Fires (28.0%).