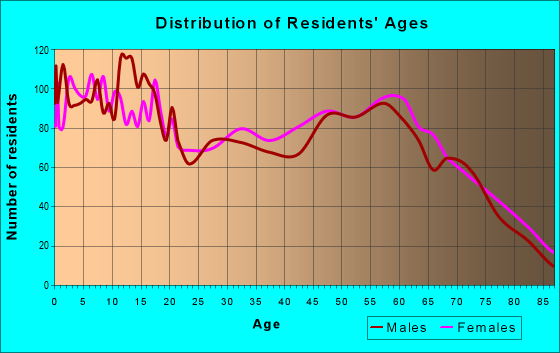
Estimated zip code population in 2022: 13,534 Zip code population in 2010: 12,985 Zip code population in 2000: 11,285
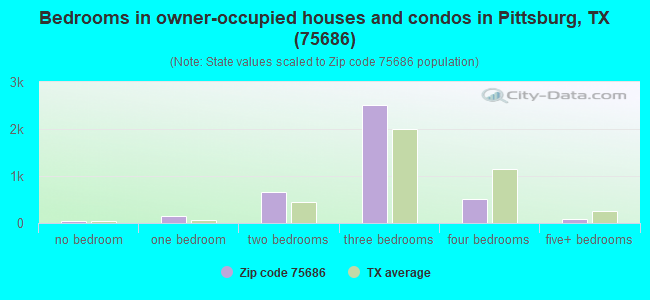
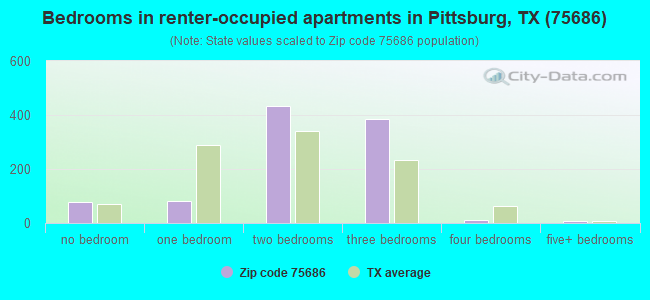
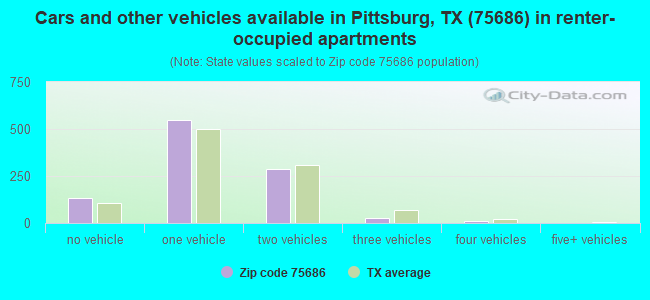
Houses and condos: 6,278 Renter-occupied apartments: 1,006
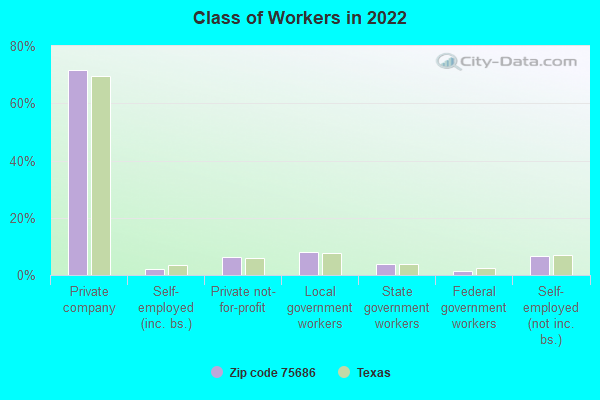
% of renters here:
20%
State:
38%
March 2022 cost of living index in zip code 75686: 79.0 (low, U.S. average is 100)
Land area: 231.9 sq. mi. Water area: 12.5 sq. mi.
Population density: 58 people per square mile
(very low).
OSM Map
General Map
Google Map
MSN Map
OSM Map
General Map
Google Map
MSN Map
OSM Map
General Map
Google Map
MSN Map
OSM Map
General Map
Google Map
MSN Map
Please wait while loading the map...
Real estate property taxes paid for housing units in 2022:
This zip code:
1.1% ($1,896)
Texas:
1.5% ($4,050)
Median real estate property taxes paid for housing units with mortgages in 2022: $2,418 (1.3%) Median real estate property taxes paid for housing units with no mortgage in 2022: $1,537 (1.0%)
Averages for the 2020 tax year for zip code 75686, filed in 2021:
Average Adjusted Gross Income (AGI) in 2020: $54,091 (Individual Income Tax Returns)
Here:
$54,091
State:
$77,054
Salary/wage: $45,116 (reported on 81.7% of returns)
Here:
$45,116
State:
$62,766
(% of AGI for various income ranges: 1271.3% for AGIs below $25k, 3582.4% for AGIs $25k-50k, 6636.6% for AGIs $50k-75k, 8830.3% for AGIs $75k-100k, 15278.2% for AGIs $100k-200k, 77086.7% for AGIs over 200k)
Taxable interest for individuals: $1,445 (reported on 21.9% of returns)
This zip code:
$1,445
Texas:
$2,665
(% of AGI for various income ranges: 13.7% for AGIs below $25k, 17.4% for AGIs $25k-50k, 37.5% for AGIs $50k-75k, 43.2% for AGIs $75k-100k, 100.3% for AGIs $100k-200k, 2236.7% for AGIs over 200k)
Ordinary dividends: $12,163 (reported on 10.3% of returns)
Here:
$12,163
State:
$10,044
(% of AGI for various income ranges: 14.3% for AGIs below $25k, 14.1% for AGIs $25k-50k, 48.3% for AGIs $50k-75k, 74.4% for AGIs $75k-100k, 387.3% for AGIs $100k-200k, 16773.3% for AGIs over 200k)
Net capital gain/loss in AGI: +$17,462 (reported on 10.4% of returns)
Here:
+$17,462
State:
+$39,590
(% of AGI for various income ranges: 10.4% for AGIs below $25k, 23.6% for AGIs $25k-50k, 66.0% for AGIs $50k-75k, 103.5% for AGIs $75k-100k, 708.8% for AGIs $100k-200k, 23490.0% for AGIs over 200k)
Profit/loss from business: +$14,657 (reported on 16.8% of returns)
Here:
+$14,657
State:
+$10,888
(% of AGI for various income ranges: 134.6% for AGIs below $25k, 146.8% for AGIs $25k-50k, 225.4% for AGIs $50k-75k, 377.1% for AGIs $75k-100k, 517.6% for AGIs $100k-200k, 19160.0% for AGIs over 200k)
Taxable individual retirement arrangement distribution: $23,419 (reported on 7.4% of returns)
75686:
$23,419
Texas:
$24,740
(% of AGI for various income ranges: 47.4% for AGIs below $25k, 80.3% for AGIs $25k-50k, 135.4% for AGIs $50k-75k, 344.7% for AGIs $75k-100k, 1238.2% for AGIs $100k-200k, 6956.7% for AGIs over 200k)
Total itemized deductions: $41,833 (reported on 3.6% of returns)
Here:
$41,833
State:
$40,428
(% of AGI for various income ranges: 64.9% for AGIs $25k-50k, 165.1% for AGIs $50k-75k, 325.3% for AGIs $75k-100k, 702.1% for AGIs $100k-200k, 11420.0% for AGIs over 200k)
Charity contributions: $12,467 (reported on 3.1% of returns)
Here:
$12,467
State:
$18,201
(% of AGI for various income ranges: 5.6% for AGIs below $25k, 28.9% for AGIs $50k-75k, 65.0% for AGIs $75k-100k, 227.6% for AGIs $100k-200k, 3306.7% for AGIs over 200k)
Taxes paid: $6,490 (reported on 3.6% of returns)
75686:
$6,490
State:
$7,821
(% of AGI for various income ranges: 10.8% for AGIs $25k-50k, 26.8% for AGIs $50k-75k, 51.5% for AGIs $75k-100k, 126.1% for AGIs $100k-200k, 1513.3% for AGIs over 200k)
Earned income credit: $2,660 (reported on 23.6% of returns)
Here:
$2,660
State:
$2,584
(% of AGI for various income ranges: 147.3% for AGIs below $25k, 93.4% for AGIs $25k-50k, 2.2% for AGIs $50k-75k)
Percentage of individuals using paid preparers for their 2020 taxes: 92.5%
Here:
92%
State:
92%
(% for various income ranges: 90.8% for AGIs below $25k, 94.5% for AGIs $25k-50k, 92.0% for AGIs $50k-75k, 93.6% for AGIs $75k-100k, 94.5% for AGIs $100k-200k, 84.6% for AGIs over 200k)
Averages for the 2012 tax year for zip code 75686, filed in 2013:
Average Adjusted Gross Income (AGI) in 2012: $47,969 (Individual Income Tax Returns)
Here:
$47,969
State:
$65,384
Salary/wage: $38,472 (reported on 83.8% of returns)
Here:
$38,472
State:
$52,524
(% of AGI for various income ranges: 78.8% for AGIs below $25k, 82.9% for AGIs $25k-50k, 79.9% for AGIs $50k-75k, 73.2% for AGIs $75k-100k, 70.2% for AGIs $100k-200k, 31.4% for AGIs over 200k)
Taxable interest for individuals: $1,705 (reported on 23.4% of returns)
This zip code:
$1,705
Texas:
$2,372
(% of AGI for various income ranges: 1.1% for AGIs below $25k, 0.8% for AGIs $25k-50k, 0.6% for AGIs $50k-75k, 0.8% for AGIs $75k-100k, 0.9% for AGIs $100k-200k, 0.8% for AGIs over 200k)
Ordinary dividends: $7,443 (reported on 11.0% of returns)
Here:
$7,443
State:
$9,721
(% of AGI for various income ranges: 1.7% for AGIs below $25k, 0.8% for AGIs $25k-50k, 0.5% for AGIs $50k-75k, 1.1% for AGIs $75k-100k, 1.4% for AGIs $100k-200k, 4.0% for AGIs over 200k)
Net capital gain/loss in AGI: +$12,746 (reported on 9.9% of returns)
Here:
+$12,746
State:
+$35,319
(% of AGI for various income ranges: 0.1% for AGIs below $25k, 0.1% for AGIs $25k-50k, 0.6% for AGIs $50k-75k, 1.7% for AGIs $75k-100k, 2.3% for AGIs $100k-200k, 8.6% for AGIs over 200k)
Profit/loss from business: +$14,299 (reported on 15.6% of returns)
Here:
+$14,299
State:
+$13,732
(% of AGI for various income ranges: 6.8% for AGIs below $25k, 3.1% for AGIs $25k-50k, 2.4% for AGIs $50k-75k, 3.5% for AGIs $75k-100k, 5.7% for AGIs $100k-200k, 6.4% for AGIs over 200k)
Taxable individual retirement arrangement distribution: $15,465 (reported on 8.8% of returns)
75686:
$15,465
Texas:
$19,511
(% of AGI for various income ranges: 2.7% for AGIs below $25k, 2.4% for AGIs $25k-50k, 2.0% for AGIs $50k-75k, 3.8% for AGIs $75k-100k, 4.2% for AGIs $100k-200k, 2.3% for AGIs over 200k)
Total itemized deductions: $21,877 (21% of AGI, reported on 15.0% of returns)
Here:
$21,877
State:
$24,724
Here:
20.9% of AGI
State:
15.9% of AGI
(% of AGI for various income ranges: 4.5% for AGIs below $25k, 5.8% for AGIs $25k-50k, 7.8% for AGIs $50k-75k, 7.7% for AGIs $75k-100k, 9.7% for AGIs $100k-200k, 5.9% for AGIs over 200k)
Charity contributions: $7,233 (reported on 11.4% of returns)
Here:
$7,233
State:
$6,808
(% of AGI for various income ranges: 0.5% for AGIs below $25k, 1.0% for AGIs $25k-50k, 1.5% for AGIs $50k-75k, 1.8% for AGIs $75k-100k, 2.4% for AGIs $100k-200k, 2.7% for AGIs over 200k)
Taxes paid: $4,508 (reported on 14.7% of returns)
75686:
$4,508
State:
$6,921
(% of AGI for various income ranges: 0.8% for AGIs below $25k, 1.0% for AGIs $25k-50k, 1.4% for AGIs $50k-75k, 1.7% for AGIs $75k-100k, 2.4% for AGIs $100k-200k, 1.1% for AGIs over 200k)
Earned income credit: $2,597 (reported on 27.0% of returns)
Here:
$2,597
State:
$2,570
(% of AGI for various income ranges: 8.8% for AGIs below $25k, 1.7% for AGIs $25k-50k)
Percentage of individuals using paid preparers for their 2012 taxes: 59.0%
Here:
59%
State:
51%
(% for various income ranges: 55.6% for AGIs below $25k, 59.9% for AGIs $25k-50k, 64.2% for AGIs $50k-75k, 57.9% for AGIs $75k-100k, 68.8% for AGIs $100k-200k, 75.0% for AGIs over 200k)
Averages for the 2004 tax year for zip code 75686, filed in 2005:
Average Adjusted Gross Income (AGI) in 2004: $34,815 (Individual Income Tax Returns)
Here:
$34,815
State:
$47,881
Salary/wage: $31,868 (reported on 83.8% of returns)
Here:
$31,868
State:
$41,947
(% of AGI for various income ranges: 114.5% for AGIs below $10k, 84.2% for AGIs $10k-25k, 83.1% for AGIs $25k-50k, 80.1% for AGIs $50k-75k, 77.5% for AGIs $75k-100k, 58.9% for AGIs over 100k)
Taxable interest for individuals: $2,437 (reported on 31.7% of returns)
This zip code:
$2,437
Texas:
$2,255
(% of AGI for various income ranges: 7.0% for AGIs below $10k, 1.9% for AGIs $10k-25k, 1.6% for AGIs $25k-50k, 2.0% for AGIs $50k-75k, 2.3% for AGIs $75k-100k, 2.7% for AGIs over 100k)
Taxable dividends: $3,139 (reported on 13.9% of returns)
Here:
$3,139
State:
$4,261
(% of AGI for various income ranges: 2.5% for AGIs below $10k, 0.5% for AGIs $10k-25k, 0.8% for AGIs $25k-50k, 0.8% for AGIs $50k-75k, 0.6% for AGIs $75k-100k, 2.8% for AGIs over 100k)
Net capital gain/loss: +$9,929 (reported on 13.9% of returns)
Here:
+$9,929
State:
+$16,110
(% of AGI for various income ranges: -1.5% for AGIs below $10k, 0.4% for AGIs $10k-25k, 1.0% for AGIs $25k-50k, 1.1% for AGIs $50k-75k, 3.0% for AGIs $75k-100k, 12.5% for AGIs over 100k)
Profit/loss from business: +$8,441 (reported on 16.6% of returns)
Here:
+$8,441
State:
+$11,013
(% of AGI for various income ranges: -5.4% for AGIs below $10k, 5.0% for AGIs $10k-25k, 3.2% for AGIs $25k-50k, 2.0% for AGIs $50k-75k, 3.3% for AGIs $75k-100k, 7.1% for AGIs over 100k)
IRA payment deduction: $3,124 (reported on 2.0% of returns)
75686:
$3,124
Texas:
$3,120
(% of AGI for various income ranges: 0.1% for AGIs $10k-25k, 0.1% for AGIs $25k-50k, 0.3% for AGIs $50k-75k, 0.3% for AGIs $75k-100k, 0.1% for AGIs over 100k)
Self-employed pension: $12,909 (reported on 0.2% of returns)
Here:
$12,909
Texas:
$16,401
Total itemized deductions: $20,438 (24% of AGI, reported on 14.4% of returns)
Here:
$20,438
State:
$19,631
Here:
24.2% of AGI
State:
18.9% of AGI
(% of AGI for various income ranges: 4.7% for AGIs below $10k, 3.4% for AGIs $10k-25k, 7.1% for AGIs $25k-50k, 8.2% for AGIs $50k-75k, 9.9% for AGIs $75k-100k, 13.0% for AGIs over 100k)
Charity contributions deductions: $5,552 (7% of AGI, reported on 11.6% of returns)
Here:
$5,552
State:
$4,753
Here:
6.6% of AGI
State:
4.2% of AGI
(% of AGI for various income ranges: 0.5% for AGIs below $10k, 0.5% for AGIs $10k-25k, 1.4% for AGIs $25k-50k, 1.6% for AGIs $50k-75k, 2.5% for AGIs $75k-100k, 3.1% for AGIs over 100k)
Total tax: $5,132 (reported on 63.0% of returns)
75686:
$5,132
State:
$9,058
(% of AGI for various income ranges: 3.7% for AGIs below $10k, 3.0% for AGIs $10k-25k, 5.8% for AGIs $25k-50k, 8.8% for AGIs $50k-75k, 11.0% for AGIs $75k-100k, 17.0% for AGIs over 100k)
Earned income credit: $2,081 (reported on 29.0% of returns)
Here:
$2,081
State:
$2,024
Percentage of individuals using paid preparers for their 2004 taxes: 67.8%
Here:
68%
State:
57%
(% for various income ranges: 62.6% for AGIs below $10k, 71.2% for AGIs $10k-25k, 68.9% for AGIs $25k-50k, 64.2% for AGIs $50k-75k, 66.7% for AGIs $75k-100k, 73.3% for AGIs over 100k)
Likely homosexual households (counted as self-reported same-sex unmarried-partner households)
Lesbian couples: 0.1% of all households
Gay men: 0.0% of all households
Household received Food Stamps/SNAP in the past 12 months: 931 Household did not receive Food Stamps/SNAP in the past 12 months: 4,057
Women who had a birth in the past 12 months: 46 (24 now married, 21 unmarried) Women who did not have a birth in the past 12 months: 2,981 (1,114 now married, 1,873 unmarried)
Housing units in zip code 75686 with a mortgage: 1,678 (22 second mortgage, 24 both second mortgage and home equity loan) Houses without a mortgage: 56
Median monthly owner costs for units with a mortgage: $1,305 Median monthly owner costs for units without a mortgage: $482
Residents with income below the poverty level in 2022:
This zip code:
22.8%
Whole state:
14.0%
Residents with income below 50% of the poverty level in 2022:
This zip code:
14.8%
Whole state:
7.4%
Median number of rooms in houses and condos:
Here:
5.5
State:
6.3
Median number of rooms in apartments:
Here:
4.6
State:
4.0
Notable locations in this zip code not listed on our city pages
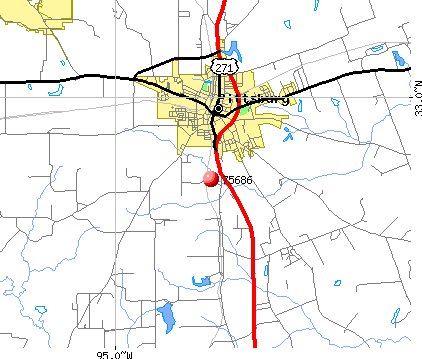
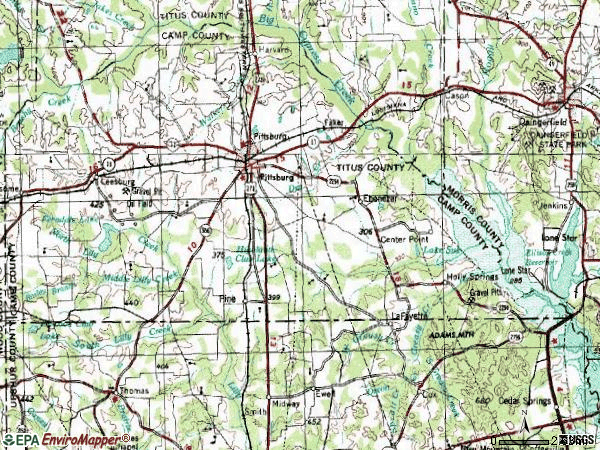
Notable locations in zip code 75686: Center Point (A), County Line (B), Faker (C), Ferndale Lake Club (D), Pittsburg-Camp County Museum (E), Rocky Mound Volunteer Fire Department (F), Pittsburg Fire Department (G), Lafayette Volunteer Fire Department (H), Thunderbird Volunteer Fire Department (I), Texas Forest Service Pittsburg Office (J). Display/hide their locations on the map
Churches in zip code 75686 include: Reeves Chapel (A), Rocky Mound Church (B), Shady Grove Church (C), Spring Hill Church (D), Union Chapel (E), Deishler John Freedom Fellowship Church (F), First Presbyterian Church (G), United Pentecostal Church (H), Church of God (I). Display/hide their locations on the map
Cemeteries: Smart Cemetery (1), Bolton Cemetery (2), Brantley Cemetery (3), North Chapel Cemetery (4), Oak Grove Cemetery (5), Pleasant Grove Cemetery (6), Handsome Cemetery (7). Display/hide their locations on the map
Lakes and reservoirs: Big Brushy Lake (A), Rafe Lake (B), Dunagan Lake (C), Hopkins Lake (D), Little Brushy Lake (E), Flanagan Lake (F), Tiddle Lake (G), Twin Lakes (H). Display/hide their locations on the map
Streams, rivers, and creeks: Williamson Creek (A), Stoker Branch (B), Sparks Branch (C), South Lilly Creek (D), Roberts Branch (E), Prairie Branch (F), Picket Spring Branch (G), Perry Creek (H), North Lilly Creek (I). Display/hide their locations on the map
In group quarters: 68 (-1 institutionalized population)
Size of family households: 1,749 2-persons, 592 3-persons, 546 4-persons, 261 5-persons, 104 6-persons, 161 7-or-more-persons
Size of nonfamily households: 1,181 1-person, 368 2-persons, 33 7-or-more-persons
2,232 married couples with children.
747 single-parent households (107 men, 640 women).
82.6% of residents of 75686 zip code speak English at home.
16.0% of residents speak Spanish at home (64% very well, 13% well, 19% not well, 4% not at all).
0.6% of residents speak other Indo-European language at home (76% very well, 24% not well).
0.2% of residents speak Asian or Pacific Island language at home (100% very well).
0.3% of residents speak other language at home (100% well).
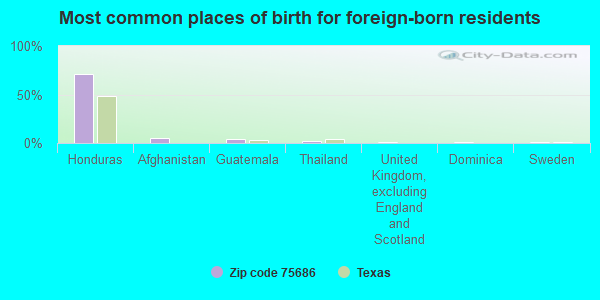
Foreign born population: 1,222 (9.0%) (30.8% of them are naturalized citizens)
This zip code:
9.0%
Whole state:
17.2%
71%Honduras
5%Afghanistan
4%Guatemala
2%Thailand
1%United Kingdom, excluding England and Scotland
1%Dominica
1%Sweden
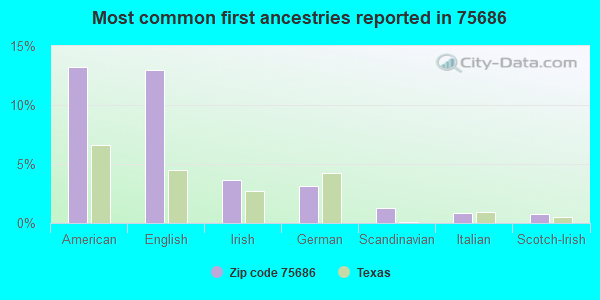
13%American
13%English
4%Irish
3%German
1%Scandinavian
1%Italian
1%Scotch-Irish
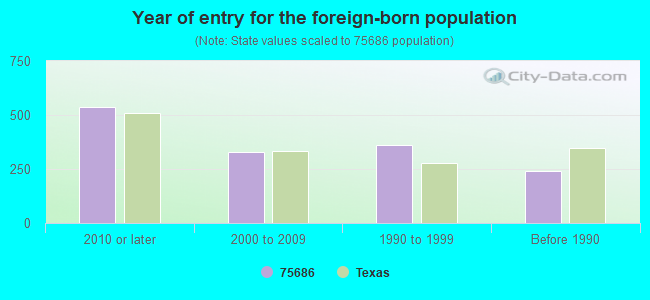
Year of entry for the foreign-born population
5382010 or later
3282000 to 2009
3601990 to 1999
243Before 1990
Facilities with environmental interests located in this zip code:
ANDRITZ-RUTHNER INC (110 DICKSON ST in PITTSBURG, TX)
Conditionally Exempt Small Quantity Generators, less than 100 kg/month of hazardous waste (Resource Conservation and Recovery Act (tracking hazardous waste)) Organizations: ANDRITZ RUTHNER INC (CONTACT/OPERATOR)
AMERICAN ELECTRIC POWER WELSH POWER PLANT (FM 1735 - STOREROOM 65 in PITTSBURG, TX)
CRITERIA AND HAZARDOUS AIR POLLUTANT INVENTORY (Inventory of air pollution sources) Business SIC classification: ELECTRIC SERVICES
Housing units lacking complete plumbing facilities: 4.0% Housing units lacking complete kitchen facilities: 1.9%
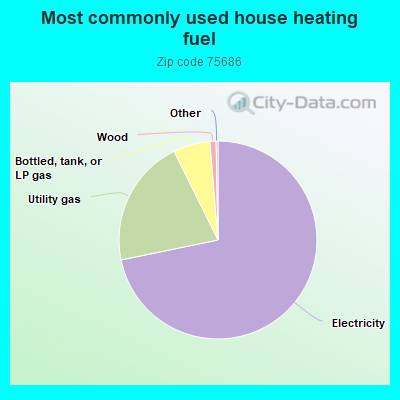
71.7%Electricity
20.9%Utility gas
6.0%Bottled, tank, or LP gas
1.0%Wood
Population in 1990: 12,871.
Place of birth for U.S.-born residents:
This state: 9,587
Northeast: 248
Midwest: 535
South: 1,038
West: 604
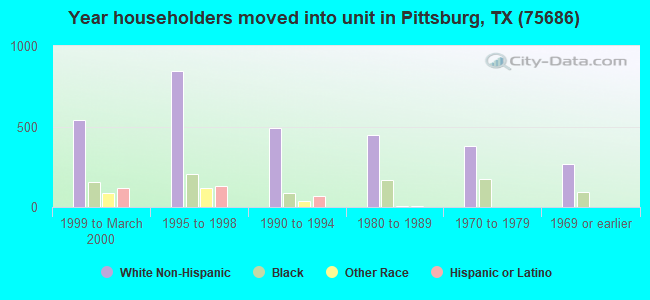
55% of the 75686 zip code residents lived in the same house 5 years ago. Out of people who lived in different houses, 51% lived in this county. Out of people who lived in different counties, 50% lived in Texas.
87% of the 75686 zip code residents lived in the same house 1 year ago. Out of people who lived in different houses, 21% moved from this county. Out of people who lived in different houses, 56% moved from different county within same state. Out of people who lived in different houses, 24% moved from different state. Out of people who lived in different houses, 3% moved from abroad.
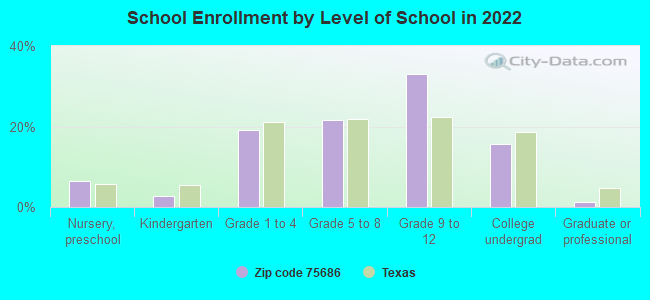
Private vs. public school enrollment:
Students in private schools in grades 1 to 8 (elementary and middle school): 147
Here:
10.2%
Texas:
8.8%
Students in private schools in grades 9 to 12 (high school): 219
Here:
18.7%
Texas:
8.0%
Students in private undergraduate colleges: 34
Here:
6.2%
Texas:
16.2%
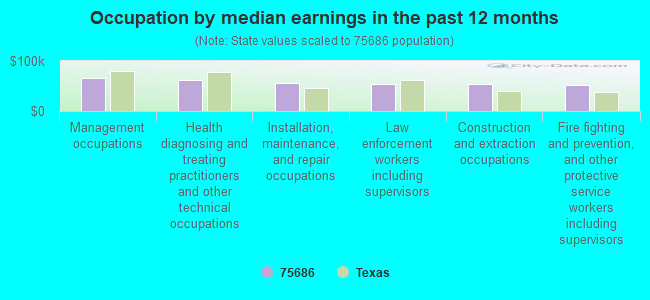
Occupation by median earnings in the past 12 months ($)
66,077Management occupations
62,604Health diagnosing and treating practitioners and other technical occupations
56,793Installation, maintenance, and repair occupations
54,664Law enforcement workers including supervisors
54,634Construction and extraction occupations
51,074Fire fighting and prevention, and other protective service workers including supervisors
Companies with federal contracts located in this zip code:
RICKY T JONES (2816 FM 1521 in PITTSBURG, TX; small business) : $43,150 in 9 contractsfrom 2003 to 2005
Contracts for Custodial Janitorial Services, Guard Services by Army, U.S. Army Corps of Engineers - civil program financing only Signed by year:2000: $0; 2001: $0; 2002: $0; 2003: $9,700; 2004: $8,550; 2005: $24,900; 2006: $0.
Biggest contracts:
$12,450 with Army for Custodial Janitorial Services. Signed on 2005-02-17. Completion date: 2004-09-30.
$12,450 with U.S. Army Corps of Engineers - civil program financing only for Custodial Janitorial Services. Signed on 2005-02-17. Completion date: 2004-09-30.
$7,800 with Army for Guard Services. Signed on 2003-10-21. Completion date: 2004-09-30.
$5,950 with Army for Custodial Janitorial Services. Signed on 2004-01-21. Completion date: 2004-09-30.
NICKCO RECYCLING, INC (3363 FM 3042 in PITTSBURG, TX) : $3,585 in 5 contractsin 2004
Contracts for Waste Treatment and Storage by Defense Logistics Agency Signed by year:2000: $0; 2001: $0; 2002: $0; 2003: $0; 2004: $3,585; 2005: $0; 2006: $0.
Biggest contracts:
$3,475 with Defense Logistics Agency for Waste Treatment and Storage. Signed on 2004-11-15. Completion date: 2005-01-13.
$640, same as above.Signed on 2004-11-15. Completion date: 2005-01-13.
$360, same as above.Signed on 2004-11-15. Completion date: 2005-01-13.
$0, same as above.Signed on 2004-11-14. Completion date: 2004-11-14.
JAMES D GODWIN (RT 5 BOX 255 in PITTSBURG, TX; small business)
$3,060 with Army for Recreational Services. Signed on 2003-10-28. Completion date: 2004-02-29.
Top industries in this zip code by the number of employees in 2005:
Management of Companies and Enterprises: Corporate, Subsidiary, and Regional Managing Offices (500-999 employees: 1 establishment, 20-49 employees: 1 establishment)
Utilities: Electric Power Distribution (100-249: 1, 5-9: 1, 1-4: 1)
Health Care and Social Assistance: General Medical and Surgical Hospitals (100-249: 1)
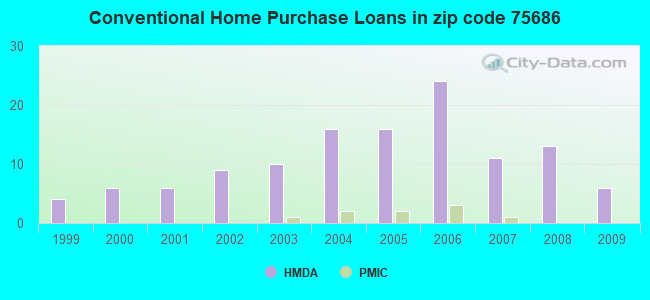
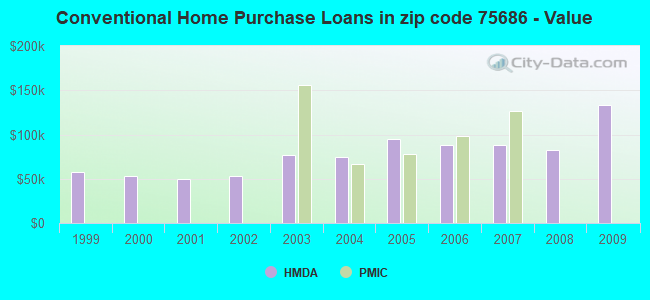
Detailed PMIC statistics for the following Tracts:9502.00
2002 - 2018 National Fire Incident Reporting System (NFIRS) incidents
According to the data from the years 2002 - 2018 the average number of fires per year is 141. The highest number of reported fire incidents - 205 took place in 2011, and the least - 84 in 2009. The data has a dropping trend.
When looking into fire subcategories, the most incidents belonged to: Outside Fires (63.0%), and Structure Fires (23.6%).
Fire incident types reported to NFIRS in Zip Code 75686
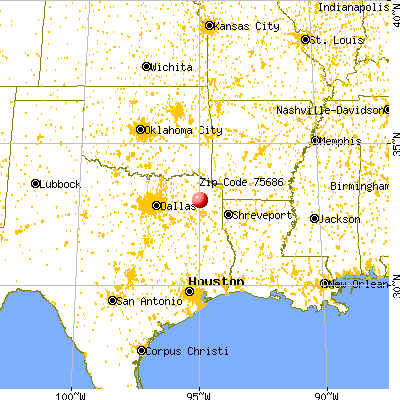


 Nearest zip codes: 75451, 75644, 75638, 75493, 75480, 75455.
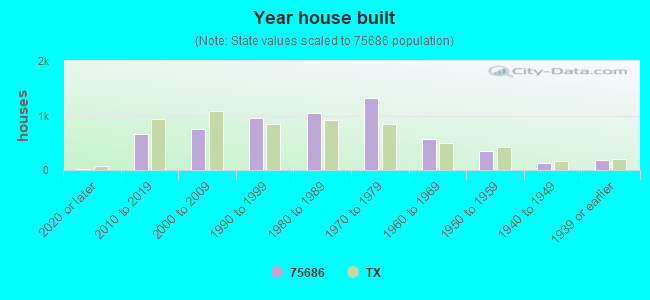


 According to the data from the years 2002 - 2018 the average number of fires per year is 141. The highest number of reported fire incidents - 205 took place in 2011, and the least - 84 in 2009. The data has a dropping trend.
 When looking into fire subcategories, the most incidents belonged to: Outside Fires (63.0%), and Structure Fires (23.6%).