Estimated zip code population in 2022: 5,176 Zip code population in 2010: 6,036 Zip code population in 2000: 6,215
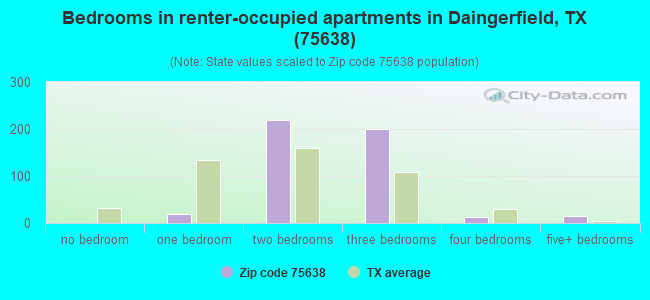
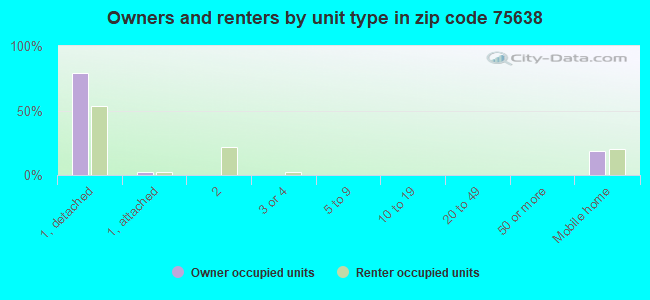
Houses and condos: 2,414 Renter-occupied apartments: 476
% of renters here:
23%
State:
38%
March 2022 cost of living index in zip code 75638: 78.1 (low, U.S. average is 100)
Land area: 88.6 sq. mi. Water area: 2.8 sq. mi.
Population density: 58 people per square mile
(very low).
OSM Map
General Map
Google Map
MSN Map
OSM Map
General Map
Google Map
MSN Map
OSM Map
General Map
Google Map
MSN Map
OSM Map
General Map
Google Map
MSN Map
Please wait while loading the map...
Real estate property taxes paid for housing units in 2022:
This zip code:
0.9% ($1,059)
Texas:
1.5% ($4,050)
Median real estate property taxes paid for housing units with mortgages in 2022: $1,875 (0.8%) Median real estate property taxes paid for housing units with no mortgage in 2022: $894 (0.9%)
Averages for the 2020 tax year for zip code 75638, filed in 2021:
Average Adjusted Gross Income (AGI) in 2020: $51,545 (Individual Income Tax Returns)
Here:
$51,545
State:
$77,054
Salary/wage: $39,919 (reported on 83.8% of returns)
Here:
$39,919
State:
$62,766
(% of AGI for various income ranges: 1451.4% for AGIs below $25k, 3741.5% for AGIs $25k-50k, 6365.0% for AGIs $50k-75k, 9483.3% for AGIs $75k-100k, 14908.2% for AGIs $100k-200k)
Taxable interest for individuals: $2,262 (reported on 22.2% of returns)
This zip code:
$2,262
Texas:
$2,665
(% of AGI for various income ranges: 13.3% for AGIs below $25k, 24.3% for AGIs $25k-50k, 51.8% for AGIs $50k-75k, 35.8% for AGIs $75k-100k, 93.6% for AGIs $100k-200k)
Ordinary dividends: $4,233 (reported on 9.0% of returns)
Here:
$4,233
State:
$10,044
(% of AGI for various income ranges: 6.3% for AGIs below $25k, 30.0% for AGIs $25k-50k, 89.1% for AGIs $50k-75k, 42.5% for AGIs $75k-100k, 392.7% for AGIs $100k-200k)
Net capital gain/loss in AGI: +$8,757 (reported on 9.8% of returns)
Here:
+$8,757
State:
+$39,590
(% of AGI for various income ranges: 0.8% for AGIs below $25k, 8.9% for AGIs $25k-50k, 104.1% for AGIs $50k-75k, 28.3% for AGIs $75k-100k, 1542.7% for AGIs $100k-200k)
Profit/loss from business: +$3,292 (reported on 15.8% of returns)
Here:
+$3,292
State:
+$10,888
(% of AGI for various income ranges: 10.7% for AGIs $25k-50k, 57.3% for AGIs $50k-75k, 60.0% for AGIs $75k-100k, 947.3% for AGIs $100k-200k)
Taxable individual retirement arrangement distribution: $16,293 (reported on 6.4% of returns)
75638:
$16,293
Texas:
$24,740
(% of AGI for various income ranges: 28.3% for AGIs below $25k, 102.0% for AGIs $25k-50k, 151.8% for AGIs $50k-75k, 366.7% for AGIs $75k-100k, 821.8% for AGIs $100k-200k)
Total itemized deductions: $47,517 (reported on 2.6% of returns)
Here:
$47,517
State:
$40,428
(% of AGI for various income ranges: 234.8% for AGIs $25k-50k, 1439.1% for AGIs $100k-200k)
Charity contributions: $9,750 (reported on 1.7% of returns)
Here:
$9,750
State:
$18,201
(% of AGI for various income ranges: 25.8% for AGIs below $25k, 161.7% for AGIs $75k-100k)
Taxes paid: $4,320 (reported on 2.1% of returns)
75638:
$4,320
State:
$7,821
(% of AGI for various income ranges: 14.6% for AGIs $25k-50k, 124.5% for AGIs $100k-200k)
Earned income credit: $2,633 (reported on 28.6% of returns)
Here:
$2,633
State:
$2,584
(% of AGI for various income ranges: 159.5% for AGIs below $25k, 102.2% for AGIs $25k-50k)
Percentage of individuals using paid preparers for their 2020 taxes: 93.2%
Here:
93%
State:
92%
(% for various income ranges: 93.9% for AGIs below $25k, 94.1% for AGIs $25k-50k, 90.0% for AGIs $50k-75k, 94.1% for AGIs $75k-100k, 88.9% for AGIs $100k-200k, 100.0% for AGIs over 200k)
Averages for the 2012 tax year for zip code 75638, filed in 2013:
Average Adjusted Gross Income (AGI) in 2012: $45,908 (Individual Income Tax Returns)
Here:
$45,908
State:
$65,384
Salary/wage: $37,895 (reported on 83.3% of returns)
Here:
$37,895
State:
$52,524
(% of AGI for various income ranges: 80.5% for AGIs below $25k, 82.3% for AGIs $25k-50k, 79.2% for AGIs $50k-75k, 78.8% for AGIs $75k-100k, 74.6% for AGIs $100k-200k, 25.3% for AGIs over 200k)
Taxable interest for individuals: $1,251 (reported on 27.0% of returns)
This zip code:
$1,251
Texas:
$2,372
(% of AGI for various income ranges: 0.9% for AGIs below $25k, 1.0% for AGIs $25k-50k, 0.8% for AGIs $50k-75k, 0.5% for AGIs $75k-100k, 0.6% for AGIs $100k-200k, 0.6% for AGIs over 200k)
Ordinary dividends: $4,192 (reported on 11.2% of returns)
Here:
$4,192
State:
$9,721
(% of AGI for various income ranges: 0.6% for AGIs below $25k, 0.9% for AGIs $25k-50k, 0.7% for AGIs $50k-75k, 0.4% for AGIs $75k-100k, 4.0% for AGIs $100k-200k)
Net capital gain/loss in AGI: +$16,426 (reported on 8.2% of returns)
Here:
+$16,426
State:
+$35,319
(% of AGI for various income ranges: 0.2% for AGIs below $25k, 0.3% for AGIs $25k-50k, 0.5% for AGIs $75k-100k, 19.1% for AGIs $100k-200k)
Profit/loss from business: +$8,591 (reported on 14.6% of returns)
Here:
+$8,591
State:
+$13,732
(% of AGI for various income ranges: 8.3% for AGIs below $25k, 1.8% for AGIs $25k-50k, 1.0% for AGIs $50k-75k, 1.9% for AGIs $75k-100k, 5.4% for AGIs $100k-200k)
Taxable individual retirement arrangement distribution: $10,965 (reported on 9.9% of returns)
75638:
$10,965
Texas:
$19,511
(% of AGI for various income ranges: 2.6% for AGIs below $25k, 4.1% for AGIs $25k-50k, 2.4% for AGIs $50k-75k, 2.3% for AGIs $75k-100k, 2.9% for AGIs $100k-200k)
Total itemized deductions: $21,579 (19% of AGI, reported on 12.4% of returns)
Here:
$21,579
State:
$24,724
Here:
18.8% of AGI
State:
15.9% of AGI
(% of AGI for various income ranges: 2.4% for AGIs below $25k, 6.4% for AGIs $25k-50k, 5.7% for AGIs $50k-75k, 6.6% for AGIs $75k-100k, 7.2% for AGIs $100k-200k, 6.3% for AGIs over 200k)
Charity contributions: $7,061 (reported on 9.9% of returns)
Here:
$7,061
State:
$6,808
(% of AGI for various income ranges: 1.4% for AGIs $25k-50k, 1.6% for AGIs $50k-75k, 1.4% for AGIs $75k-100k, 2.6% for AGIs $100k-200k, 1.9% for AGIs over 200k)
Taxes paid: $3,585 (reported on 11.6% of returns)
75638:
$3,585
State:
$6,921
(% of AGI for various income ranges: 0.3% for AGIs below $25k, 0.8% for AGIs $25k-50k, 0.8% for AGIs $50k-75k, 1.2% for AGIs $75k-100k, 1.3% for AGIs $100k-200k, 1.0% for AGIs over 200k)
Earned income credit: $2,424 (reported on 30.0% of returns)
Here:
$2,424
State:
$2,570
(% of AGI for various income ranges: 9.5% for AGIs below $25k, 1.5% for AGIs $25k-50k)
Percentage of individuals using paid preparers for their 2012 taxes: 53.2%
Here:
53%
State:
51%
(% for various income ranges: 47.7% for AGIs below $25k, 51.7% for AGIs $25k-50k, 62.1% for AGIs $50k-75k, 60.0% for AGIs $75k-100k, 75.0% for AGIs $100k-200k, 66.7% for AGIs over 200k)
Averages for the 2004 tax year for zip code 75638, filed in 2005:
Average Adjusted Gross Income (AGI) in 2004: $33,597 (Individual Income Tax Returns)
Here:
$33,597
State:
$47,881
Salary/wage: $31,884 (reported on 84.0% of returns)
Here:
$31,884
State:
$41,947
(% of AGI for various income ranges: 144.2% for AGIs below $10k, 80.5% for AGIs $10k-25k, 87.5% for AGIs $25k-50k, 77.3% for AGIs $50k-75k, 77.6% for AGIs $75k-100k, 65.4% for AGIs over 100k)
Taxable interest for individuals: $1,956 (reported on 36.5% of returns)
This zip code:
$1,956
Texas:
$2,255
(% of AGI for various income ranges: 7.6% for AGIs below $10k, 2.8% for AGIs $10k-25k, 1.2% for AGIs $25k-50k, 1.4% for AGIs $50k-75k, 1.4% for AGIs $75k-100k, 3.9% for AGIs over 100k)
Taxable dividends: $2,217 (reported on 13.9% of returns)
Here:
$2,217
State:
$4,261
(% of AGI for various income ranges: 1.8% for AGIs below $10k, 1.1% for AGIs $10k-25k, 0.5% for AGIs $25k-50k, 0.6% for AGIs $50k-75k, 1.2% for AGIs $75k-100k, 1.6% for AGIs over 100k)
Net capital gain/loss: +$6,710 (reported on 12.5% of returns)
Here:
+$6,710
State:
+$16,110
(% of AGI for various income ranges: -2.0% for AGIs below $10k, 0.2% for AGIs $10k-25k, 0.2% for AGIs $25k-50k, 1.9% for AGIs $50k-75k, 3.5% for AGIs $75k-100k, 8.5% for AGIs over 100k)
Profit/loss from business: +$8,020 (reported on 15.2% of returns)
Here:
+$8,020
State:
+$11,013
(% of AGI for various income ranges: -3.3% for AGIs below $10k, 4.1% for AGIs $10k-25k, 1.9% for AGIs $25k-50k, 1.6% for AGIs $50k-75k, 1.7% for AGIs $75k-100k, 10.6% for AGIs over 100k)
IRA payment deduction: $2,458 (reported on 1.1% of returns)
75638:
$2,458
Texas:
$3,120
Total itemized deductions: $16,525 (24% of AGI, reported on 11.6% of returns)
Here:
$16,525
State:
$19,631
Here:
23.5% of AGI
State:
18.9% of AGI
(% of AGI for various income ranges: 4.7% for AGIs $10k-25k, 5.3% for AGIs $25k-50k, 6.4% for AGIs $50k-75k, 6.2% for AGIs $75k-100k, 6.3% for AGIs over 100k)
Charity contributions deductions: $5,128 (7% of AGI, reported on 9.4% of returns)
Here:
$5,128
State:
$4,753
Here:
6.8% of AGI
State:
4.2% of AGI
(% of AGI for various income ranges: 0.6% for AGIs $10k-25k, 0.9% for AGIs $25k-50k, 1.2% for AGIs $50k-75k, 1.5% for AGIs $75k-100k, 3.3% for AGIs over 100k)
Total tax: $5,017 (reported on 63.9% of returns)
75638:
$5,017
State:
$9,058
(% of AGI for various income ranges: 3.3% for AGIs below $10k, 2.9% for AGIs $10k-25k, 6.1% for AGIs $25k-50k, 8.9% for AGIs $50k-75k, 11.3% for AGIs $75k-100k, 20.8% for AGIs over 100k)
Earned income credit: $1,976 (reported on 27.2% of returns)
Here:
$1,976
State:
$2,024
Percentage of individuals using paid preparers for their 2004 taxes: 61.6%
Here:
62%
State:
57%
(% for various income ranges: 53.2% for AGIs below $10k, 65.2% for AGIs $10k-25k, 62.5% for AGIs $25k-50k, 62.4% for AGIs $50k-75k, 67.0% for AGIs $75k-100k, 64.9% for AGIs over 100k)
Household received Food Stamps/SNAP in the past 12 months: 315 Household did not receive Food Stamps/SNAP in the past 12 months: 1,799
Women who had a birth in the past 12 months: 48 (12 now married, 34 unmarried) Women who did not have a birth in the past 12 months: 1,103 (373 now married, 733 unmarried)
Housing units in zip code 75638 with a mortgage: 456 (36 second mortgage, 30 both second mortgage and home equity loan) Median monthly owner costs for units with a mortgage: $1,226 Median monthly owner costs for units without a mortgage: $360
Residents with income below the poverty level in 2022:
This zip code:
19.9%
Whole state:
14.0%
Residents with income below 50% of the poverty level in 2022:
This zip code:
15.8%
Whole state:
7.4%
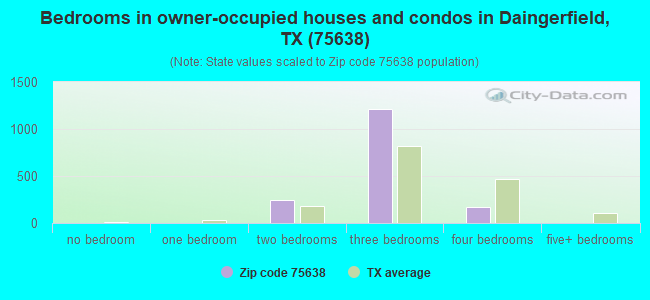
Median number of rooms in houses and condos:
Here:
5.8
State:
6.3
Median number of rooms in apartments:
Here:
5.2
State:
4.0
Notable locations in this zip code not listed on our city pages
Notable locations in zip code 75638: Morris County Courthouse (A), Jenkins Volunteer Fire Department (B), Rocky Branch Volunteer Fire Department (C), Daingerfield Volunteer Fire Department / Emergency Medical Service (D), Old Morris County Courthouse (E). Display/hide their locations on the map
Churches in zip code 75638 include: Snow Hill Church (A), County Line Church (B), Presbyterian Church Cumberland (C), First United Methodist Church - Daingerfield (D), Fellowship Baptist Church (E), New Jerusalem Church (F). Display/hide their locations on the map
Cemeteries: Slaton Cemetery (1), Bethlehem Cemetery (2), South Union Cemetery (3), Clark Cemetery (4), Hall Cemetery (5), Jones Cemetery (6), Lewis Cemetery (7). Display/hide their locations on the map
Lakes and reservoirs: Slaton Lake (A), Clear Lake (B), Clayton Lake (C), Ellison Creek Reservoir (D), Jerome Wolfson Lake (E), Daingerfield State Park Lake (F), Minor Lake (G). Display/hide their locations on the map
Streams, rivers, and creeks: Prairie Creek (A), Peacock Creek (B), Whitmore Branch (C), Flanagan Run (D), Burton Slough (E), Brutons Creek (F), Boggy Creek (G). Display/hide their locations on the map
In group quarters: 87 (-1 institutionalized population)
Size of family households: 799 2-persons, 282 3-persons, 171 4-persons, 119 5-persons, 49 6-persons, 41 7-or-more-persons
Size of nonfamily households: 628 1-person, 25 2-persons
574 married couples with children.
468 single-parent households (128 men, 340 women).
89.1% of residents of 75638 zip code speak English at home.
8.7% of residents speak Spanish at home (86% very well, 13% well, 1% not well).
1.1% of residents speak other Indo-European language at home (77% very well, 23% well).
1.3% of residents speak Asian or Pacific Island language at home (54% very well, 46% not well).
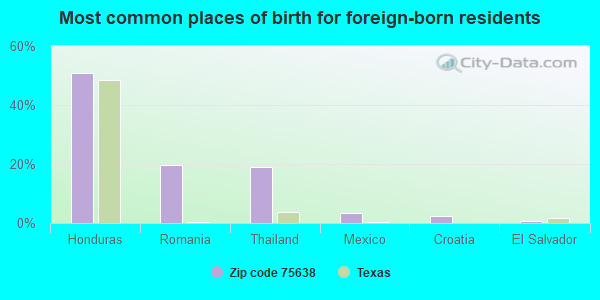
Foreign born population: 171 (3.3%) (51.4% of them are naturalized citizens)
This zip code:
3.3%
Whole state:
17.2%
51%Honduras
20%Romania
19%Thailand
4%Mexico
2%Croatia
1%El Salvador
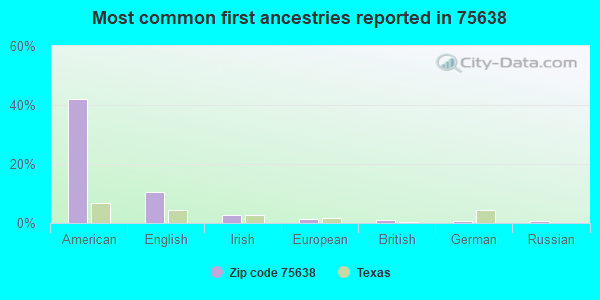
42%American
11%English
3%Irish
1%European
1%British
1%German
1%Russian
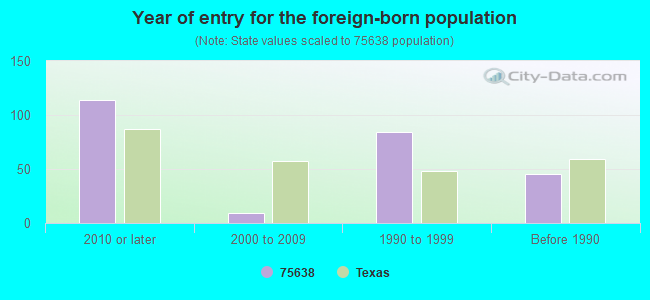
Year of entry for the foreign-born population
1142010 or later
92000 to 2009
841990 to 1999
45Before 1990
Facilities with environmental interests located in this zip code:
ATLAS ROOFING CORP. (1100 GEORGIA PACIFIC DR. in DAINGERFIELD, TX)
AIR MINOR (AIRS/AFS) CRITERIA AND HAZARDOUS AIR POLLUTANT INVENTORY (Inventory of air pollution sources) TRI REPORTER (Tracking of toxic chemicals releasing facilities) Business SIC classification: ASPHALT FELTS AND COATINGS
Housing units lacking complete plumbing facilities: 7.6% Housing units lacking complete kitchen facilities: 9.6%
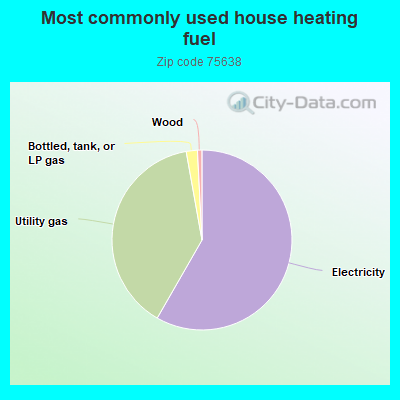
58.3%Electricity
38.9%Utility gas
2.0%Bottled, tank, or LP gas
0.8%Wood
Population in 1990: 5,614. Population change in the 1990s: +601 (+10.7%).
Place of birth for U.S.-born residents:
This state: 3,854
Northeast: 8
Midwest: 272
South: 525
West: 240
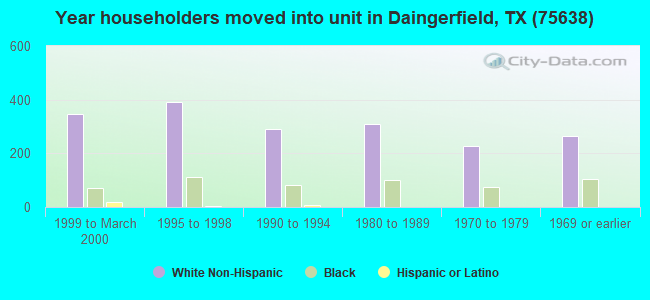
62% of the 75638 zip code residents lived in the same house 5 years ago. Out of people who lived in different houses, 54% lived in this county. Out of people who lived in different counties, 50% lived in Texas.
96% of the 75638 zip code residents lived in the same house 1 year ago. Out of people who lived in different houses, 56% moved from this county. Out of people who lived in different houses, 38% moved from different county within same state. Out of people who lived in different houses, 2% moved from different state. Out of people who lived in different houses, 8% moved from abroad.
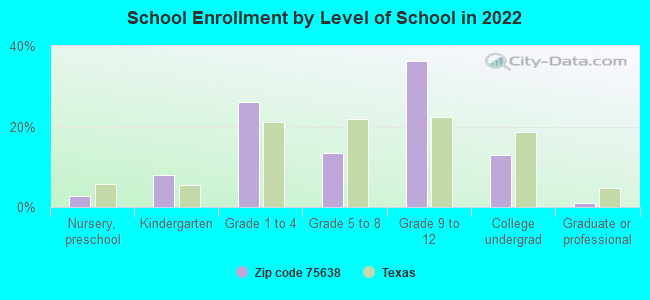
Private vs. public school enrollment:
Students in private schools in grades 1 to 8 (elementary and middle school): 56
Here:
12.3%
Texas:
8.8%
Students in private schools in grades 9 to 12 (high school): 54
Here:
13.0%
Texas:
8.0%
Students in private undergraduate colleges: 6
Here:
4.6%
Texas:
16.2%
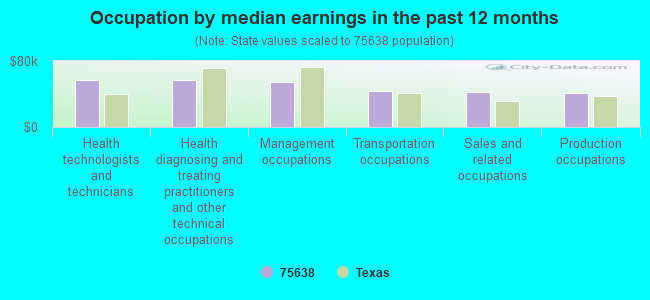
Occupation by median earnings in the past 12 months ($)
57,205Health technologists and technicians
56,391Health diagnosing and treating practitioners and other technical occupations
54,471Management occupations
43,800Transportation occupations
42,073Sales and related occupations
41,309Production occupations
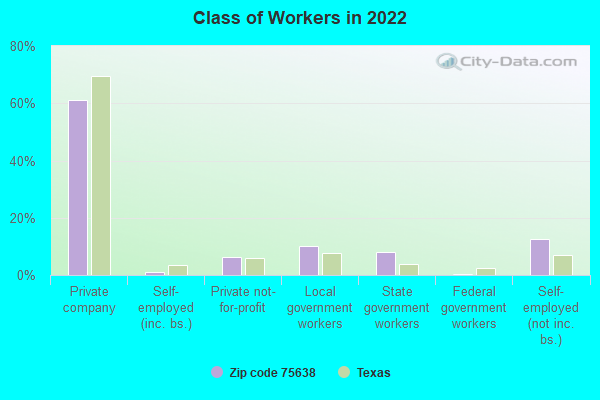
Top industries in this zip code by the number of employees in 2005:
Professional, Scientific, and Technical Services: Offices of Lawyers (50-99: 1, 1-4: 1)
Health Care and Social Assistance: Nursing Care Facilities (50-99: 1)
Other Services (except Public Administration): Religious Organizations (20-49: 1, 1-4: 6)
Finance and Insurance: Commercial Banking (20-49: 1, 5-9: 1)
Wholesale Trade: Metal Service Centers and Other Metal Merchant Wholesalers (20-49: 1)
People in group quarters in 2010:
73 people in nursing facilities/skilled-nursing facilities
29 people in local jails and other municipal confinement facilities
People in group quarters in 2000:
69 people in nursing homes
27 people in local jails and other confinement facilities (including police lockups)
Fatal accident statistics in 2014:
Fatal accident count: 1
Vehicles involved in fatal accidents: 1
Fatal accidents caused by drunken drivers: 0
Fatalities: 1
Persons involved in fatal accidents: 1
Pedestrians involved in fatal accidents: 0
Fatal accident statistics in 2011:
Fatal accident count: 4
Vehicles involved in fatal accidents: 5
Fatal accidents caused by drunken drivers: 1
Fatalities: 4
Persons involved in fatal accidents: 6
Pedestrians involved in fatal accidents: 1
2002 - 2018 National Fire Incident Reporting System (NFIRS) incidents
According to the data from the years 2002 - 2018 the average number of fires per year is 51. The highest number of fires - 108 took place in 2005, and the least - 19 in 2013. The data has a declining trend.
When looking into fire subcategories, the most reports belonged to: Outside Fires (52.6%), and Structure Fires (35.6%).
Fire incident types reported to NFIRS in Zip Code 75638

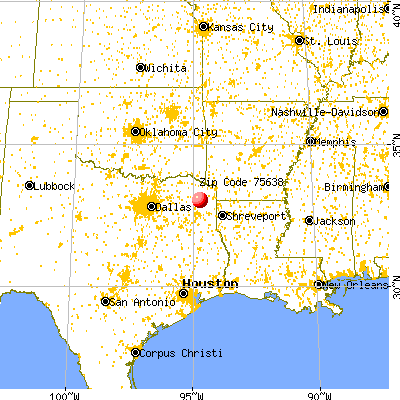


 Nearest zip codes: 75668, 75656, 75571, 75683, 75568, 75686.


 According to the data from the years 2002 - 2018 the average number of fires per year is 51. The highest number of fires - 108 took place in 2005, and the least - 19 in 2013. The data has a declining trend.
 When looking into fire subcategories, the most reports belonged to: Outside Fires (52.6%), and Structure Fires (35.6%).