Estimated zip code population in 2022: 26,415 Zip code population in 2010: 24,385 Zip code population in 2000: 22,843
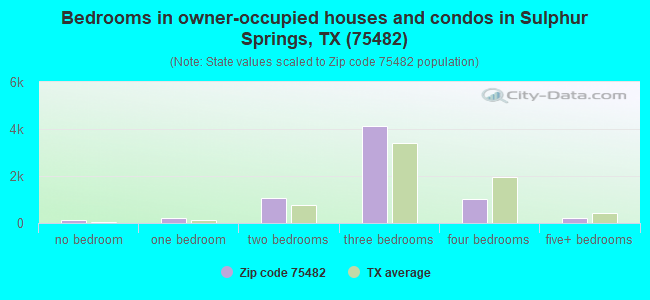
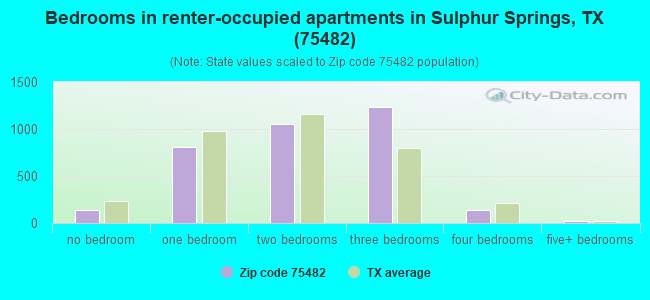
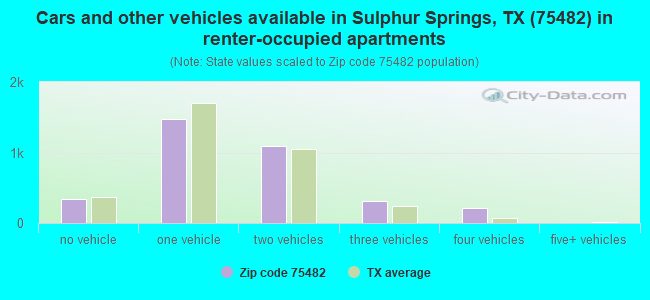
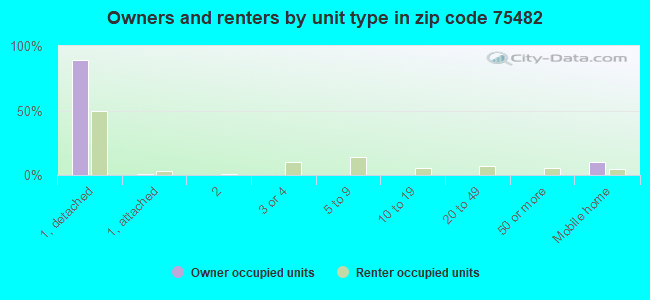
Houses and condos: 11,201 Renter-occupied apartments: 3,443
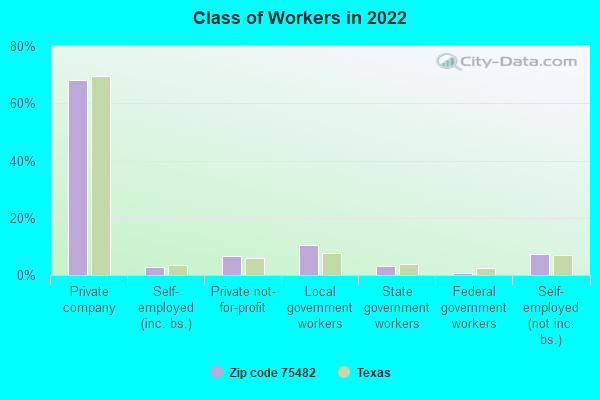
% of renters here:
34%
State:
38%
March 2022 cost of living index in zip code 75482: 79.8 (low, U.S. average is 100)
Land area: 312.3 sq. mi. Water area: 19.1 sq. mi.
Population density: 85 people per square mile
(very low).
OSM Map
General Map
Google Map
MSN Map
OSM Map
General Map
Google Map
MSN Map
OSM Map
General Map
Google Map
MSN Map
OSM Map
General Map
Google Map
MSN Map
Please wait while loading the map...
Real estate property taxes paid for housing units in 2022:
This zip code:
1.0% ($2,195)
Texas:
1.5% ($4,050)
Median real estate property taxes paid for housing units with mortgages in 2022: $2,404 (1.1%) Median real estate property taxes paid for housing units with no mortgage in 2022: $2,097 (1.0%)
Averages for the 2020 tax year for zip code 75482, filed in 2021:
Average Adjusted Gross Income (AGI) in 2020: $57,008 (Individual Income Tax Returns)
Here:
$57,008
State:
$77,054
Salary/wage: $46,497 (reported on 82.7% of returns)
Here:
$46,497
State:
$62,766
(% of AGI for various income ranges: 1237.5% for AGIs below $25k, 3682.8% for AGIs $25k-50k, 6367.0% for AGIs $50k-75k, 9568.7% for AGIs $75k-100k, 17142.3% for AGIs $100k-200k, 66786.2% for AGIs over 200k)
Taxable interest for individuals: $1,797 (reported on 26.0% of returns)
This zip code:
$1,797
Texas:
$2,665
(% of AGI for various income ranges: 13.2% for AGIs below $25k, 20.7% for AGIs $25k-50k, 53.4% for AGIs $50k-75k, 69.7% for AGIs $75k-100k, 205.6% for AGIs $100k-200k, 2372.5% for AGIs over 200k)
Ordinary dividends: $5,388 (reported on 12.4% of returns)
Here:
$5,388
State:
$10,044
(% of AGI for various income ranges: 9.7% for AGIs below $25k, 13.3% for AGIs $25k-50k, 49.8% for AGIs $50k-75k, 112.2% for AGIs $75k-100k, 351.2% for AGIs $100k-200k, 4061.2% for AGIs over 200k)
Net capital gain/loss in AGI: +$20,725 (reported on 11.8% of returns)
Here:
+$20,725
State:
+$39,590
(% of AGI for various income ranges: 6.8% for AGIs below $25k, 36.2% for AGIs $25k-50k, 113.0% for AGIs $50k-75k, 181.0% for AGIs $75k-100k, 560.6% for AGIs $100k-200k, 25121.2% for AGIs over 200k)
Profit/loss from business: +$14,013 (reported on 18.8% of returns)
Here:
+$14,013
State:
+$10,888
(% of AGI for various income ranges: 146.5% for AGIs below $25k, 189.4% for AGIs $25k-50k, 289.1% for AGIs $50k-75k, 334.1% for AGIs $75k-100k, 1220.8% for AGIs $100k-200k, 8356.2% for AGIs over 200k)
Taxable individual retirement arrangement distribution: $18,400 (reported on 6.8% of returns)
75482:
$18,400
Texas:
$24,740
(% of AGI for various income ranges: 35.8% for AGIs below $25k, 60.7% for AGIs $25k-50k, 180.9% for AGIs $50k-75k, 265.4% for AGIs $75k-100k, 743.9% for AGIs $100k-200k, 3333.8% for AGIs over 200k)
Total itemized deductions: $41,969 (reported on 4.0% of returns)
Here:
$41,969
State:
$40,428
(% of AGI for various income ranges: 19.3% for AGIs below $25k, 56.0% for AGIs $25k-50k, 133.9% for AGIs $50k-75k, 227.1% for AGIs $75k-100k, 685.8% for AGIs $100k-200k, 11717.5% for AGIs over 200k)
Charity contributions: $15,117 (reported on 3.2% of returns)
Here:
$15,117
State:
$18,201
(% of AGI for various income ranges: 13.3% for AGIs $25k-50k, 36.4% for AGIs $50k-75k, 52.1% for AGIs $75k-100k, 188.5% for AGIs $100k-200k, 3898.7% for AGIs over 200k)
Taxes paid: $6,516 (reported on 3.8% of returns)
75482:
$6,516
State:
$7,821
(% of AGI for various income ranges: 1.3% for AGIs below $25k, 7.6% for AGIs $25k-50k, 21.1% for AGIs $50k-75k, 39.2% for AGIs $75k-100k, 132.7% for AGIs $100k-200k, 1506.2% for AGIs over 200k)
Earned income credit: $2,535 (reported on 22.1% of returns)
Here:
$2,535
State:
$2,584
(% of AGI for various income ranges: 126.0% for AGIs below $25k, 90.2% for AGIs $25k-50k, 2.2% for AGIs $50k-75k)
Percentage of individuals using paid preparers for their 2020 taxes: 92.8%
Here:
93%
State:
92%
(% for various income ranges: 92.0% for AGIs below $25k, 92.6% for AGIs $25k-50k, 93.5% for AGIs $50k-75k, 92.5% for AGIs $75k-100k, 94.9% for AGIs $100k-200k, 93.8% for AGIs over 200k)
Averages for the 2012 tax year for zip code 75482, filed in 2013:
Average Adjusted Gross Income (AGI) in 2012: $49,388 (Individual Income Tax Returns)
Here:
$49,388
State:
$65,384
Salary/wage: $39,112 (reported on 84.7% of returns)
Here:
$39,112
State:
$52,524
(% of AGI for various income ranges: 80.7% for AGIs below $25k, 84.1% for AGIs $25k-50k, 79.3% for AGIs $50k-75k, 79.3% for AGIs $75k-100k, 73.9% for AGIs $100k-200k, 24.6% for AGIs over 200k)
Taxable interest for individuals: $2,111 (reported on 27.3% of returns)
This zip code:
$2,111
Texas:
$2,372
(% of AGI for various income ranges: 1.4% for AGIs below $25k, 0.7% for AGIs $25k-50k, 0.8% for AGIs $50k-75k, 0.7% for AGIs $75k-100k, 1.0% for AGIs $100k-200k, 2.1% for AGIs over 200k)
Ordinary dividends: $3,226 (reported on 12.0% of returns)
Here:
$3,226
State:
$9,721
(% of AGI for various income ranges: 0.8% for AGIs below $25k, 0.4% for AGIs $25k-50k, 0.5% for AGIs $50k-75k, 1.0% for AGIs $75k-100k, 1.1% for AGIs $100k-200k, 0.9% for AGIs over 200k)
Net capital gain/loss in AGI: +$15,020 (reported on 10.4% of returns)
Here:
+$15,020
State:
+$35,319
(% of AGI for various income ranges: 0.3% for AGIs below $25k, 0.5% for AGIs $25k-50k, 0.7% for AGIs $50k-75k, 1.1% for AGIs $75k-100k, 2.6% for AGIs $100k-200k, 10.3% for AGIs over 200k)
Profit/loss from business: +$13,725 (reported on 18.6% of returns)
Here:
+$13,725
State:
+$13,732
(% of AGI for various income ranges: 8.6% for AGIs below $25k, 3.5% for AGIs $25k-50k, 3.3% for AGIs $50k-75k, 2.7% for AGIs $75k-100k, 6.0% for AGIs $100k-200k, 6.8% for AGIs over 200k)
Taxable individual retirement arrangement distribution: $12,873 (reported on 7.9% of returns)
75482:
$12,873
Texas:
$19,511
(% of AGI for various income ranges: 2.2% for AGIs below $25k, 1.9% for AGIs $25k-50k, 2.1% for AGIs $50k-75k, 2.5% for AGIs $75k-100k, 2.9% for AGIs $100k-200k, 1.2% for AGIs over 200k)
Total itemized deductions: $24,159 (20% of AGI, reported on 17.2% of returns)
Here:
$24,159
State:
$24,724
Here:
19.6% of AGI
State:
15.9% of AGI
(% of AGI for various income ranges: 5.0% for AGIs below $25k, 6.7% for AGIs $25k-50k, 8.7% for AGIs $50k-75k, 9.0% for AGIs $75k-100k, 10.8% for AGIs $100k-200k, 9.1% for AGIs over 200k)
Charity contributions: $7,930 (reported on 13.1% of returns)
Here:
$7,930
State:
$6,808
(% of AGI for various income ranges: 0.6% for AGIs below $25k, 0.9% for AGIs $25k-50k, 1.7% for AGIs $50k-75k, 2.1% for AGIs $75k-100k, 3.0% for AGIs $100k-200k, 3.4% for AGIs over 200k)
Taxes paid: $4,365 (reported on 16.6% of returns)
75482:
$4,365
State:
$6,921
(% of AGI for various income ranges: 0.8% for AGIs below $25k, 1.0% for AGIs $25k-50k, 1.6% for AGIs $50k-75k, 2.0% for AGIs $75k-100k, 2.4% for AGIs $100k-200k, 1.1% for AGIs over 200k)
Earned income credit: $2,460 (reported on 27.1% of returns)
Here:
$2,460
State:
$2,570
(% of AGI for various income ranges: 8.8% for AGIs below $25k, 1.6% for AGIs $25k-50k)
Percentage of individuals using paid preparers for their 2012 taxes: 56.2%
Here:
56%
State:
51%
(% for various income ranges: 54.3% for AGIs below $25k, 54.3% for AGIs $25k-50k, 57.5% for AGIs $50k-75k, 60.0% for AGIs $75k-100k, 62.3% for AGIs $100k-200k, 87.5% for AGIs over 200k)
Averages for the 2004 tax year for zip code 75482, filed in 2005:
Average Adjusted Gross Income (AGI) in 2004: $33,865 (Individual Income Tax Returns)
Here:
$33,865
State:
$47,881
Salary/wage: $31,141 (reported on 84.3% of returns)
Here:
$31,141
State:
$41,947
(% of AGI for various income ranges: 213.0% for AGIs below $10k, 82.0% for AGIs $10k-25k, 83.6% for AGIs $25k-50k, 81.9% for AGIs $50k-75k, 80.2% for AGIs $75k-100k, 53.6% for AGIs over 100k)
Taxable interest for individuals: $2,014 (reported on 33.1% of returns)
This zip code:
$2,014
Texas:
$2,255
(% of AGI for various income ranges: 15.5% for AGIs below $10k, 2.3% for AGIs $10k-25k, 1.7% for AGIs $25k-50k, 1.8% for AGIs $50k-75k, 1.7% for AGIs $75k-100k, 1.6% for AGIs over 100k)
Taxable dividends: $2,388 (reported on 15.5% of returns)
Here:
$2,388
State:
$4,261
(% of AGI for various income ranges: 5.2% for AGIs below $10k, 0.7% for AGIs $10k-25k, 0.9% for AGIs $25k-50k, 0.8% for AGIs $50k-75k, 1.0% for AGIs $75k-100k, 1.6% for AGIs over 100k)
Net capital gain/loss: +$7,381 (reported on 13.3% of returns)
Here:
+$7,381
State:
+$16,110
(% of AGI for various income ranges: 2.2% for AGIs below $10k, 0.8% for AGIs $10k-25k, 0.7% for AGIs $25k-50k, 1.0% for AGIs $50k-75k, 2.6% for AGIs $75k-100k, 8.9% for AGIs over 100k)
Profit/loss from business: +$11,867 (reported on 17.2% of returns)
Here:
+$11,867
State:
+$11,013
(% of AGI for various income ranges: 7.6% for AGIs below $10k, 5.5% for AGIs $10k-25k, 3.0% for AGIs $25k-50k, 3.5% for AGIs $50k-75k, 3.3% for AGIs $75k-100k, 13.7% for AGIs over 100k)
IRA payment deduction: $3,379 (reported on 1.8% of returns)
75482:
$3,379
Texas:
$3,120
(% of AGI for various income ranges: 0.1% for AGIs $10k-25k, 0.2% for AGIs $25k-50k, 0.2% for AGIs $50k-75k, 0.2% for AGIs $75k-100k, 0.2% for AGIs over 100k)
Self-employed pension: $15,542 (reported on 0.3% of returns)
Here:
$15,542
Texas:
$16,401
Total itemized deductions: $16,721 (22% of AGI, reported on 16.1% of returns)
Here:
$16,721
State:
$19,631
Here:
22.5% of AGI
State:
18.9% of AGI
(% of AGI for various income ranges: 11.7% for AGIs below $10k, 4.4% for AGIs $10k-25k, 7.5% for AGIs $25k-50k, 8.2% for AGIs $50k-75k, 9.8% for AGIs $75k-100k, 9.3% for AGIs over 100k)
Charity contributions deductions: $5,483 (7% of AGI, reported on 12.9% of returns)
Here:
$5,483
State:
$4,753
Here:
6.9% of AGI
State:
4.2% of AGI
(% of AGI for various income ranges: 1.1% for AGIs below $10k, 0.7% for AGIs $10k-25k, 1.5% for AGIs $25k-50k, 1.9% for AGIs $50k-75k, 2.5% for AGIs $75k-100k, 3.7% for AGIs over 100k)
Total tax: $5,119 (reported on 65.7% of returns)
75482:
$5,119
State:
$9,058
(% of AGI for various income ranges: 6.7% for AGIs below $10k, 3.3% for AGIs $10k-25k, 6.1% for AGIs $25k-50k, 8.7% for AGIs $50k-75k, 10.7% for AGIs $75k-100k, 19.6% for AGIs over 100k)
Earned income credit: $1,989 (reported on 25.6% of returns)
Here:
$1,989
State:
$2,024
Percentage of individuals using paid preparers for their 2004 taxes: 61.7%
Here:
62%
State:
57%
(% for various income ranges: 56.0% for AGIs below $10k, 64.5% for AGIs $10k-25k, 62.3% for AGIs $25k-50k, 61.8% for AGIs $50k-75k, 62.3% for AGIs $75k-100k, 69.4% for AGIs over 100k)
Likely homosexual households (counted as self-reported same-sex unmarried-partner households)
Lesbian couples: 0.1% of all households
Gay men: 0.0% of all households
Household received Food Stamps/SNAP in the past 12 months: 961 Household did not receive Food Stamps/SNAP in the past 12 months: 9,243
Women who had a birth in the past 12 months: 291 (225 now married, 67 unmarried) Women who did not have a birth in the past 12 months: 5,613 (2,863 now married, 2,737 unmarried)
Housing units in zip code 75482 with a mortgage: 2,778 (84 second mortgage, 51 both second mortgage and home equity loan) Houses without a mortgage: 42
Median monthly owner costs for units with a mortgage: $1,352 Median monthly owner costs for units without a mortgage: $563
Residents with income below the poverty level in 2022:
This zip code:
13.8%
Whole state:
14.0%
Residents with income below 50% of the poverty level in 2022:
This zip code:
7.7%
Whole state:
7.4%
Median number of rooms in houses and condos:
Here:
5.9
State:
6.3
Median number of rooms in apartments:
Here:
4.5
State:
4.0
Notable locations in this zip code not listed on our city pages
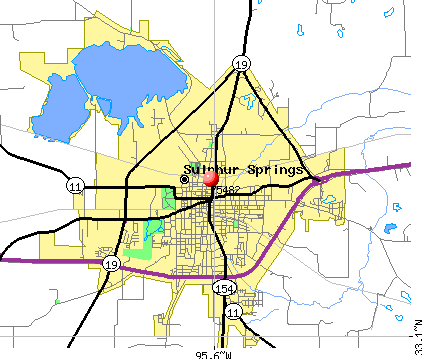
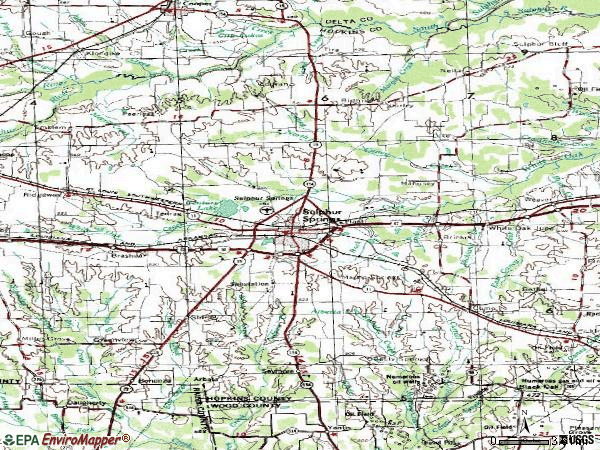
Notable locations in zip code 75482: Sulphur Springs Country Club (A), Gafford Chapel (B), Shooks Chapel (C), Hopkins County Courthouse (D), Southwest Dairy Museum (E), Hopkins County Historical Museum (F), Sulphur Springs Fire Department Station 1 - First Responders (G), North Hopkins Volunteer Fire Department - First Responders (H), Sulphur Springs Fire Station (I), Brinker Volunteer Fire and Rescue Department Station 12 (J), Hopkins County Fire and Rescue (K), Arbala Volunteer Fire and Rescue Department (L), Good Neighbor Community Center (M). Display/hide their locations on the map
Churches in zip code 75482 include: Pleasant Grove Church (A), Pleasant Hill Church (B), Richland Church (C), Rockdale Church (D), Saint Luke Church (E), Shady Grove Church (F), Shirley Church (G), Union Church (H), Wesley Church (I). Display/hide their locations on the map
Cemeteries: Rushing Cemetery (1), Lindley Cemetery (2), Oakland Cemetery (3), Selt Cemetery (4), Melton Cemetery (5), Restlawn Memorial Cemetery (6), Aiguier Cemetery (7). Display/hide their locations on the map
Reservoirs: White Oak Lake (A), Helm Lake Number 3 (B), Jennings Lake (C), Crush Lake (D), Lake Coleman (E), Century Lake (F), Camps Lake (G), Alberta Lake (H). Display/hide their locations on the map
Streams, rivers, and creeks: Wood Creek (A), Town Branch (B), Vaden Creek (C), Riley Creek (D), Richland Creek (E), Reppond Branch (F), Basset Branch (G), Morris Creek (H), Midget Creek (I). Display/hide their locations on the map
Parks in zip code 75482 include: Suplhur Springs City Park (1), Pacific Park (2), Cooper Lake State Park - South Sulphur Unit (3). Display/hide their locations on the map
In group quarters: 449 (-1 institutionalized population)
Size of family households: 3,176 2-persons, 1,236 3-persons, 1,491 4-persons, 766 5-persons, 146 6-persons, 118 7-or-more-persons
Size of nonfamily households: 2,954 1-person, 281 2-persons, 35 5-persons
4,163 married couples with children.
972 single-parent households (308 men, 664 women).
84.7% of residents of 75482 zip code speak English at home.
14.0% of residents speak Spanish at home (63% very well, 19% well, 14% not well, 3% not at all).
0.5% of residents speak other Indo-European language at home (100% very well).
0.6% of residents speak Asian or Pacific Island language at home (36% very well, 25% well, 22% not well, 18% not at all).
0.1% of residents speak other language at home (53% very well, 47% well).
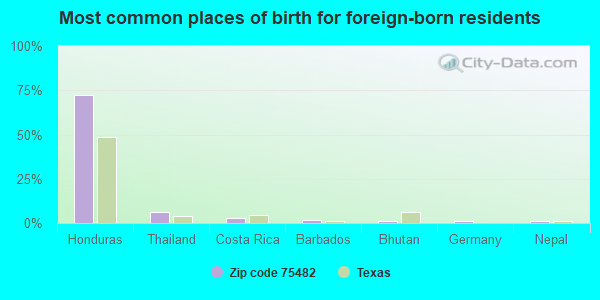
Foreign born population: 2,278 (8.6%) (34.5% of them are naturalized citizens)
This zip code:
8.6%
Whole state:
17.2%
72%Honduras
6%Thailand
3%Costa Rica
2%Barbados
1%Bhutan
1%Germany
1%Nepal
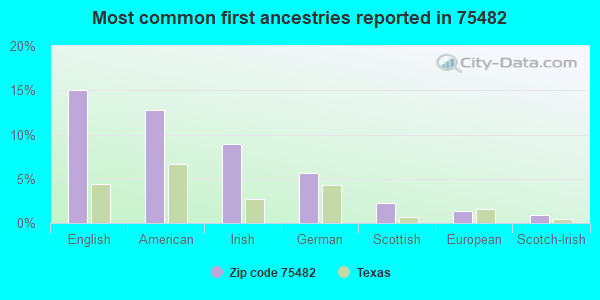
15%English
13%American
9%Irish
6%German
2%Scottish
1%European
1%Scotch-Irish
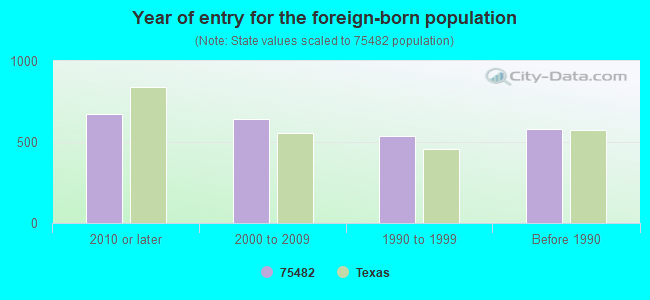
Year of entry for the foreign-born population
6722010 or later
6422000 to 2009
5341990 to 1999
578Before 1990
Facilities with environmental interests located in this zip code:
AUSTIN EL (631 CONNALLY ST in SULPHUR SPRINGS, TX)
(National Center for Education Statistics) - STATE ID-112901101 Organizations: SULPHUR SPRINGS ISD (SCHOOL DISTRICT)
A.P. GREEN REFRACTORIES INC. (FM 1870 EAST in SULPHUR SPRINGS, TX)
AIR MINOR (AIRS/AFS) TSD (Resource Conservation and Recovery Act (tracking hazardous waste)) TRI REPORTER (Tracking of toxic chemicals releasing facilities) Business SIC classification: BRICK AND STRUCTURAL CLAY TILE; CLAY REFRACTORIES Business NAICS classification: NONCLAY REFRACTORY MANUFACTURING. Organizations: A P GREEN REFRACTORIES CO (CONTACT/OPERATOR)
Alternative names: AP GREEN INDUSTRIES INC, AP GREEN REFRACTORIES COMPANY, DAVID CARPENTER, HARBISON WALKER REFRACTORIES CO.
APAC SULPHUR SPRINGS EQUIPMENT SHOP (3521 IH 30 NORTH SERVICE ROAD in SULPHUR SPRINGS, TX)
Conditionally Exempt Small Quantity Generators, less than 100 kg/month of hazardous waste (Resource Conservation and Recovery Act (tracking hazardous waste)) USED OIL PROGRAM (Resource Conservation and Recovery Act (tracking hazardous waste)) Business NAICS classification: ALL OTHER AUTOMOTIVE REPAIR AND MAINTENANCE. Organizations: APAC TEXAS INC BUSTER PAVING DIV (CONTACT/OPERATOR)
Housing units lacking complete plumbing facilities: 1.7% Housing units lacking complete kitchen facilities: 1.7%
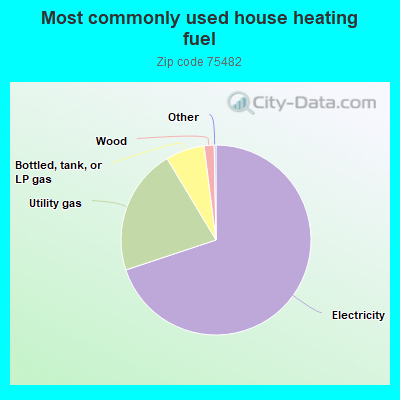
69.9%Electricity
21.5%Utility gas
6.6%Bottled, tank, or LP gas
1.7%Wood
Population in 1990: 21,479. Population change in the 1990s: +1,364 (+6.4%).
Place of birth for U.S.-born residents:
This state: 19,477
Northeast: 293
Midwest: 1,137
South: 1,735
West: 1,168
51% of the 75482 zip code residents lived in the same house 5 years ago. Out of people who lived in different houses, 62% lived in this county. Out of people who lived in different counties, 50% lived in Texas.
89% of the 75482 zip code residents lived in the same house 1 year ago. Out of people who lived in different houses, 49% moved from this county. Out of people who lived in different houses, 30% moved from different county within same state. Out of people who lived in different houses, 15% moved from different state. Out of people who lived in different houses, 6% moved from abroad.
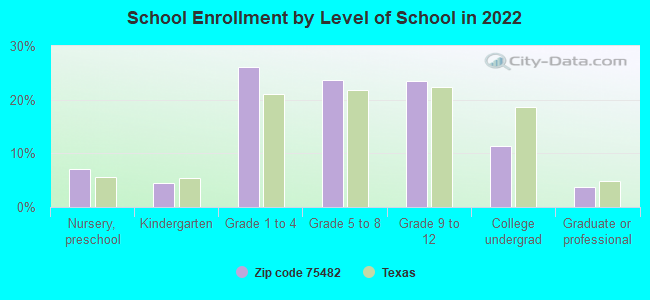
Private vs. public school enrollment:
Students in private schools in grades 1 to 8 (elementary and middle school): 368
Here:
11.7%
Texas:
8.8%
Students in private schools in grades 9 to 12 (high school): 167
Here:
11.3%
Texas:
8.0%
Students in private undergraduate colleges: 33
Here:
4.6%
Texas:
16.2%
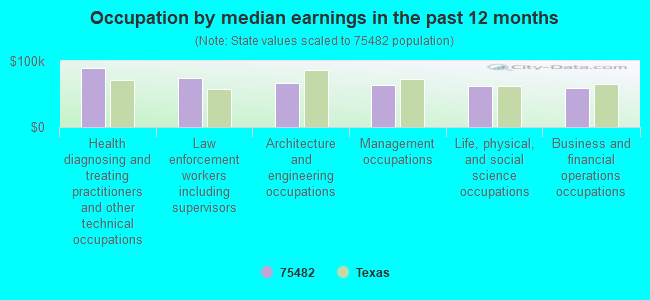
Occupation by median earnings in the past 12 months ($)
88,645Health diagnosing and treating practitioners and other technical occupations
74,073Law enforcement workers including supervisors
67,269Architecture and engineering occupations
64,246Management occupations
61,456Life, physical, and social science occupations
58,780Business and financial operations occupations
Companies with federal contracts located in this zip code (SULPHUR SPRING, TX):
BUSINESS INDUSTRIAL & INSTITUT (456 S HILLCREST DR; small business) : $240,401 in 23 contractsfrom 2000 to 2006
Contracts for Miscellaneous Fabricated Nonmetallic Materials, Padding and Stuffing Materials, Hand Tools, Nonedged, Nonpowered, Packaging and Packing Bulk Materials, and moreby U.S. Army Corps of Engineers - civil program financing only, Navy, Defense Logistics Agency, Air Force, and others Signed by year:2000: $93,000; 2001: $0; 2002: $0; 2003: $0; 2004: $26,367; 2005: $82,185; 2006: $38,849.
Biggest contracts:
$93,000 with U.S. Army Corps of Engineers - civil program financing only for Miscellaneous Fabricated Nonmetallic Materials. Signed on 2000-02-17. Completion date: 2000-04-03.
$31,265 with Navy for Padding and Stuffing Materials. Signed on 2005-09-23. Completion date: 2005-11-25.
$25,695 with Navy for Hand Tools, Nonedged, Nonpowered. Signed on 2005-02-16. Completion date: 2005-03-17.
$16,141 with Defense Logistics Agency for Packaging and Packing Bulk Materials. Signed on 2004-12-27. Completion date: 2005-02-07.
BRYDL CONTRACTING, INC (3225 HIGHWAY 11 W; small business) : $162,853 in 3 contractsfrom 2005 to 2006
$54,645 with Army for Landscaping/Groundskeeping Services. Signed on 2006-02-23. Completion date: 2004-11-04.
$54,104, same as above.Signed on 2005-02-09. Completion date: 2004-11-04.
$54,104 with U.S. Army Corps of Engineers - civil program financing only for Landscaping/Groundskeeping Services. Signed on 2005-02-09. Completion date: 2004-11-04.
STANLEY HORTON (RR RT 7 BOX 795; small business) : $153,227 in 20 contractsfrom 2003 to 2006
Contracts for Landscaping/Groundskeeping Services, Custodial Janitorial Services, Other Environmental Services, Studies, and Analytical Support by Army, U.S. Army Corps of Engineers - civil program financing only Signed by year:2000: $0; 2001: $0; 2002: $0; 2003: $22,700; 2004: $105,459; 2005: $14,708; 2006: $10,360.
Biggest contracts:
$49,481 with Army for Landscaping/Groundskeeping Services. Signed on 2004-04-05. Completion date: 2006-03-06.
$17,148 with Army for Custodial Janitorial Services. Signed on 2004-01-05. Completion date: 2004-09-30.
$7,354 with Army for Landscaping/Groundskeeping Services. Signed on 2005-07-06. Completion date: 2005-07-29.
$7,354, same as above.Signed on 2005-08-17. Completion date: 2005-09-12.
GSC ENTERPRISES, INC (130 N HILLCREST DR) : $4,232 in 3 contractsin 2005
$2,324 with Defense Commissary Agency for Food Items For Resale. Signed on 2005-04-01. Completion date: 2005-08-31.
$1,468, same as above.Signed on 2005-01-01. Completion date: 2005-03-31.
$440, same as above.Signed on 2005-04-01. Completion date: 2005-09-20.
Top industries in this zip code by the number of employees in 2005:
Administrative and Support and Waste Management and Remediation Services: Temporary Help Services (250-499 employees: 1 establishment, 100-249 employees: 1 establishment)
Health Care and Social Assistance: Nursing Care Facilities (100-249: 2, 50-99: 1)
Wholesale Trade: Tobacco and Tobacco Product Merchant Wholesalers (250-499: 1)
Health Care and Social Assistance: General Medical and Surgical Hospitals (250-499: 1)
Other Services (except Public Administration): Religious Organizations (50-99: 1, 20-49: 2, 10-19: 3, 5-9: 4, 1-4: 10)
Construction: Highway, Street, and Bridge Construction (100-249: 1, 20-49: 1, 5-9: 1)
People in group quarters in 2010:
303 people in nursing facilities/skilled-nursing facilities
77 people in local jails and other municipal confinement facilities
People in group quarters in 2000:
334 people in nursing homes
93 people in local jails and other confinement facilities (including police lockups)
6 people in wards in general hospitals for patients who have no usual home elsewhere
Fatal accident statistics in 2014:
Fatal accident count: 5
Vehicles involved in fatal accidents: 8
Fatal accidents caused by drunken drivers: 0
Fatalities: 6
Persons involved in fatal accidents: 13
Pedestrians involved in fatal accidents: 0
Fatal accident statistics in 2013:
Fatal accident count: 4
Vehicles involved in fatal accidents: 6
Fatal accidents caused by drunken drivers: 1
Fatalities: 4
Persons involved in fatal accidents: 9
Pedestrians involved in fatal accidents: 0
2002 - 2018 National Fire Incident Reporting System (NFIRS) incidents
According to the data from the years 2002 - 2018 the average number of fire incidents per year is 300. The highest number of fires - 471 took place in 2011, and the least - 137 in 2013. The data has a rising trend.
When looking into fire subcategories, the most reports belonged to: Outside Fires (61.4%), and Structure Fires (21.2%).
Fire incident types reported to NFIRS in Zip Code 75482
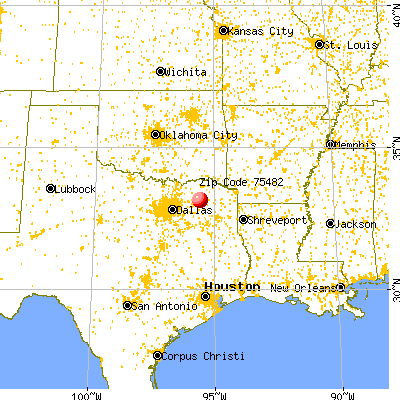


 Nearest zip codes: 75420, 75437, 75433, 75431, 75448, 75432.
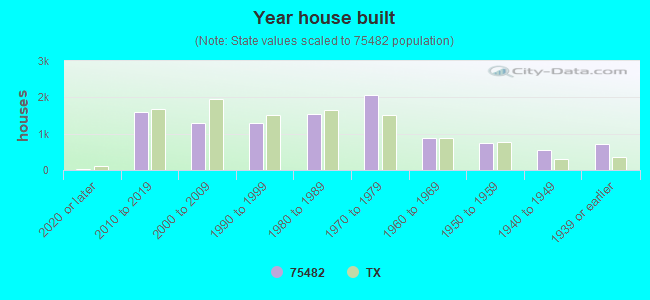


 According to the data from the years 2002 - 2018 the average number of fire incidents per year is 300. The highest number of fires - 471 took place in 2011, and the least - 137 in 2013. The data has a rising trend.
 When looking into fire subcategories, the most reports belonged to: Outside Fires (61.4%), and Structure Fires (21.2%).