Sulphur Springs, Texas

Sulphur Springs: County Courthouse

Sulphur Springs: It's a dog's life in Sulphur Springs

Sulphur Springs: The bread-and-butter of Sulphur Springs

Sulphur Springs: The bread-and-butter of Sulphur Springs
Sulphur Springs: Fall Festival, Hopkins County Civic Center grounds, 2010

Sulphur Springs: It's a dog's life in Sulphur Springs
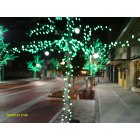
Sulphur Springs: Fall Festival, Hopkins County Civic Center grounds, 2010

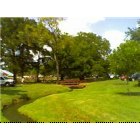
Sulphur Springs: Walking Path Coleman Park
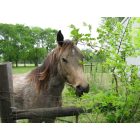
Sulphur Springs: a place of beautiful horses
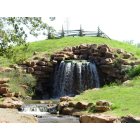
Sulphur Springs: Waterfall at Coleman Park

Sulphur Springs: Two giant cows mark the Southwest Dairy Center and Museum
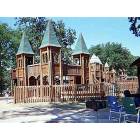
Sulphur Springs: Sulpher Springs City Park
- add
your
Submit your own pictures of this city and show them to the world
- OSM Map
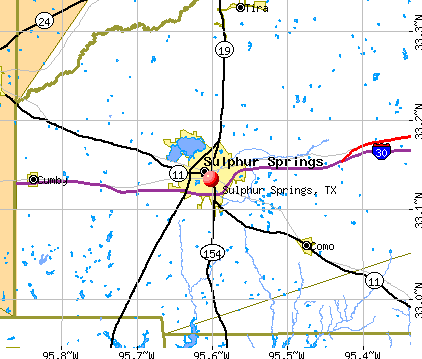
- General Map
- Google Map
- MSN Map
Population change since 2000: +12.8%
 |
| Males: 7,843 | |
| Females: 8,565 |
| Median resident age: | 39.8 years |
| Texas median age: | 35.6 years |
Zip codes: 75482.
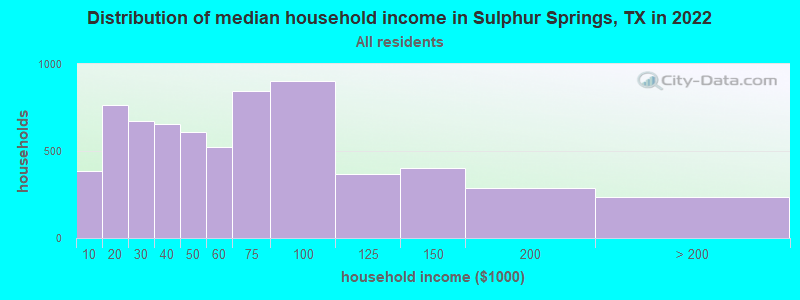
| Sulphur Springs: | $54,385 |
| TX: | $72,284 |
Estimated per capita income in 2022: $29,555 (it was $16,662 in 2000)
Sulphur Springs city income, earnings, and wages data
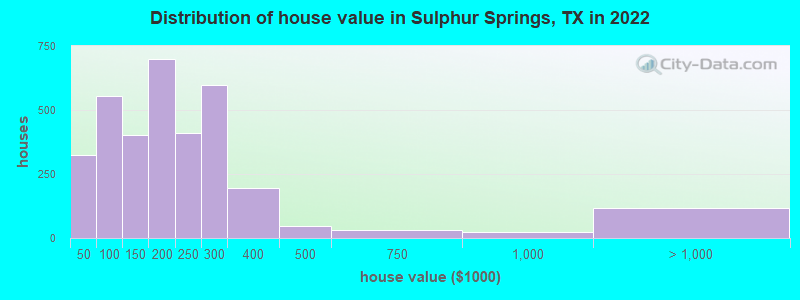
Estimated median house or condo value in 2022: $199,607 (it was $61,100 in 2000)
| Sulphur Springs: | $199,607 |
| TX: | $275,400 |
Mean prices in 2022: all housing units: $178,621; detached houses: $180,809; townhouses or other attached units: $91,645; mobile homes: $136,968
Median gross rent in 2022: $984.
Sulphur Springs, TX residents, houses, and apartments details
(10.1% for White Non-Hispanic residents, 39.0% for Black residents, 17.5% for Hispanic or Latino residents, 14.3% for American Indian residents, 12.4% for other race residents, 6.1% for two or more races residents)
Detailed information about poverty and poor residents in Sulphur Springs, TX


Compare current foreclosures near Sulphur Springs, TX:
| Photo | Address | Area | Beds / Baths | Price | Details |
|---|---|---|---|---|---|

|
#1
Camp St
Sulphur Springs, TX 75482
|
1,532 sq. feet
|
2 baths 3 beds |
show details | |

|
#2
Goodman St
Sulphur Springs, TX 75482
|
1,456 sq. feet
|
- baths - beds |
show details | |

|
#3
Kasie St
Sulphur Springs, TX 75482
|
- sq. feet
|
- baths - beds |
show details | |

|
#4
Houston St
Sulphur Springs, TX 75482
|
- sq. feet
|
- baths - beds |
show details | |

|
#5
Woodbridge Dr
Sulphur Springs, TX 75482
|
- sq. feet
|
- baths - beds |
show details | |

|
#6
Texas Highway 11 E
Sulphur Springs, TX 75482
|
- sq. feet
|
- baths - beds |
show details | |

|
#7
Camp St
Sulphur Springs, TX 75482
|
1,134 sq. feet
|
- baths - beds |
show details | |

|
#8
Camp St
Sulphur Springs, TX 75482
|
1,457 sq. feet
|
- baths - beds |
show details | |

|
#9
Hollie Cir
Sulphur Springs, TX 75482
|
1,916 sq. feet
|
- baths - beds |
show details | |

|
#10
Camp St
Sulphur Springs, TX 75482
|
1,134 sq. feet
|
- baths - beds |
show details |
| Photo | Address | Area | Beds / Baths | Price | Details |
|---|---|---|---|---|---|

|
#11
County Road 3507 N
Sulphur Springs, TX 75482
|
1,860 sq. feet
|
- baths - beds |
show details | |

|
#12
County Road 4708
Sulphur Springs, TX 75482
|
- sq. feet
|
- baths - beds |
show details | |

|
#13
Craig St
Sulphur Springs, TX 75482
|
1,590 sq. feet
|
- baths - beds |
show details | |

|
#14
Ponder St
Sulphur Springs, TX 75482
|
1,292 sq. feet
|
- baths - beds |
show details | |

|
#15
Farm Road 71 W
Sulphur Springs, TX 75482
|
- sq. feet
|
- baths - beds |
show details | |

|
#16
Houston St
Sulphur Springs, TX 75482
|
1,396 sq. feet
|
- baths - beds |
show details | |

|
#17
County Road 3502
Sulphur Springs, TX 75482
|
1,464 sq. feet
|
- baths - beds |
show details | |

|
#18
Garrett Dr
Sulphur Springs, TX 75482
|
- sq. feet
|
- baths - beds |
show details | |

|
#19
Sunset St
Sulphur Springs, TX 75482
|
1,412 sq. feet
|
- baths - beds |
show details | |

|
#20
SE 7th St
Cooper, TX 75432
|
1,753 sq. feet
|
1 baths - beds |
show details |
| Photo | Address | Area | Beds / Baths | Price | Details |
|---|---|---|---|---|---|

|
#21
County Road 1164
Brashear, TX 75420
|
1,764 sq. feet
|
- baths - beds |
show details | |

|
#22
County Road 4727
Cumby, TX 75433
|
2,225 sq. feet
|
- baths - beds |
show details | |

|
#23
Private Road 5290
Yantis, TX 75497
|
- sq. feet
|
- baths - beds |
show details | |

|
#24
County Road 1858
Yantis, TX 75497
|
- sq. feet
|
- baths - beds |
show details | |

|
#25
Us Highway 67
Saltillo, TX 75478
|
- sq. feet
|
- baths - beds |
show details | |

|
#26
County Road 1917 # 5
Yantis, TX 75497
|
- sq. feet
|
- baths - beds |
show details | |

|
#27
N State Highway 19
Emory, TX 75440
|
- sq. feet
|
- baths - beds |
show details | |

|
#28
County Road 2330
Como, TX 75431
|
- sq. feet
|
- baths - beds |
show details | |

|
Check over 1 million property listings on Foreclosure.com!
|
browse all offers | |||


- 10,43563.4%White alone
- 2,82117.1%Hispanic
- 2,28513.9%Black alone
- 4062.5%Two or more races
- 2091.3%Asian alone
- 460.3%Other race alone
- 330.2%American Indian alone
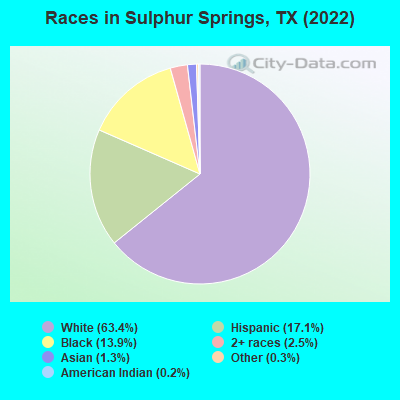
Races in Sulphur Springs detailed stats: ancestries, foreign born residents, place of birth
According to our research of Texas and other state lists, there were 71 registered sex offenders living in Sulphur Springs, Texas as of April 27, 2024.
The ratio of all residents to sex offenders in Sulphur Springs is 231 to 1.
Type |
2009 |
2010 |
2011 |
2012 |
2013 |
2014 |
2015 |
2016 |
2017 |
2018 |
2019 |
2020 |
2021 |
2022 |
|---|---|---|---|---|---|---|---|---|---|---|---|---|---|---|
| Murders (per 100,000) | 1 (6.4) | 0 (0.0) | 2 (12.7) | 0 (0.0) | 1 (6.4) | 0 (0.0) | 2 (12.4) | 0 (0.0) | 0 (0.0) | 2 (12.4) | 0 (0.0) | 3 (18.4) | 0 (0.0) | 0 (0.0) |
| Rapes (per 100,000) | 4 (25.7) | 1 (6.5) | 1 (6.3) | 0 (0.0) | 5 (32.0) | 8 (50.1) | 10 (62.1) | 5 (30.8) | 6 (36.9) | 6 (37.2) | 6 (37.0) | 9 (55.1) | 8 (48.9) | 7 (43.4) |
| Robberies (per 100,000) | 8 (51.4) | 7 (45.3) | 2 (12.7) | 3 (19.0) | 4 (25.6) | 6 (37.6) | 7 (43.5) | 6 (37.0) | 4 (24.6) | 9 (55.9) | 7 (43.2) | 6 (36.8) | 1 (6.1) | 4 (24.8) |
| Assaults (per 100,000) | 26 (167.1) | 35 (226.6) | 27 (171.2) | 36 (228.2) | 15 (96.1) | 22 (137.8) | 23 (142.8) | 18 (110.9) | 19 (116.7) | 20 (124.1) | 20 (123.3) | 21 (128.7) | 12 (73.4) | 18 (111.6) |
| Burglaries (per 100,000) | 73 (469.0) | 70 (453.1) | 63 (399.4) | 47 (298.0) | 51 (326.7) | 38 (238.0) | 49 (304.3) | 36 (221.9) | 27 (165.8) | 33 (204.8) | 19 (117.1) | 22 (134.8) | 29 (177.3) | 16 (99.2) |
| Thefts (per 100,000) | 212 (1,362) | 203 (1,314) | 155 (982.6) | 149 (944.6) | 186 (1,191) | 157 (983.3) | 204 (1,267) | 196 (1,208) | 126 (773.9) | 98 (608.3) | 118 (727.5) | 114 (698.4) | 81 (495.2) | 81 (502.2) |
| Auto thefts (per 100,000) | 11 (70.7) | 16 (103.6) | 17 (107.8) | 15 (95.1) | 10 (64.0) | 15 (93.9) | 28 (173.9) | 20 (123.3) | 13 (79.8) | 26 (161.4) | 31 (191.1) | 36 (220.6) | 20 (122.3) | 8 (49.6) |
| Arson (per 100,000) | 1 (6.4) | 2 (12.9) | 3 (19.0) | 0 (0.0) | 2 (12.8) | 3 (18.8) | 3 (18.6) | 2 (12.3) | 2 (12.3) | 2 (12.4) | 0 (0.0) | 0 (0.0) | 0 (0.0) | 0 (0.0) |
| City-Data.com crime index | 175.2 | 156.6 | 144.4 | 117.6 | 141.0 | 142.4 | 202.0 | 131.6 | 109.1 | 147.8 | 119.8 | 172.7 | 97.6 | 95.5 |
The City-Data.com crime index weighs serious crimes and violent crimes more heavily. Higher means more crime, U.S. average is 246.1. It adjusts for the number of visitors and daily workers commuting into cities.
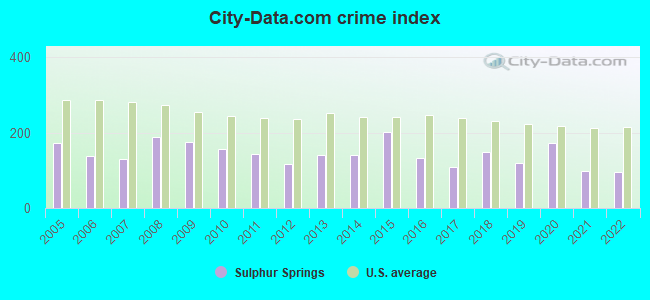
Crime rate in Sulphur Springs detailed stats: murders, rapes, robberies, assaults, burglaries, thefts, arson
Full-time law enforcement employees in 2021, including police officers: 38 (28 officers - 28 male; 0 female).
| Officers per 1,000 residents here: | 1.71 |
| Texas average: | 2.07 |
 Recent articles from our blog. Our writers, many of them Ph.D. graduates or candidates, create easy-to-read articles on a wide variety of topics.

 | What is Sulphur Springs like? (14 replies) |
| When will Sherman/Denison Be In DFW Metro? (66 replies) |
| Thoughts on Sulphur Springs? (1 reply) |
| Seeking Affordable Alternatives to DFW Texas: Where are people moving? (47 replies) |
| Texas County Recommendations (16 replies) |
| East TX “like third world”? (70 replies) |
Latest news from Sulphur Springs, TX collected exclusively by city-data.com from local newspapers, TV, and radio stations
Ancestries: American (12.8%), English (11.0%), Irish (8.8%), German (4.8%), Scottish (2.1%), European (1.6%).
Current Local Time: CST time zone
Land area: 17.9 square miles.
Population density: 919 people per square mile (low).
1,367 residents are foreign born (6.6% Latin America, 1.1% Asia).
| This city: | 8.3% |
| Texas: | 17.1% |
Median real estate property taxes paid for housing units with mortgages in 2022: $2,312 (1.1%)
Median real estate property taxes paid for housing units with no mortgage in 2022: $2,040 (1.0%)
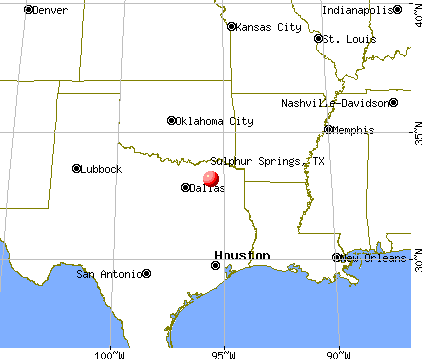
Nearest city with pop. 50,000+: Tyler, TX  (58.0 miles , pop. 83,650).
Nearest city with pop. 200,000+: Garland, TX (61.9 miles , pop. 215,768).
Nearest city with pop. 1,000,000+: Dallas, TX (72.6 miles , pop. 1,188,580).
Nearest cities:
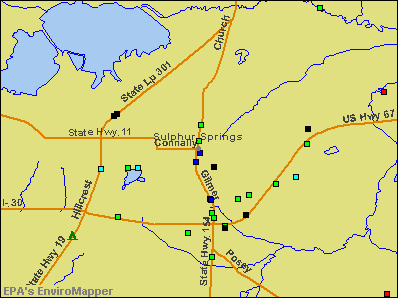
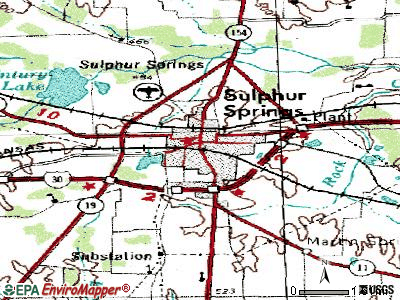
), ), ), ), Latitude: 33.13 N, Longitude: 95.60 W
Daytime population change due to commuting: +4,839 (+29.4%)
Workers who live and work in this city: 5,630 (72.1%)
Area code: 903
Sulphur Springs, Texas accommodation & food services, waste management - Economy and Business Data
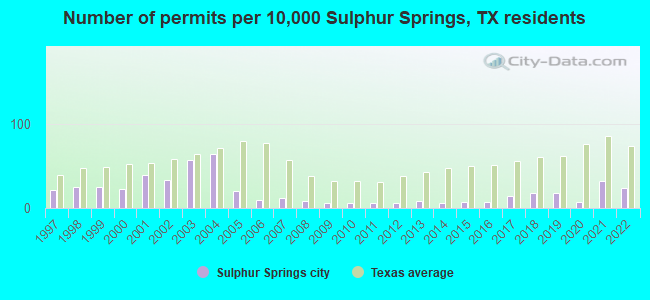
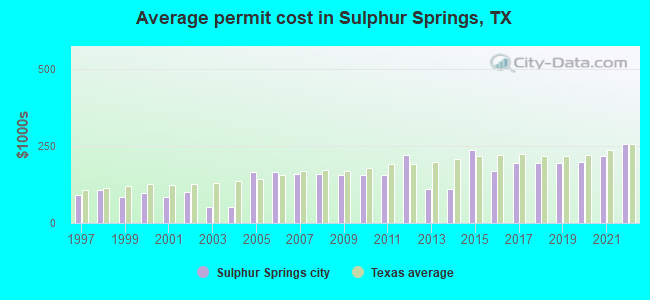
Single-family new house construction building permits:
- 2022: 34 buildings, average cost: $256,200
- 2021: 47 buildings, average cost: $217,500
- 2020: 10 buildings, average cost: $200,000
- 2019: 26 buildings, average cost: $194,800
- 2018: 26 buildings, average cost: $195,200
- 2017: 21 buildings, average cost: $194,200
- 2016: 10 buildings, average cost: $170,000
- 2015: 10 buildings, average cost: $236,300
- 2014: 8 buildings, average cost: $112,400
- 2013: 12 buildings, average cost: $112,400
- 2012: 9 buildings, average cost: $220,600
- 2011: 8 buildings, average cost: $156,500
- 2010: 8 buildings, average cost: $156,500
- 2009: 8 buildings, average cost: $156,500
- 2008: 12 buildings, average cost: $160,100
- 2007: 18 buildings, average cost: $160,100
- 2006: 14 buildings, average cost: $167,200
- 2005: 29 buildings, average cost: $166,900
- 2004: 93 buildings, average cost: $52,700
- 2003: 84 buildings, average cost: $52,700
- 2002: 49 buildings, average cost: $101,300
- 2001: 58 buildings, average cost: $85,400
- 2000: 33 buildings, average cost: $97,100
- 1999: 36 buildings, average cost: $86,100
- 1998: 36 buildings, average cost: $108,900
- 1997: 31 buildings, average cost: $92,000
| Here: | 2.7% |
| Texas: | 3.5% |
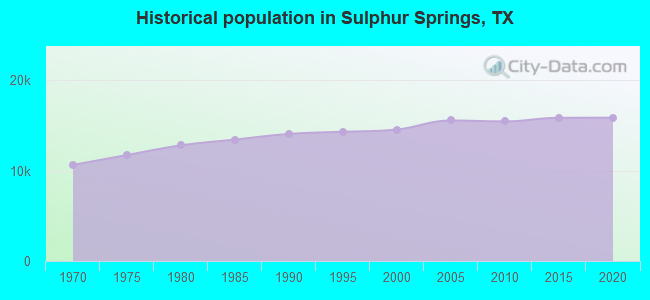
Population change in the 1990s: +369 (+2.6%).
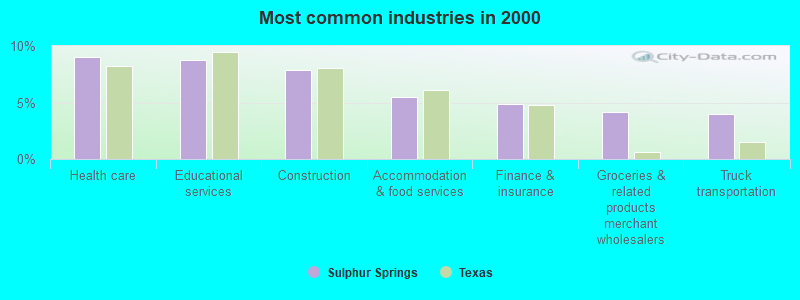
- Health care (9.0%)
- Educational services (8.7%)
- Construction (7.9%)
- Accommodation & food services (5.5%)
- Finance & insurance (4.8%)
- Groceries & related products merchant wholesalers (4.2%)
- Truck transportation (4.0%)
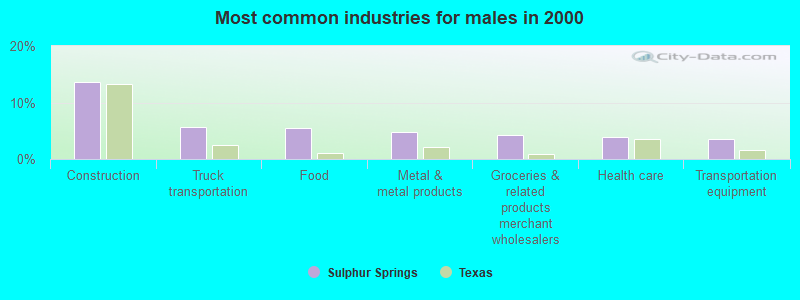
- Construction (13.6%)
- Truck transportation (5.7%)
- Food (5.5%)
- Metal & metal products (4.8%)
- Groceries & related products merchant wholesalers (4.3%)
- Health care (3.9%)
- Transportation equipment (3.6%)
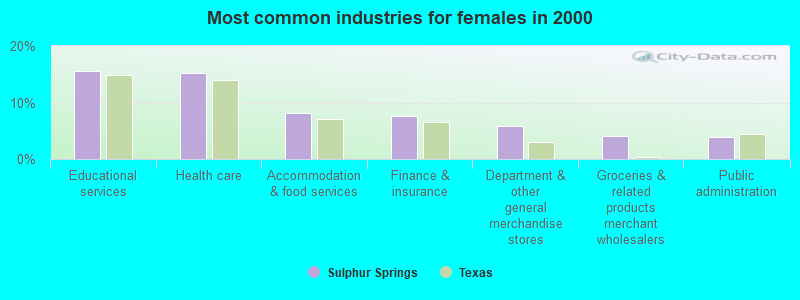
- Educational services (15.6%)
- Health care (15.3%)
- Accommodation & food services (8.1%)
- Finance & insurance (7.6%)
- Department & other general merchandise stores (5.8%)
- Groceries & related products merchant wholesalers (4.1%)
- Public administration (3.9%)
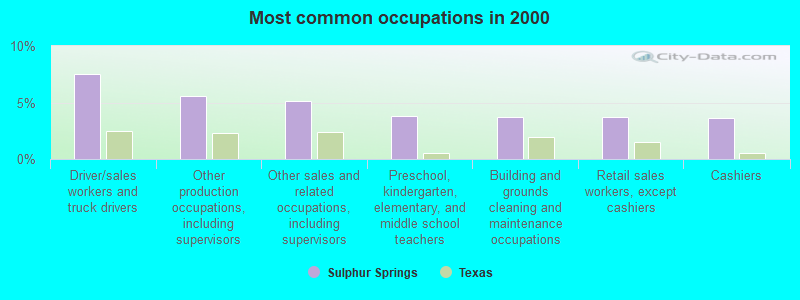
- Driver/sales workers and truck drivers (7.5%)
- Other production occupations, including supervisors (5.6%)
- Other sales and related occupations, including supervisors (5.1%)
- Preschool, kindergarten, elementary, and middle school teachers (3.8%)
- Building and grounds cleaning and maintenance occupations (3.7%)
- Retail sales workers, except cashiers (3.7%)
- Cashiers (3.6%)
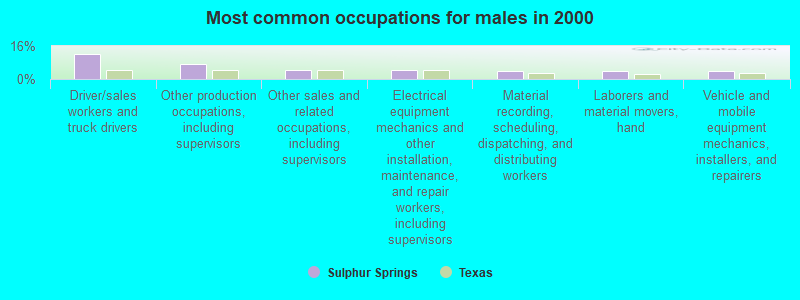
- Driver/sales workers and truck drivers (12.3%)
- Other production occupations, including supervisors (7.4%)
- Other sales and related occupations, including supervisors (4.4%)
- Electrical equipment mechanics and other installation, maintenance, and repair workers, including supervisors (4.4%)
- Material recording, scheduling, dispatching, and distributing workers (4.1%)
- Laborers and material movers, hand (3.9%)
- Vehicle and mobile equipment mechanics, installers, and repairers (3.8%)
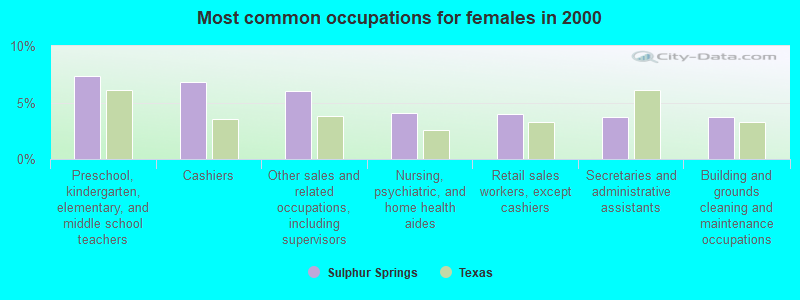
- Preschool, kindergarten, elementary, and middle school teachers (7.4%)
- Cashiers (6.8%)
- Other sales and related occupations, including supervisors (6.0%)
- Nursing, psychiatric, and home health aides (4.1%)
- Retail sales workers, except cashiers (3.9%)
- Secretaries and administrative assistants (3.7%)
- Building and grounds cleaning and maintenance occupations (3.7%)
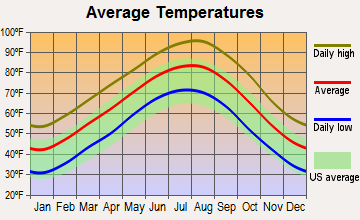
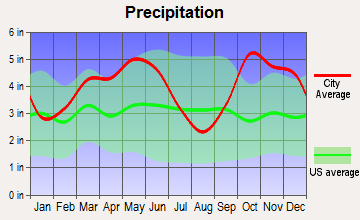
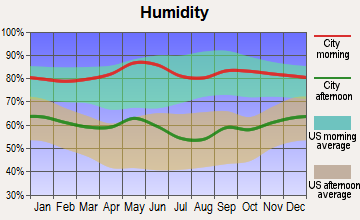
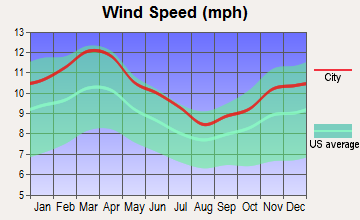
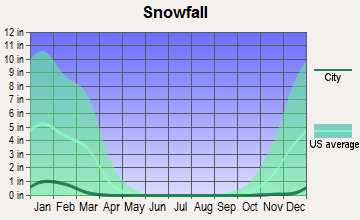
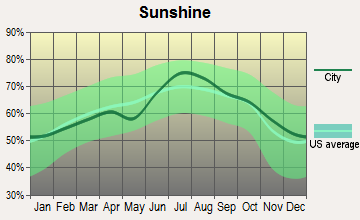
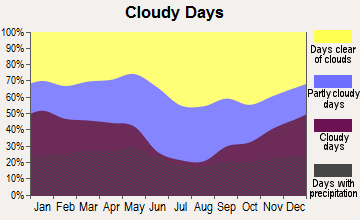
Average climate in Sulphur Springs, Texas
Based on data reported by over 4,000 weather stations
|
|

Tornado activity:
Sulphur Springs-area historical tornado activity is above Texas state average. It is 122% greater than the overall U.S. average.
On 5/14/1969, a category F3 (max. wind speeds 158-206 mph) tornado 9.2 miles away from the Sulphur Springs city center caused between $5000 and $50,000 in damages.
On 4/2/1982, a category F4 (max. wind speeds 207-260 mph) tornado 35.7 miles away from the city center killed 10 people and injured 170 people and caused between $5,000,000 and $50,000,000 in damages.
Earthquake activity:
Sulphur Springs-area historical earthquake activity is significantly above Texas state average. It is 480% greater than the overall U.S. average.On 11/6/2011 at 03:53:10, a magnitude 5.7 (5.7 MW, Depth: 3.2 mi, Class: Moderate, Intensity: VI - VII) earthquake occurred 178.7 miles away from Sulphur Springs center
On 9/3/2016 at 12:02:44, a magnitude 5.8 (5.8 MW, Depth: 3.5 mi) earthquake occurred 239.8 miles away from the city center
On 5/17/2012 at 08:12:00, a magnitude 4.8 (4.8 MW, Depth: 3.1 mi, Class: Light, Intensity: IV - V) earthquake occurred 110.2 miles away from the city center
On 11/7/2016 at 01:44:24, a magnitude 5.0 (5.0 MW, Depth: 2.8 mi) earthquake occurred 209.1 miles away from Sulphur Springs center
On 9/6/1997 at 23:38:00, a magnitude 4.5 (4.5 LG, 4.2 LG, Depth: 3.1 mi) earthquake occurred 115.9 miles away from the city center
On 11/8/2011 at 02:46:57, a magnitude 4.8 (4.8 MW, Depth: 3.1 mi) earthquake occurred 179.1 miles away from the city center
Magnitude types: regional Lg-wave magnitude (LG), moment magnitude (MW)
Natural disasters:
The number of natural disasters in Hopkins County (14) is near the US average (15).Major Disasters (Presidential) Declared: 6
Emergencies Declared: 5
Causes of natural disasters: Floods: 5, Hurricanes: 4, Storms: 4, Fires: 3, Tornadoes: 3, Winds: 2, Winter Storms: 2, Other: 1 (Note: some incidents may be assigned to more than one category).
Hospitals in Sulphur Springs:
- HOPKINS COUNTY MEMORIAL HOSPITAL (Government - Hospital District or Authority, provides emergency services, 115 AIRPORT RD)
- HOSPICE AT MEMORIAL (1228 CHURCH ST)
Nursing Homes in Sulphur Springs:
- CARRIAGE HOUSE MANOR (210 PIPELINE RD)
- HOPKINS COUNTY NURSI (1333 JEFFERSON STREET)
- REGENCY TERRACE NURSING CENTER (210 PIPELINE ROAD)
- ROCK CREEK HEALTH AND REHABILITATION, LLC (1414 COLLEGE STREET)
- SULPHUR SPRINGS HEALTH AND REHABILITATION (411 AIRPORT RD)
- SULPHUR SPRINGS NURSING HOME (301 OAK AVENUE)
- SUNNY SPRINGS NURSING AND REHAB (1200 N JACKSON ST)
Dialysis Facilities in Sulphur Springs:
Home Health Centers in Sulphur Springs:
Airports and heliports located in Sulphur Springs:
- Sulphur Springs Municipal Airport (SLR) (Runways: 1, Air Taxi Ops: 60, Itinerant Ops: 5,800, Local Ops: 11,600, Military Ops: 450)
- Hidden Springs Ranch Airport (94TS) (Runways: 1)
- Hopkins County Memorial Hospital Heliport (88TX)
Colleges/universities with over 2000 students nearest to Sulphur Springs:
- Texas A & M University-Commerce (about 20 miles; Commerce, TX; Full-time enrollment: 8,890)
- Paris Junior College (about 37 miles; Paris, TX; FT enrollment: 3,875)
- Northeast Texas Community College (about 42 miles; Mount Pleasant, TX; FT enrollment: 2,320)
- Tyler Junior College (about 59 miles; Tyler, TX; FT enrollment: 8,104)
- Collin County Community College District (about 61 miles; McKinney, TX; FT enrollment: 18,044)
- The University of Texas at Tyler (about 61 miles; Tyler, TX; FT enrollment: 5,774)
- Eastfield College (about 66 miles; Mesquite, TX; FT enrollment: 8,323)
Public high schools in Sulphur Springs:
- SULPHUR SPRINGS H S (Students: 1,134, Location: 1200 CONNALLY, Grades: 9-12)
- NORTH HOPKINS H S (Students: 200, Location: 1994 FM 71 W, Grades: 7-12)
Public elementary/middle schools in Sulphur Springs:
- SULPHUR SPRINGS MIDDLE (Students: 861, Location: 835 WILDCAT WAY, Grades: 6-8)
- DOUGLAS INT (Students: 307, Location: 600 CALVERT ST, Grades: 5)
- NORTH HOPKINS EL (Students: 257, Location: 1994 FM 71 W, Grades: PK-6)
- BOWIE EL (Location: 1400 MOCKINGBIRD LN, Grades: 1-2)
- LAMAR EL (Location: 825 CHURCH ST, Grades: 1-2)
- TRAVIS EL (Location: 130 GARRISON ST, Grades: 1-2)
- SULPHUR SPRINGS EL (Location: 829 BELL ST, Grades: 3-4)
Private elementary/middle school in Sulphur Springs:
Points of interest:
Notable locations in Sulphur Springs: Hopkins County Courthouse (A), Southwest Dairy Museum (B), Hopkins County Historical Museum (C), Sulphur Springs Fire Department Station 1 - First Responders (D), Sulphur Springs Fire Station (E), Hopkins County Fire and Rescue (F). Display/hide their locations on the map
Churches in Sulphur Springs include: Saint Luke Church (A), First Presbyterian Church (B), First United Pentecostal Church (C), Wesley United Methodist Church (D), Our Savior Lutheran Church (E), Church of God (F), Shannon Oaks Church of Christ (G), Church of Christ (H), Saint James Catholic Church (I). Display/hide their locations on the map
Reservoirs: Lake Coleman (A), Century Lake (B), Helm Lake Number 2 (C), Lake Sulphur Springs (D). Display/hide their locations on the map
Creek: Black Creek (A). Display/hide its location on the map
Parks in Sulphur Springs include: Suplhur Springs City Park (1), Pacific Park (2). Display/hide their locations on the map
Tourist attraction: BGM Tours (Tours & Charters; 6653 Texas Hwy 154 South) (1). Display/hide its approximate location on the map
Hotels: Best Western Trail Dust Inn (1521 Shannon Road East) (1), Celtic Queen Country Inn (Hc 1 Box 16) (2), Budget Inn Motel (1529 Industrial Drive East) (3). Display/hide their approximate locations on the map
Birthplace of: Damione Lewis - 2005 NFL player (St. Louis Rams, born: Mar 1, 1978), John D. Cherry - Politician, Tyreo Harrison - 2005 NFL player (Houston Texans, born: May 15, 1980), David Box - US rock musician, Don Looney - Football player, Kaci Brown - Singer, Keenan Clayton - Football player, Stacy Stephens - WNBA player (New York Liberty, born: Jan 21, 1982).
| This city: | 2.5 people |
| Texas: | 2.8 people |
| This city: | 66.9% |
| Whole state: | 69.9% |
| This city: | 6.2% |
| Whole state: | 6.0% |
Likely homosexual households (counted as self-reported same-sex unmarried-partner households)
- Lesbian couples: 0.3% of all households
- Gay men: 0.2% of all households
77 people in local jails and other municipal confinement facilities in 2010
People in group quarters in Sulphur Springs in 2000:
- 334 people in nursing homes
- 93 people in local jails and other confinement facilities (including police lockups)
- 6 people in wards in general hospitals for patients who have no usual home elsewhere
Banks with branches in Sulphur Springs (2011 data):
- Alliance Bank: at 100 Jefferson Street, Drive-In Facility, South Broadway Branch, Processing Center Branch, Operations Center Branch, Drive-In Facility. Info updated 2006/11/03: Bank assets: $545.2 mil, Deposits: $488.9 mil, local headquarters, positive income, Commercial Lending Specialization, 11 total offices, Holding Company: Alliance Bancshares, Inc.
- The City National Bank of Sulphur Springs: Mockingbird Lane Branch at 1133 Mockingbird Lane, branch established on 1980/01/28; The City National Bank Of Sulphur Sp at 201 Connally Street, branch established on 1889/01/01. Info updated 2011/03/23: Bank assets: $417.9 mil, Deposits: $378.5 mil, local headquarters, positive income, 8 total offices, Holding Company: Sulphur Springs Bancshares, Inc.
- Guaranty Bond Bank: Sulphur Springs Branch at 919 Gilmer Street, branch established on 1964/01/24. Info updated 2011/07/29: Bank assets: $1,091.1 mil, Deposits: $932.8 mil, headquarters in Mount Pleasant, TX, positive income, Commercial Lending Specialization, 16 total offices, Holding Company: Guaranty Bancshares, Inc.
- Texas Heritage National Bank: Sulphur Springs-Branch at 215 N Hillcrest, branch established on 2009/01/05. Info updated 2008/05/27: Bank assets: $109.1 mil, Deposits: $86.4 mil, headquarters in Daingerfield, TX, positive income, Agricultural Specialization, 5 total offices, Holding Company: Daingerfield Holding Company
- First National Bank Texas: Sulphur Springs Banking Center - Rc at 1750 South Broadway, branch established on 1999/11/19. Info updated 2006/11/03: Bank assets: $944.3 mil, Deposits: $815.9 mil, headquarters in Killeen, TX, positive income, Mortgage Lending Specialization, 250 total offices, Holding Company: First Community Bancshares, Inc.
- Pilgrim Bank: Sulphur Springs Branch at 1404 South Braodway, branch established on 2004/02/09. Info updated 2009/11/17: Bank assets: $379.5 mil, Deposits: $302.3 mil, headquarters in Pittsburg, TX, positive income, Commercial Lending Specialization, 8 total offices, Holding Company: Pilgrim Bancorporation
For population 15 years and over in Sulphur Springs:
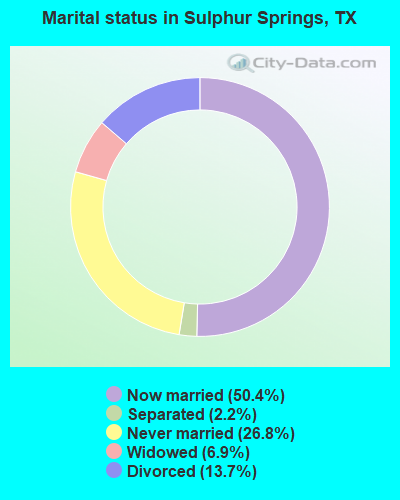
- Never married: 26.8%
- Now married: 50.4%
- Separated: 2.2%
- Widowed: 6.9%
- Divorced: 13.7%
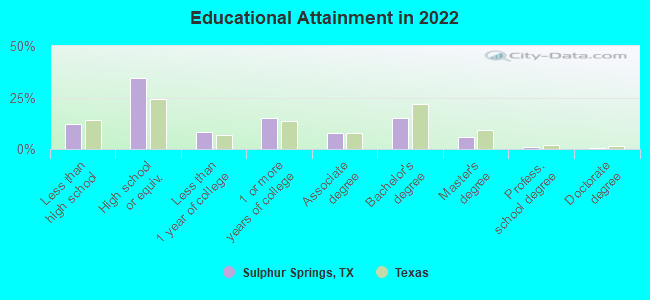
For population 25 years and over in Sulphur Springs:
- High school or higher: 86.7%
- Bachelor's degree or higher: 21.2%
- Graduate or professional degree: 7.1%
- Unemployed: 6.0%
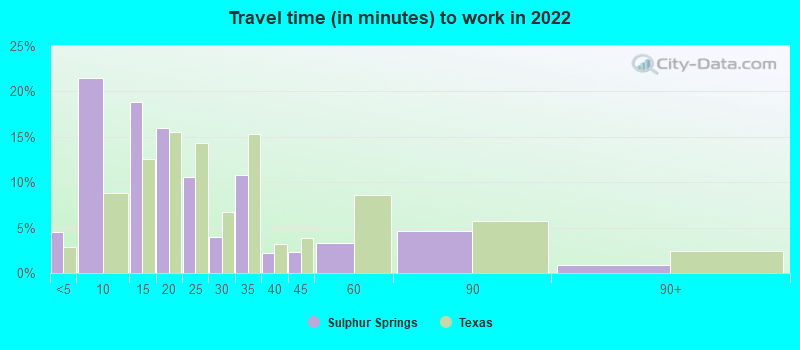
- Mean travel time to work (commute): 16.4 minutes
| Here: | 11.6 |
| Texas average: | 14.0 |
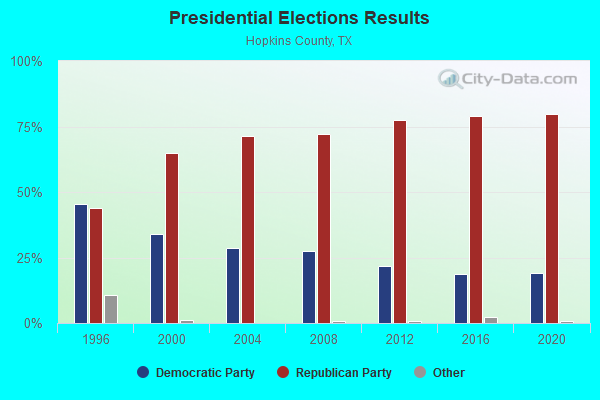
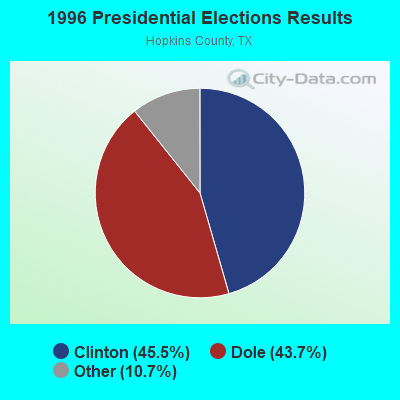
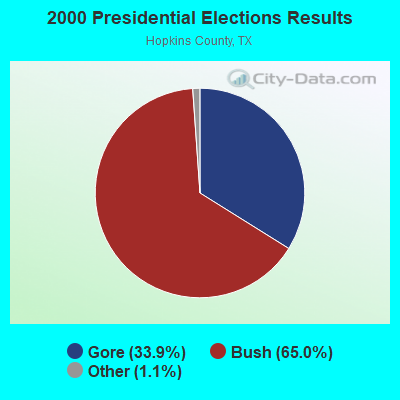
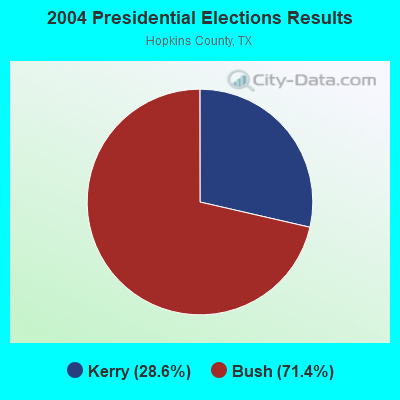
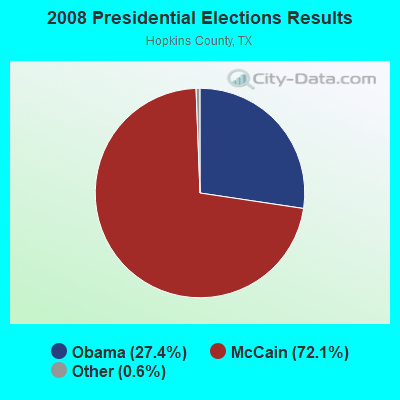
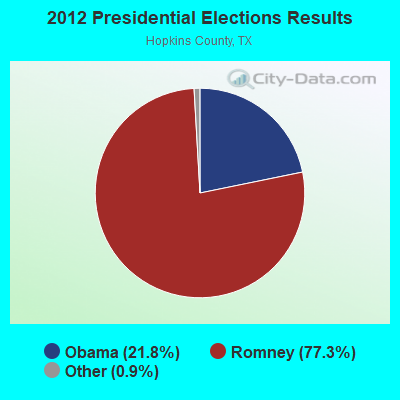
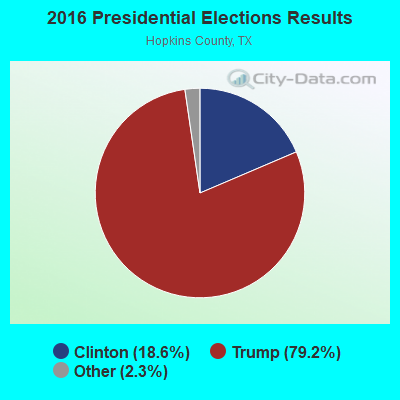
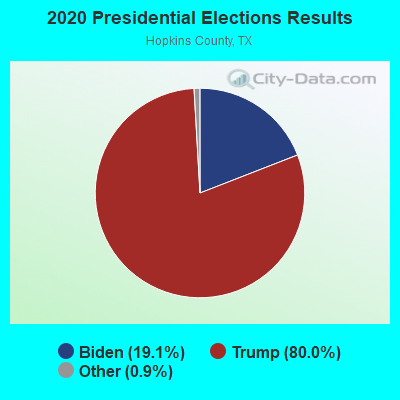
Graphs represent county-level data. Detailed 2008 Election Results
Political contributions by individuals in Sulphur Springs, TX
Religion statistics for Sulphur Springs, TX (based on Hopkins County data)
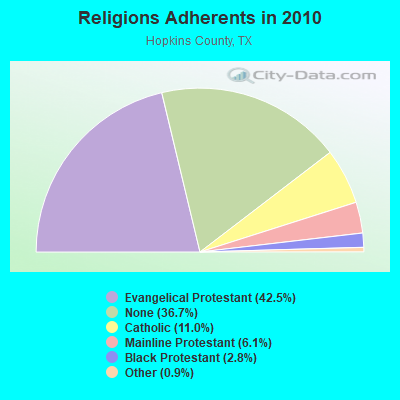
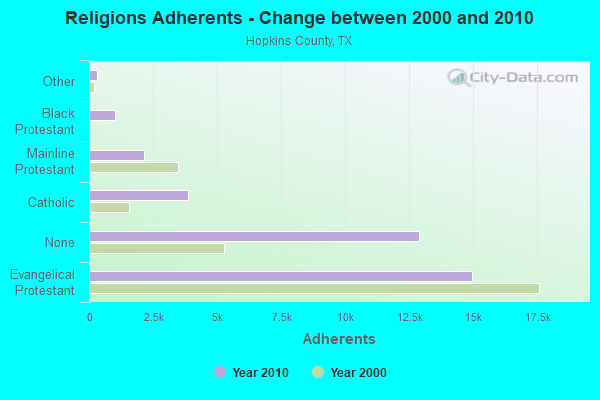
| Religion | Adherents | Congregations |
|---|---|---|
| Evangelical Protestant | 14,942 | 62 |
| Catholic | 3,860 | 1 |
| Mainline Protestant | 2,148 | 19 |
| Black Protestant | 996 | 3 |
| Other | 328 | 3 |
| None | 12,887 | - |
Food Environment Statistics:
| Hopkins County: | 0.89 / 10,000 pop. |
| State: | 1.47 / 10,000 pop. |
| Hopkins County: | 0.30 / 10,000 pop. |
| State: | 0.14 / 10,000 pop. |
| Hopkins County: | 7.42 / 10,000 pop. |
| Texas: | 3.95 / 10,000 pop. |
| This county: | 5.93 / 10,000 pop. |
| Texas: | 6.13 / 10,000 pop. |
| Hopkins County: | 10.7% |
| State: | 8.9% |
| Here: | 29.2% |
| State: | 26.6% |
| Hopkins County: | 13.7% |
| State: | 15.7% |
Health and Nutrition:
| Sulphur Springs: | 47.8% |
| Texas: | 48.6% |
| This city: | 43.5% |
| Texas: | 47.4% |
| Sulphur Springs: | 28.8 |
| Texas: | 28.5 |
| Here: | 21.8% |
| Texas: | 20.6% |
| Sulphur Springs: | 12.0% |
| Texas: | 10.3% |
| Here: | 6.8 |
| Texas: | 6.8 |
| Sulphur Springs: | 33.2% |
| Texas: | 33.1% |
| Sulphur Springs: | 53.3% |
| Texas: | 56.2% |
| This city: | 77.4% |
| Texas: | 80.7% |
More about Health and Nutrition of Sulphur Springs, TX Residents
| Local government employment and payroll (March 2022) | |||||
| Function | Full-time employees | Monthly full-time payroll | Average yearly full-time wage | Part-time employees | Monthly part-time payroll |
|---|---|---|---|---|---|
| Police Protection - Officers | 31 | $196,864 | $76,205 | 4 | $4,482 |
| Firefighters | 23 | $138,572 | $72,298 | 4 | $6,067 |
| Water Supply | 21 | $107,940 | $61,680 | 0 | $0 |
| Streets and Highways | 17 | $75,712 | $53,444 | 1 | $2,264 |
| Sewerage | 12 | $59,546 | $59,546 | 0 | $0 |
| Parks and Recreation | 12 | $45,706 | $45,706 | 0 | $0 |
| Other and Unallocable | 10 | $57,234 | $68,681 | 0 | $0 |
| Police - Other | 10 | $54,464 | $65,357 | 4 | $1,684 |
| Financial Administration | 8 | $51,584 | $77,376 | 0 | $0 |
| Local Libraries | 5 | $18,026 | $43,262 | 3 | $3,638 |
| Judicial and Legal | 3 | $21,732 | $86,928 | 4 | $4,069 |
| Fire - Other | 2 | $19,634 | $117,804 | 0 | $0 |
| Other Government Administration | 1 | $5,787 | $69,444 | 0 | $0 |
| Airports | 0 | $0 | 4 | $7,782 | |
| Totals for Government | 155 | $852,801 | $66,023 | 24 | $29,986 |
Sulphur Springs government finances - Expenditure in 2021 (per resident):
- Construction - Regular Highways: $1,249,000 ($76.12)
Water Utilities: $1,091,000 ($66.49)
Sewerage: $755,000 ($46.01)
Solid Waste Management: $511,000 ($31.14)
- Current Operations - Police Protection: $3,986,000 ($242.93)
Water Utilities: $3,943,000 ($240.31)
General - Other: $3,461,000 ($210.93)
Sewerage: $2,655,000 ($161.81)
Solid Waste Management: $2,370,000 ($144.44)
Local Fire Protection: $2,082,000 ($126.89)
Parks and Recreation: $916,000 ($55.83)
Regular Highways: $820,000 ($49.98)
Central Staff Services: $767,000 ($46.75)
Judicial and Legal Services: $663,000 ($40.41)
Financial Administration: $465,000 ($28.34)
Air Transportation: $406,000 ($24.74)
Libraries: $391,000 ($23.83)
- General - Interest on Debt: $551,000 ($33.58)
- Other Capital Outlay - Regular Highways: $982,000 ($59.85)
Air Transportation: $536,000 ($32.67)
General - Other: $162,000 ($9.87)
Parks and Recreation: $49,000 ($2.99)
- Total Salaries and Wages: $2,889,000 ($176.07)
- Water Utilities - Interest on Debt: $291,000 ($17.74)
Sulphur Springs government finances - Revenue in 2021 (per resident):
- Charges - Sewerage: $4,246,000 ($258.78)
Solid Waste Management: $3,407,000 ($207.64)
Air Transportation: $305,000 ($18.59)
Other: $3,000 ($0.18)
- Miscellaneous - Fines and Forfeits: $1,100,000 ($67.04)
General Revenue - Other: $910,000 ($55.46)
Donations From Private Sources: $91,000 ($5.55)
Interest Earnings: $48,000 ($2.93)
- Revenue - Water Utilities: $6,424,000 ($391.52)
- State Intergovernmental - Other: $604,000 ($36.81)
General Local Government Support: $171,000 ($10.42)
- Tax - General Sales and Gross Receipts: $7,037,000 ($428.88)
Property: $4,879,000 ($297.35)
Public Utilities Sales: $1,383,000 ($84.29)
Other License: $112,000 ($6.83)
Alcoholic Beverage License: $46,000 ($2.80)
Sulphur Springs government finances - Debt in 2021 (per resident):
- Long Term Debt - Beginning Outstanding - Unspecified Public Purpose: $18,285,000 ($1114.40)
Outstanding Unspecified Public Purpose: $12,662,000 ($771.70)
Retired Unspecified Public Purpose: $5,623,000 ($342.70)
Sulphur Springs government finances - Cash and Securities in 2021 (per resident):
- Bond Funds - Cash and Securities: $2,933,000 ($178.75)
- Other Funds - Cash and Securities: $12,969,000 ($790.41)
- Sinking Funds - Cash and Securities: $60,000 ($3.66)
| Businesses in Sulphur Springs, TX | ||||
| Name | Count | Name | Count | |
|---|---|---|---|---|
| AT&T | 1 | Little Caesars Pizza | 1 | |
| Arby's | 1 | Long John Silver's | 1 | |
| AutoZone | 1 | Lowe's | 1 | |
| Best Western | 1 | MasterBrand Cabinets | 1 | |
| Burger King | 1 | McDonald's | 1 | |
| CVS | 1 | Nike | 3 | |
| Comfort Suites | 1 | Payless | 1 | |
| Curves | 1 | Pizza Hut | 1 | |
| DHL | 1 | RadioShack | 1 | |
| Days Inn | 1 | SONIC Drive-In | 1 | |
| Domino's Pizza | 1 | Sprint Nextel | 1 | |
| Famous Footwear | 1 | Subway | 1 | |
| FedEx | 5 | Taco Bell | 1 | |
| GameStop | 1 | U-Haul | 2 | |
| Goodwill | 3 | UPS | 6 | |
| H&R Block | 1 | Verizon Wireless | 1 | |
| Holiday Inn | 1 | Walgreens | 1 | |
| La Quinta | 1 | Walmart | 1 | |
| Lane Furniture | 1 | |||
Strongest AM radio stations in Sulphur Springs:
- KSST (1230 AM; 1 kW; SULPHUR SPRINGS, TX; Owner: HOPKINS COUNTY BROADCASTING CO.)
- KFXR (1190 AM; 50 kW; DALLAS, TX; Owner: CLEAR CHANNEL BROADCASTING LICENSES, INC.)
- KRLD (1080 AM; 50 kW; DALLAS, TX; Owner: TEXAS INFINITY BROADCASTING L.P.)
- WBAP (820 AM; 50 kW; FORT WORTH, TX; Owner: WBAP-KSCS OPERATING, LTD.)
- KSKY (660 AM; 20 kW; BALCH SPRINGS, TX; Owner: BISON MEDIA, INC.)
- KEEL (710 AM; 50 kW; SHREVEPORT, LA; Owner: CITICASTERS LICENSES, L.P.)
- KZMP (1540 AM; 50 kW; UNIVERSITY PARK, TX; Owner: ENTRAVISION HOLDINGS, LLC)
- KESS (1270 AM; 50 kW; FORT WORTH, TX; Owner: KESS-AM LICENSE CORP.)
- KWKH (1130 AM; 50 kW; SHREVEPORT, LA; Owner: CITICASTERS LICENSES, L.P.)
- KAAM (770 AM; 10 kW; GARLAND, TX; Owner: DONTRON, INC.)
- KBIS (1150 AM; 25 kW; HIGHLAND PARK, TX; Owner: DALLAS AM RADIO PARTNERS, L.P.)
- KAHZ (1360 AM; 50 kW; HURST, TX)
- KMKI (620 AM; 5 kW; PLANO, TX; Owner: ABC, INC)
Strongest FM radio stations in Sulphur Springs:
- KSCH (95.9 FM; SULPHUR SPRINGS, TX; Owner: EAST TEXAS BROADCASTING, INC.)
- KRVA-FM (107.1 FM; CAMPBELL, TX; Owner: FIRST BROADCASTING INVESTMENT PARTNERS, LLC)
- KXVX-LP (99.1 FM; SULPHUR SPRINGS, TX; Owner: SULPHUR SPRINGS BROADCASTING COMPANY)
- KLTY (94.9 FM; ARLINGTON, TX; Owner: INSPIRATION MEDIA OF TEXAS, LLC)
- KALK (97.7 FM; WINFIELD, TX; Owner: EAST TEXAS BROADCASTING, INC.)
- KWNS (104.7 FM; WINNSBORO, TX; Owner: RICHARD E. FOSTER)
- KETR (88.9 FM; COMMERCE, TX; Owner: TEXAS A&M UNIVERSITY-COMMERCE)
- KDVE (103.1 FM; PITTSBURG, TX; Owner: ON-AIR FAMILY, LLC)
- KIKT (93.5 FM; GREENVILLE, TX; Owner: KRBE LICO, INC.)
TV broadcast stations around Sulphur Springs:
- KTAQ (Channel 47; GREENVILLE, TX; Owner: MIKE SIMONS)
- K42DA (Channel 42; PARIS, TX; Owner: TRINITY BROADCASTING NETWORK)
- KNOK-LP (Channel 43; GREENVILLE, TX; Owner: IGLESIA JESU CHRISTO ES MI REFUGIO, INC.)
- National Bridge Inventory (NBI) Statistics
- 98Number of bridges
- 823ft / 251mTotal length
- $856,000Total costs
- 807,106Total average daily traffic
- 217,320Total average daily truck traffic
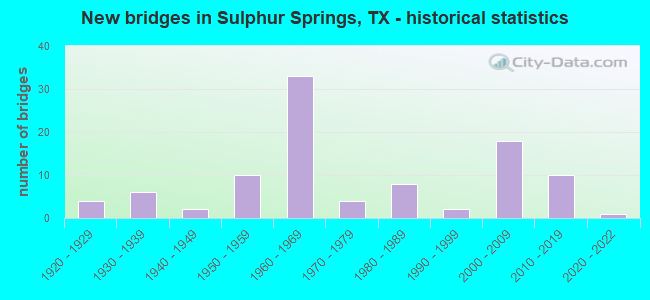
- New bridges - historical statistics
- 41920-1929
- 61930-1939
- 21940-1949
- 101950-1959
- 331960-1969
- 41970-1979
- 81980-1989
- 21990-1999
- 182000-2009
- 102010-2019
- 12020-2022
FCC Registered Private Land Mobile Towers: 2 (See the full list of FCC Registered Private Land Mobile Towers in Sulphur Springs, TX)
FCC Registered Broadcast Land Mobile Towers: 33 (See the full list of FCC Registered Broadcast Land Mobile Towers)
FCC Registered Microwave Towers: 57 (See the full list of FCC Registered Microwave Towers in this town)
FCC Registered Paging Towers: 5 (See the full list of FCC Registered Paging Towers)
FCC Registered Maritime Coast & Aviation Ground Towers: 3 (See the full list of FCC Registered Maritime Coast & Aviation Ground Towers)
FCC Registered Amateur Radio Licenses: 107 (See the full list of FCC Registered Amateur Radio Licenses in Sulphur Springs)
FAA Registered Aircraft Manufacturers and Dealers: 1 (See the full list of FAA Registered Manufacturers and Dealers in Sulphur Springs)
FAA Registered Aircraft: 45 (See the full list of FAA Registered Aircraft)
2002 - 2018 National Fire Incident Reporting System (NFIRS) incidents
- Fire incident types reported to NFIRS in Sulphur Springs, TX
- 2,79762.0%Outside Fires
- 99322.0%Structure Fires
- 60013.3%Mobile Property/Vehicle Fires
- 1232.7%Other
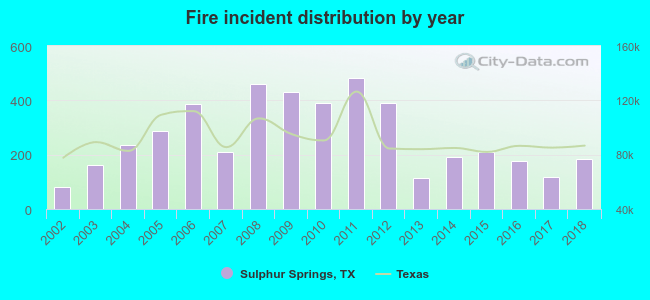 According to the data from the years 2002 - 2018 the average number of fires per year is 265. The highest number of reported fire incidents - 482 took place in 2011, and the least - 82 in 2002. The data has an increasing trend.
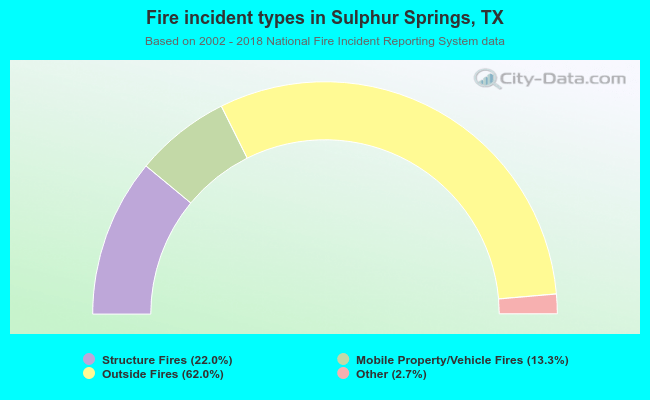 When looking into fire subcategories, the most incidents belonged to: Outside Fires (62.0%), and Structure Fires (22.0%).
Fire-safe hotels and motels in Sulphur Springs, Texas:
- Best Western Trail Dust Inn, 1521 Shannon Rd, Sulphur Springs, Texas 75482 , Phone: (903) 885-7515, Fax: (903) 885-7515
- Days Inn, 1495 Industrial Dr E, Sulphur Springs, Texas 75482 , Phone: (903) 885-0562, Fax: (903) 885-0562
- Comfort Suites, 1521 Industrial Dr E, Sulphur Springs, Texas 75482 , Phone: (903) 438-0918, Fax: (903) 438-0329
- Holiday Inn Express, 411 E Industrial Dr, Sulphur Springs, Texas 75482 , Phone: (903) 885-6851, Fax: (903) 885-6941
- La Quinta Inn & Suites, 1344 Eaton Dr, Sulphur Springs, Texas 75482 , Phone: (903) 885-8181, Fax: (903) 885-8121
- Hampton Inn, 1202 Mockingbird Ln, Sulphur Springs, Texas 75482 , Phone: (903) 439-4646, Fax: (903) 439-4747
| Most common first names in Sulphur Springs, TX among deceased individuals | ||
| Name | Count | Lived (average) |
|---|---|---|
| William | 190 | 76.5 years |
| Mary | 178 | 80.1 years |
| James | 174 | 73.4 years |
| John | 171 | 75.3 years |
| Robert | 107 | 75.8 years |
| Willie | 81 | 79.2 years |
| Ruth | 79 | 81.2 years |
| Thomas | 79 | 74.7 years |
| Charles | 78 | 69.5 years |
| George | 73 | 77.8 years |
| Most common last names in Sulphur Springs, TX among deceased individuals | ||
| Last name | Count | Lived (average) |
|---|---|---|
| Smith | 113 | 77.5 years |
| Williams | 100 | 77.0 years |
| Johnson | 87 | 71.8 years |
| Jones | 82 | 79.3 years |
| Moore | 60 | 77.5 years |
| Martin | 53 | 74.8 years |
| Wright | 51 | 74.8 years |
| Thomas | 49 | 75.7 years |
| Allen | 43 | 77.7 years |
| Morgan | 38 | 79.1 years |
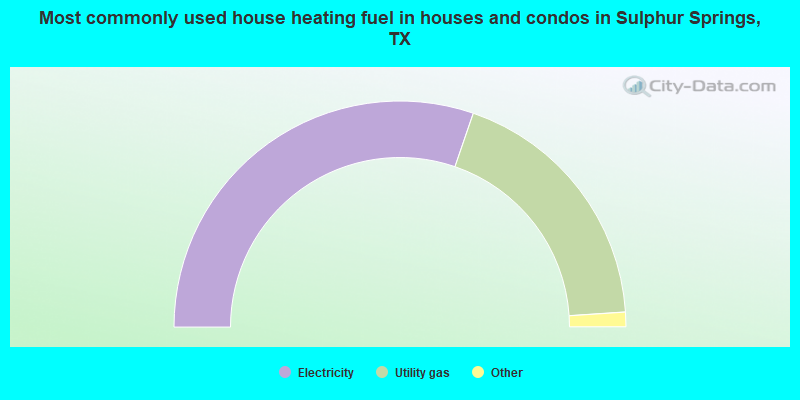
- 60.6%Electricity
- 37.4%Utility gas
- 1.5%Bottled, tank, or LP gas
- 0.5%Wood
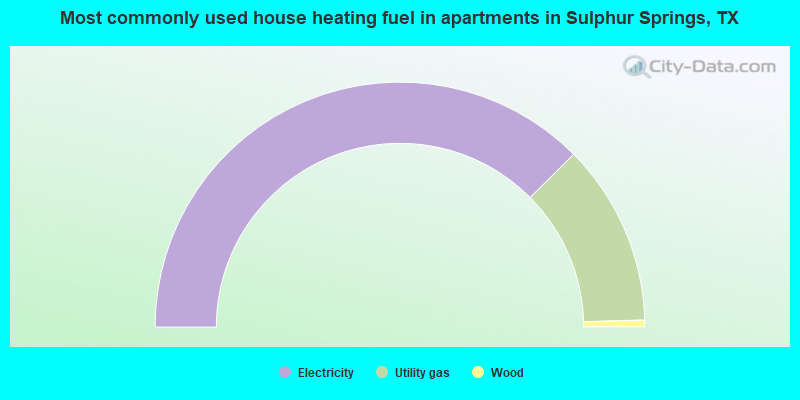
- 75.1%Electricity
- 24.0%Utility gas
- 0.9%Wood
Sulphur Springs compared to Texas state average:
- Unemployed percentage below state average.
- Hispanic race population percentage below state average.
- Median age above state average.
- Foreign-born population percentage below state average.
- Length of stay since moving in significantly above state average.
Sulphur Springs on our top lists:
- #63 on the list of "Top 101 cities with largest percentage of males in industries: wholesale trade (population 5,000+)"
- #73 on the list of "Top 101 cities with largest percentage of females in industries: wholesale trade (population 5,000+)"

|
|
Total of 22 patent applications in 2008-2024.