Estimated zip code population in 2022: 5,054 Zip code population in 2010: 5,718 Zip code population in 2000: 5,028
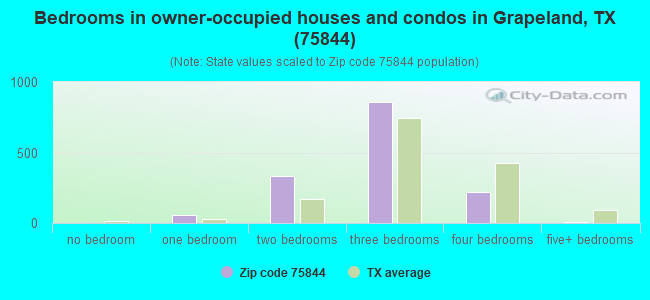
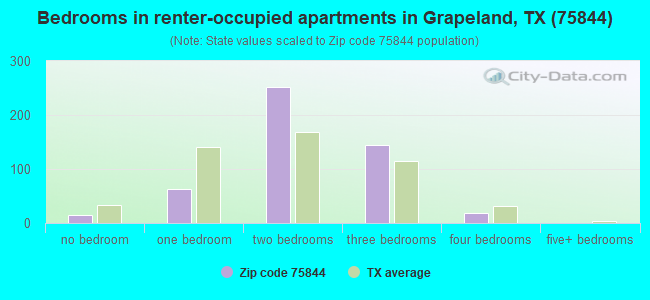
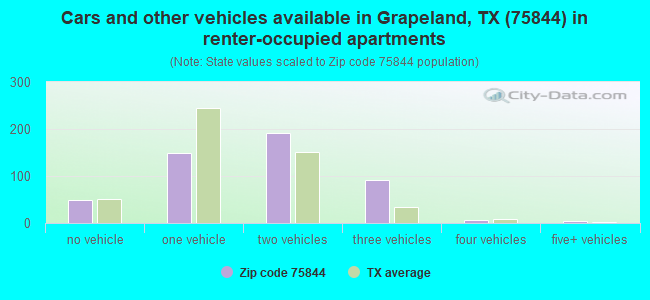
Houses and condos: 3,065 Renter-occupied apartments: 498
% of renters here:
25%
State:
38%
March 2022 cost of living index in zip code 75844: 79.1 (low, U.S. average is 100)
Land area: 359.6 sq. mi. Water area: 3.2 sq. mi.
Population density: 14 people per square mile
(very low).
OSM Map
General Map
Google Map
MSN Map
OSM Map
General Map
Google Map
MSN Map
OSM Map
General Map
Google Map
MSN Map
OSM Map
General Map
Google Map
MSN Map
Please wait while loading the map...
Real estate property taxes paid for housing units in 2022:
This zip code:
0.9% ($1,244)
Texas:
1.5% ($4,050)
Median real estate property taxes paid for housing units with mortgages in 2022: $1,362 (0.9%) Median real estate property taxes paid for housing units with no mortgage in 2022: $1,179 (0.9%)
Business Search- 14 Million verified businesses
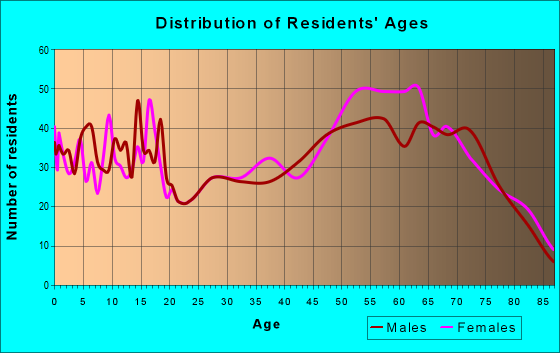
Males: 2,479
(49.1%)
Females: 2,574
(50.9%)
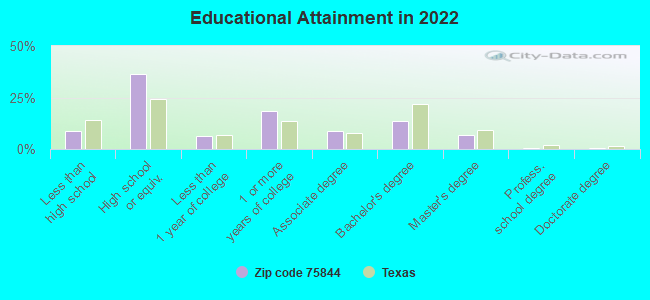
For population 25 years and over in 75844:
High school or higher: 90.0%
Bachelor's degree or higher: 21.3%
Graduate or professional degree: 7.8%
Unemployed: 4.7%
Mean travel time to work (commute): 25.5 minutes
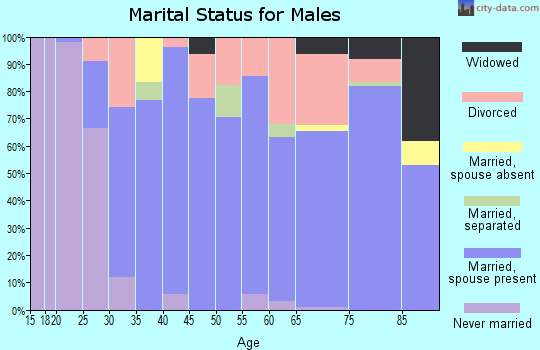
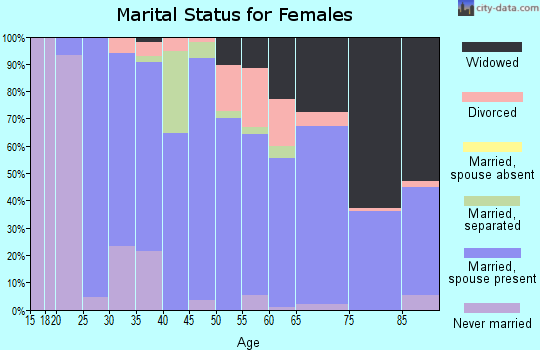
For population 15 years and over in 75844:
Never married: 20.5%
Now married: 60.7%
Separated: 1.8%
Widowed: 6.2%
Divorced: 10.9%
Zip code 75844 compared to state average:
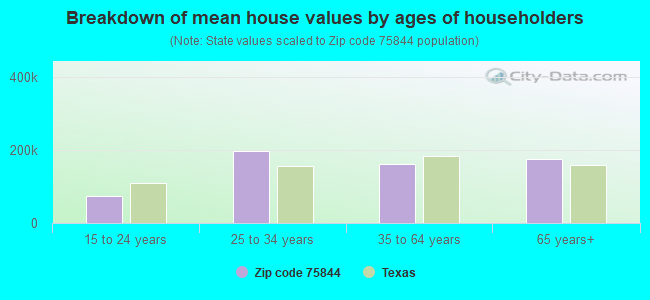
Median house value below state average.
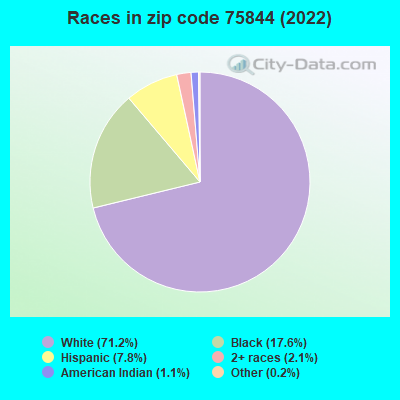
Hispanic race population percentage significantly below state average.
Median age significantly above state average.
Foreign-born population percentage significantly below state average.
Length of stay since moving in significantly above state average.
Averages for the 2020 tax year for zip code 75844, filed in 2021:
Average Adjusted Gross Income (AGI) in 2020: $56,985 (Individual Income Tax Returns)
Here:
$56,985
State:
$77,054
Salary/wage: $47,660 (reported on 76.8% of returns)
Here:
$47,660
State:
$62,766
(% of AGI for various income ranges: 1336.0% for AGIs below $25k, 3454.0% for AGIs $25k-50k, 5928.7% for AGIs $50k-75k, 9297.7% for AGIs $75k-100k, 15105.3% for AGIs $100k-200k, 47815.0% for AGIs over 200k)
Taxable interest for individuals: $1,700 (reported on 29.1% of returns)
This zip code:
$1,700
Texas:
$2,665
(% of AGI for various income ranges: 15.0% for AGIs below $25k, 41.6% for AGIs $25k-50k, 30.0% for AGIs $50k-75k, 89.2% for AGIs $75k-100k, 137.3% for AGIs $100k-200k, 2155.0% for AGIs over 200k)
Ordinary dividends: $5,600 (reported on 20.0% of returns)
Here:
$5,600
State:
$10,044
(% of AGI for various income ranges: 30.7% for AGIs below $25k, 86.0% for AGIs $25k-50k, 114.8% for AGIs $50k-75k, 171.5% for AGIs $75k-100k, 326.0% for AGIs $100k-200k, 4700.0% for AGIs over 200k)
Net capital gain/loss in AGI: +$9,514 (reported on 16.8% of returns)
Here:
+$9,514
State:
+$39,590
(% of AGI for various income ranges: 14.0% for AGIs below $25k, 14.0% for AGIs $25k-50k, 150.4% for AGIs $50k-75k, 220.0% for AGIs $75k-100k, 708.0% for AGIs $100k-200k, 8425.0% for AGIs over 200k)
Profit/loss from business: +$10,935 (reported on 16.8% of returns)
Here:
+$10,935
State:
+$10,888
(% of AGI for various income ranges: 135.7% for AGIs below $25k, 79.8% for AGIs $25k-50k, 300.9% for AGIs $50k-75k, 296.9% for AGIs $75k-100k, 1225.3% for AGIs $100k-200k)
Taxable individual retirement arrangement distribution: $27,200 (reported on 12.7% of returns)
75844:
$27,200
Texas:
$24,740
(% of AGI for various income ranges: 76.4% for AGIs below $25k, 203.7% for AGIs $25k-50k, 442.2% for AGIs $50k-75k, 619.2% for AGIs $75k-100k, 2983.3% for AGIs $100k-200k)
Total itemized deductions: $38,688 (reported on 3.6% of returns)
Here:
$38,688
State:
$40,428
(% of AGI for various income ranges: 244.4% for AGIs $25k-50k, 641.5% for AGIs $75k-100k, 6050.0% for AGIs over 200k)
Charity contributions: $21,100 (reported on 2.7% of returns)
Here:
$21,100
State:
$18,201
(% of AGI for various income ranges: 192.2% for AGIs $50k-75k, 4120.0% for AGIs over 200k)
Taxes paid: $5,988 (reported on 3.6% of returns)
75844:
$5,988
State:
$7,821
(% of AGI for various income ranges: 36.0% for AGIs $25k-50k, 121.5% for AGIs $75k-100k, 830.0% for AGIs over 200k)
Earned income credit: $2,591 (reported on 20.5% of returns)
Here:
$2,591
State:
$2,584
(% of AGI for various income ranges: 133.3% for AGIs below $25k, 91.4% for AGIs $25k-50k)
Percentage of individuals using paid preparers for their 2020 taxes: 92.7%
Here:
93%
State:
92%
(% for various income ranges: 93.8% for AGIs below $25k, 94.5% for AGIs $25k-50k, 90.9% for AGIs $50k-75k, 90.0% for AGIs $75k-100k, 92.0% for AGIs $100k-200k, 85.7% for AGIs over 200k)
Averages for the 2012 tax year for zip code 75844, filed in 2013:
Average Adjusted Gross Income (AGI) in 2012: $48,244 (Individual Income Tax Returns)
Here:
$48,244
State:
$65,384
Salary/wage: $38,759 (reported on 78.8% of returns)
Here:
$38,759
State:
$52,524
(% of AGI for various income ranges: 74.2% for AGIs below $25k, 75.6% for AGIs $25k-50k, 74.0% for AGIs $50k-75k, 74.7% for AGIs $75k-100k, 62.1% for AGIs $100k-200k, 26.4% for AGIs over 200k)
Taxable interest for individuals: $1,481 (reported on 29.7% of returns)
This zip code:
$1,481
Texas:
$2,372
(% of AGI for various income ranges: 1.5% for AGIs below $25k, 1.2% for AGIs $25k-50k, 0.7% for AGIs $50k-75k, 0.6% for AGIs $75k-100k, 0.9% for AGIs $100k-200k, 0.8% for AGIs over 200k)
Ordinary dividends: $4,090 (reported on 18.4% of returns)
Here:
$4,090
State:
$9,721
(% of AGI for various income ranges: 1.6% for AGIs below $25k, 1.3% for AGIs $25k-50k, 0.9% for AGIs $50k-75k, 1.3% for AGIs $75k-100k, 1.6% for AGIs $100k-200k, 2.5% for AGIs over 200k)
Net capital gain/loss in AGI: +$15,850 (reported on 13.2% of returns)
Here:
+$15,850
State:
+$35,319
(% of AGI for various income ranges: 0.8% for AGIs below $25k, 1.0% for AGIs $50k-75k, 2.0% for AGIs $75k-100k, 4.0% for AGIs $100k-200k, 16.2% for AGIs over 200k)
Profit/loss from business: +$11,592 (reported on 18.4% of returns)
Here:
+$11,592
State:
+$13,732
(% of AGI for various income ranges: 8.2% for AGIs below $25k, 4.4% for AGIs $25k-50k, 3.5% for AGIs $50k-75k, 2.2% for AGIs $75k-100k, 9.4% for AGIs $100k-200k)
Taxable individual retirement arrangement distribution: $17,763 (reported on 12.7% of returns)
75844:
$17,763
Texas:
$19,511
(% of AGI for various income ranges: 5.8% for AGIs below $25k, 3.8% for AGIs $25k-50k, 3.5% for AGIs $50k-75k, 5.5% for AGIs $75k-100k, 10.2% for AGIs $100k-200k)
Total itemized deductions: $21,389 (22% of AGI, reported on 17.5% of returns)
Here:
$21,389
State:
$24,724
Here:
22.5% of AGI
State:
15.9% of AGI
(% of AGI for various income ranges: 7.0% for AGIs below $25k, 7.5% for AGIs $25k-50k, 8.5% for AGIs $50k-75k, 8.4% for AGIs $75k-100k, 9.0% for AGIs $100k-200k, 5.9% for AGIs over 200k)
Charity contributions: $6,608 (reported on 12.3% of returns)
Here:
$6,608
State:
$6,808
(% of AGI for various income ranges: 0.7% for AGIs below $25k, 1.6% for AGIs $25k-50k, 1.3% for AGIs $50k-75k, 2.1% for AGIs $75k-100k, 1.9% for AGIs $100k-200k, 2.1% for AGIs over 200k)
Taxes paid: $3,416 (reported on 17.5% of returns)
75844:
$3,416
State:
$6,921
(% of AGI for various income ranges: 1.0% for AGIs below $25k, 1.1% for AGIs $25k-50k, 1.1% for AGIs $50k-75k, 1.5% for AGIs $75k-100k, 1.7% for AGIs $100k-200k, 1.0% for AGIs over 200k)
Earned income credit: $2,450 (reported on 22.6% of returns)
Here:
$2,450
State:
$2,570
(% of AGI for various income ranges: 8.1% for AGIs below $25k, 1.4% for AGIs $25k-50k)
Percentage of individuals using paid preparers for their 2012 taxes: 59.9%
Here:
60%
State:
51%
(% for various income ranges: 54.4% for AGIs below $25k, 58.2% for AGIs $25k-50k, 64.5% for AGIs $50k-75k, 70.6% for AGIs $75k-100k, 66.7% for AGIs $100k-200k, 100.0% for AGIs over 200k)
Averages for the 2004 tax year for zip code 75844, filed in 2005:
Average Adjusted Gross Income (AGI) in 2004: $32,578 (Individual Income Tax Returns)
Here:
$32,578
State:
$47,881
Salary/wage: $31,968 (reported on 77.3% of returns)
Here:
$31,968
State:
$41,947
(% of AGI for various income ranges: 70.2% for AGIs $10k-25k, 77.7% for AGIs $25k-50k, 75.6% for AGIs $50k-75k, 73.0% for AGIs $75k-100k, 61.5% for AGIs over 100k)
Taxable interest for individuals: $1,695 (reported on 38.8% of returns)
This zip code:
$1,695
Texas:
$2,255
(% of AGI for various income ranges: 3.9% for AGIs $10k-25k, 1.7% for AGIs $25k-50k, 1.3% for AGIs $50k-75k, 1.2% for AGIs $75k-100k, 1.1% for AGIs over 100k)
Taxable dividends: $2,000 (reported on 20.4% of returns)
Here:
$2,000
State:
$4,261
(% of AGI for various income ranges: 1.2% for AGIs $10k-25k, 1.3% for AGIs $25k-50k, 0.8% for AGIs $50k-75k, 0.7% for AGIs $75k-100k, 1.9% for AGIs over 100k)
Net capital gain/loss: +$3,744 (reported on 19.2% of returns)
Here:
+$3,744
State:
+$16,110
(% of AGI for various income ranges: 1.9% for AGIs $10k-25k, 1.1% for AGIs $25k-50k, 1.7% for AGIs $50k-75k, 1.1% for AGIs $75k-100k, 6.2% for AGIs over 100k)
Profit/loss from business: +$7,661 (reported on 18.5% of returns)
Here:
+$7,661
State:
+$11,013
(% of AGI for various income ranges: 5.5% for AGIs $10k-25k, 2.6% for AGIs $25k-50k, 4.8% for AGIs $50k-75k, 2.7% for AGIs $75k-100k, 4.0% for AGIs over 100k)
IRA payment deduction: $3,167 (reported on 1.5% of returns)
75844:
$3,167
Texas:
$3,120
Total itemized deductions: $16,362 (28% of AGI, reported on 16.2% of returns)
Here:
$16,362
State:
$19,631
Here:
28.3% of AGI
State:
18.9% of AGI
(% of AGI for various income ranges: 7.4% for AGIs $10k-25k, 7.8% for AGIs $25k-50k, 8.0% for AGIs $50k-75k, 9.2% for AGIs $75k-100k, 7.4% for AGIs over 100k)
Charity contributions deductions: $4,798 (8% of AGI, reported on 13.5% of returns)
Here:
$4,798
State:
$4,753
Here:
8.1% of AGI
State:
4.2% of AGI
(% of AGI for various income ranges: 1.6% for AGIs $10k-25k, 1.4% for AGIs $25k-50k, 2.0% for AGIs $50k-75k, 3.0% for AGIs $75k-100k, 2.4% for AGIs over 100k)
Total tax: $4,612 (reported on 67.0% of returns)
75844:
$4,612
State:
$9,058
(% of AGI for various income ranges: 3.3% for AGIs $10k-25k, 6.2% for AGIs $25k-50k, 9.3% for AGIs $50k-75k, 11.6% for AGIs $75k-100k, 18.7% for AGIs over 100k)
Earned income credit: $1,942 (reported on 22.5% of returns)
Here:
$1,942
State:
$2,024
Percentage of individuals using paid preparers for their 2004 taxes: 69.3%
Here:
69%
State:
57%
(% for various income ranges: 64.4% for AGIs below $10k, 69.8% for AGIs $10k-25k, 70.3% for AGIs $25k-50k, 71.3% for AGIs $50k-75k, 74.6% for AGIs $75k-100k, 75.0% for AGIs over 100k)
Household received Food Stamps/SNAP in the past 12 months: 375 Household did not receive Food Stamps/SNAP in the past 12 months: 1,611
Women who had a birth in the past 12 months: 199 (106 now married, 91 unmarried) Women who did not have a birth in the past 12 months: 854 (419 now married, 433 unmarried)
Housing units in zip code 75844 with a mortgage: 515 (26 second mortgage, 19 both second mortgage and home equity loan) Median monthly owner costs for units with a mortgage: $1,162 Median monthly owner costs for units without a mortgage: $487
Residents with income below the poverty level in 2022:
This zip code:
9.7%
Whole state:
14.0%
Residents with income below 50% of the poverty level in 2022:
This zip code:
4.7%
Whole state:
7.4%
Median number of rooms in houses and condos:
Here:
5.6
State:
6.3
Median number of rooms in apartments:
Here:
4.4
State:
4.0
Notable locations in this zip code not listed on our city pages
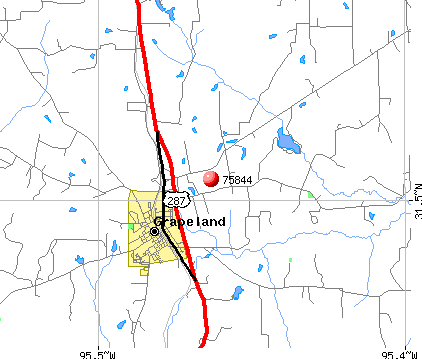
Notable locations in zip code 75844: Neches Bluff Overlook (A), Pepper Tree (B), Edens-Madden Massacre Site (C), Neches Bluff Campground (D), Johua Hall Sawmill (E), Johua Hall Grain Mill (F), Clark Cotton Gin (G), Walling Brick Factory (H), Gilbreath Memorial Library (I), Mamie George Branch Library (J), Missouri City Branch Library (K), Grapeland Volunteer Fire Department / Emergency Medical Services (L), Weches Volunteer Fire Department (M). Display/hide their locations on the map
Churches in zip code 75844 include: San Pedro Church (A), Union Chapel (B), Pennington Chapel (C), Philadelphia Church (D), Augusta Community Christian Church (E), Augusta Union Church (F), Brewington Church (G), Shiloh Church (H), Cedar Branch Church (I). Display/hide their locations on the map
Cemeteries: Tyer Cemetery (1), Post Oak Cemetery (2), Gulceville Cemetery (3), Edens-Madden Massacre Cemetery (4), San Pedro Cemetery (5), Walling Cemetery (6), Ferrell Women Graves (7). Display/hide their locations on the map
Lakes, reservoirs, and swamps: Krem Lake (A), Sawmill Lake (B), Bobbitt Lake (C), Hargrove Lake (D), Grove Lakes (E), Mission Lake (F), Horseshoe Lake (G), Ben Lake (H). Display/hide their locations on the map
Streams, rivers, and creeks: Bird Branch (A), Box Creek (B), Bennett Creek (C), Zach Branch (D), Rich Creek (E), Bowles Creek (F), Bluff Creek (G), Bodenhamer Creek (H), Copperas Branch (I). Display/hide their locations on the map
Size of family households: 770 2-persons, 342 3-persons, 224 4-persons, 96 5-persons, 24 6-persons, 3 7-or-more-persons
Size of nonfamily households: 441 1-person, 78 2-persons, 3 4-persons
632 married couples with children.
211 single-parent households (38 men, 173 women).
95.4% of residents of 75844 zip code speak English at home.
4.8% of residents speak Spanish at home (68% very well, 13% well, 19% not well).
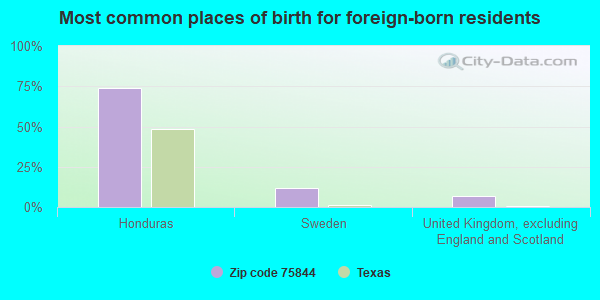
Foreign born population: 162 (3.2%) (17.0% of them are naturalized citizens)
This zip code:
3.2%
Whole state:
17.2%
74%Honduras
12%Sweden
7%United Kingdom, excluding England and Scotland
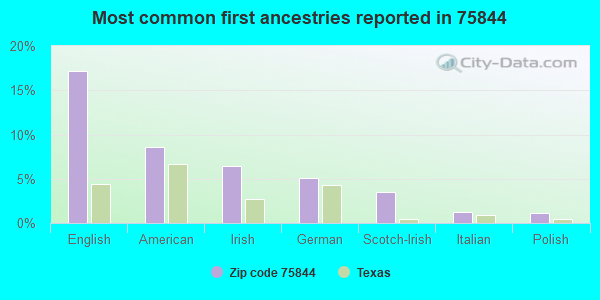
17%English
9%American
6%Irish
5%German
3%Scotch-Irish
1%Italian
1%Polish
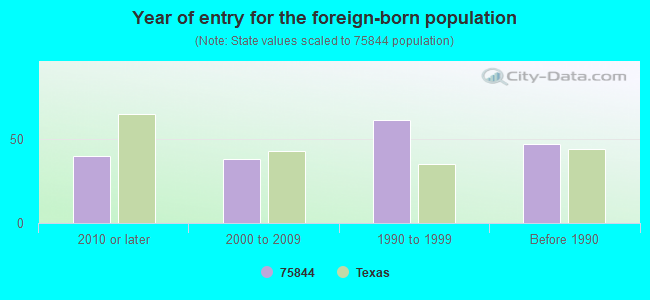
Year of entry for the foreign-born population
402010 or later
382000 to 2009
611990 to 1999
47Before 1990
Housing units lacking complete plumbing facilities: 7.6% Housing units lacking complete kitchen facilities: 10.0%
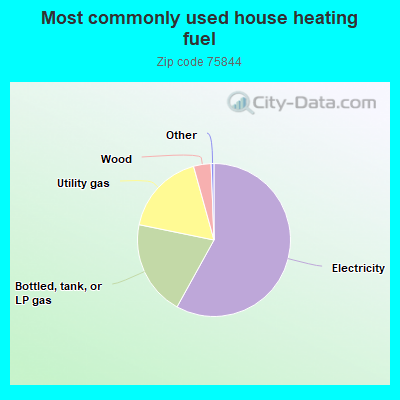
58.1%Electricity
20.2%Bottled, tank, or LP gas
17.5%Utility gas
3.7%Wood
Population in 1990: 4,705. Population change in the 1990s: +323 (+6.9%).
Place of birth for U.S.-born residents:
This state: 3,795
Northeast: 87
Midwest: 209
South: 414
West: 330
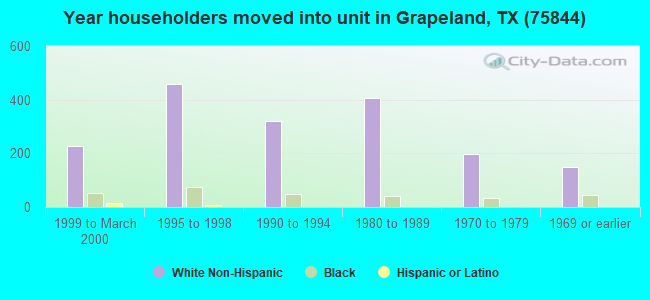
63% of the 75844 zip code residents lived in the same house 5 years ago. Out of people who lived in different houses, 49% lived in this county. Out of people who lived in different counties, 50% lived in Texas.
96% of the 75844 zip code residents lived in the same house 1 year ago. Out of people who lived in different houses, 27% moved from this county. Out of people who lived in different houses, 74% moved from different county within same state. Out of people who lived in different houses, 8% moved from abroad.
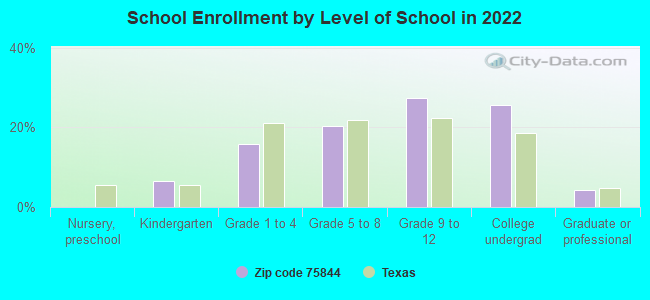
Private vs. public school enrollment:
Students in private schools in grades 1 to 8 (elementary and middle school): 17
Here:
4.9%
Texas:
8.8%
Students in private schools in grades 9 to 12 (high school): 41
Here:
14.9%
Texas:
8.0%
Students in private undergraduate colleges: 35
Here:
13.8%
Texas:
16.2%
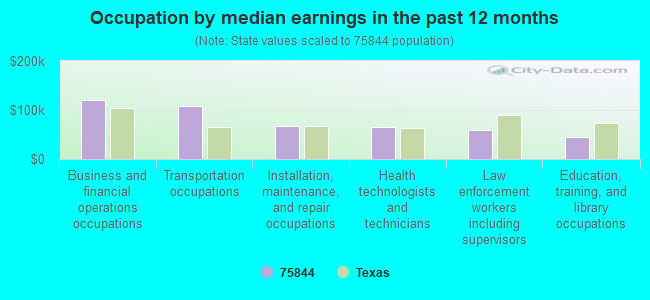
Occupation by median earnings in the past 12 months ($)
119,967Business and financial operations occupations
107,586Transportation occupations
67,030Installation, maintenance, and repair occupations
66,156Health technologists and technicians
58,874Law enforcement workers including supervisors
45,539Education, training, and library occupations
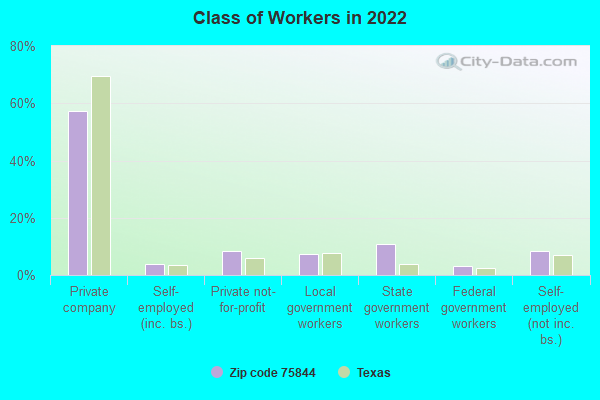
Top industries in this zip code by the number of employees in 2005:
Health Care and Social Assistance: Nursing Care Facilities (50-99 employees: 1 establishment)
Construction: Site Preparation Contractors (20-49: 1)
Accommodation and Food Services: Recreational and Vacation Camps (except Campgrounds) (10-19: 1)
Information: Radio Stations (10-19: 1)
Construction: Poured Concrete Foundation and Structure Contractors (10-19: 1)
People in group quarters in 2000:
58 people in nursing homes
Fatal accident statistics in 2014:
Fatal accident count: 3
Vehicles involved in fatal accidents: 4
Fatal accidents caused by drunken drivers: 1
Fatalities: 3
Persons involved in fatal accidents: 5
Pedestrians involved in fatal accidents: 0
Fatal accident statistics in 2013:
Fatal accident count: 1
Vehicles involved in fatal accidents: 2
Fatal accidents caused by drunken drivers: 0
Fatalities: 1
Persons involved in fatal accidents: 2
Pedestrians involved in fatal accidents: 0
2002 - 2018 National Fire Incident Reporting System (NFIRS) incidents
According to the data from the years 2002 - 2018 the average number of fire incidents per year is 46. The highest number of reported fire incidents - 72 took place in 2011, and the least - 30 in 2016. The data has a rising trend.
When looking into fire subcategories, the most incidents belonged to: Outside Fires (67.4%), and Structure Fires (19.9%).
Fire incident types reported to NFIRS in Zip Code 75844
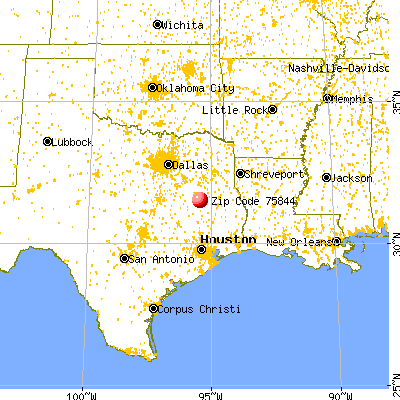


 Nearest zip codes: 75849, 75839, 75835, 75801, 75847, 75858.
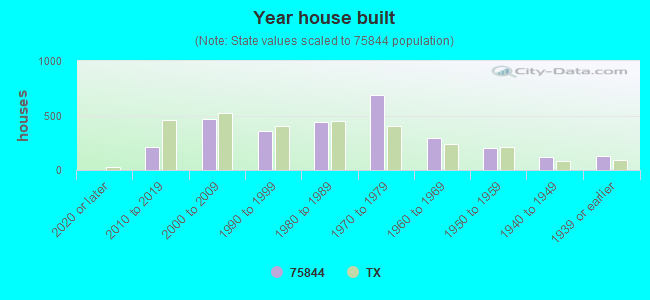


 According to the data from the years 2002 - 2018 the average number of fire incidents per year is 46. The highest number of reported fire incidents - 72 took place in 2011, and the least - 30 in 2016. The data has a rising trend.
 When looking into fire subcategories, the most incidents belonged to: Outside Fires (67.4%), and Structure Fires (19.9%).