Estimated zip code population in 2022: 4,916 Zip code population in 2010: 5,371 Zip code population in 2000: 5,997
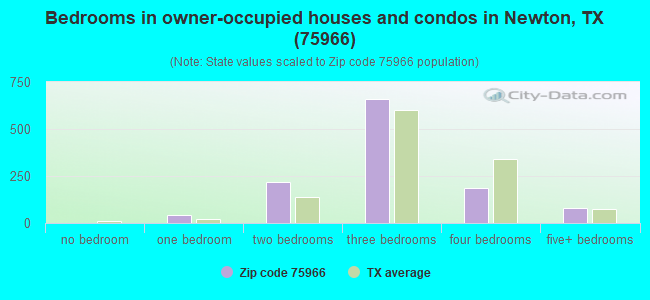
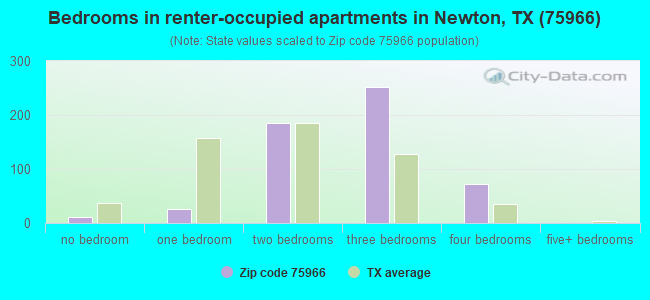
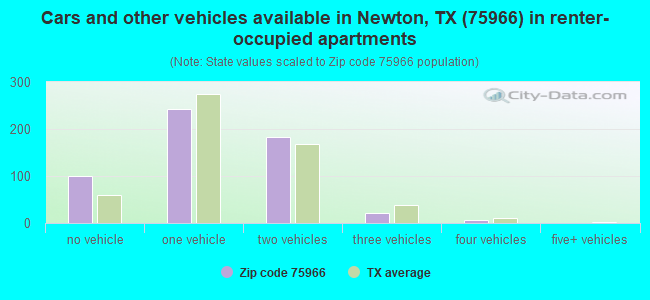
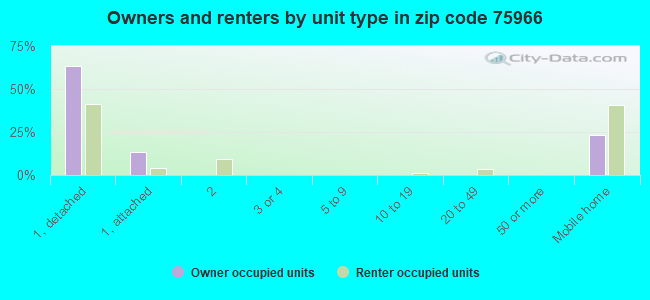
Houses and condos: 2,187 Renter-occupied apartments: 552
% of renters here:
32%
State:
38%
March 2022 cost of living index in zip code 75966: 79.6 (low, U.S. average is 100)
Land area: 270.9 sq. mi. Water area: 0.8 sq. mi.
Population density: 18 people per square mile
(very low).
OSM Map
General Map
Google Map
MSN Map
OSM Map
General Map
Google Map
MSN Map
OSM Map
General Map
Google Map
MSN Map
OSM Map
General Map
Google Map
MSN Map
Please wait while loading the map...
Real estate property taxes paid for housing units in 2022:
This zip code:
0.8% ($917)
Texas:
1.5% ($4,050)
Median real estate property taxes paid for housing units with mortgages in 2022: $1,505 (0.9%) Median real estate property taxes paid for housing units with no mortgage in 2022: $574 (0.6%)
Business Search- 14 Million verified businesses
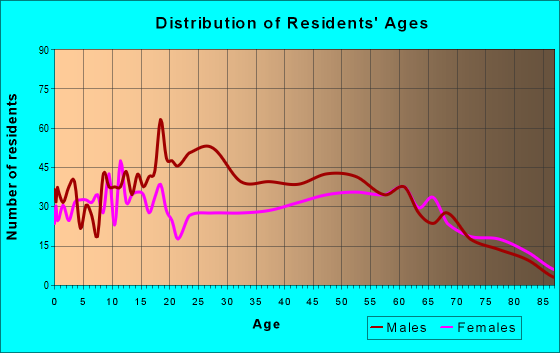
Males: 2,367
(48.2%)
Females: 2,549
(51.8%)
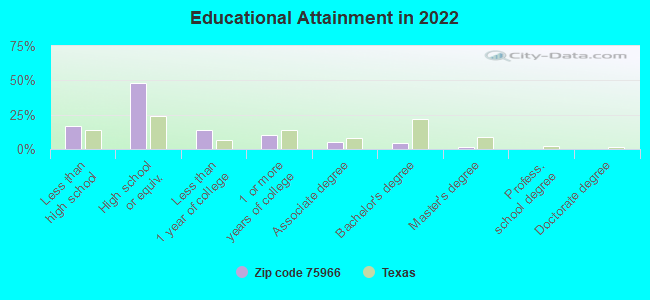
For population 25 years and over in 75966:
High school or higher: 81.9%
Bachelor's degree or higher: 6.4%
Graduate or professional degree: 1.8%
Unemployed: 13.9%
Mean travel time to work (commute): 42.0 minutes
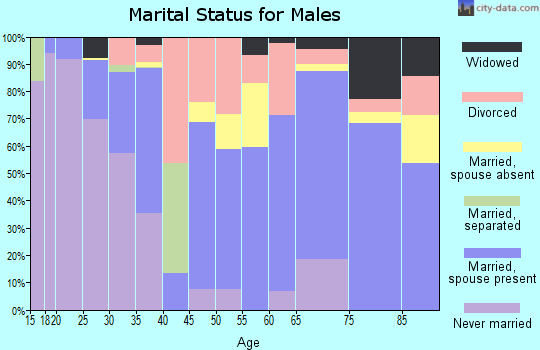
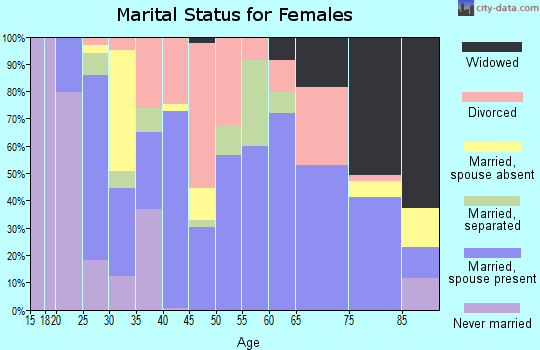
For population 15 years and over in 75966:
Never married: 25.1%
Now married: 48.7%
Separated: 4.0%
Widowed: 11.5%
Divorced: 10.6%
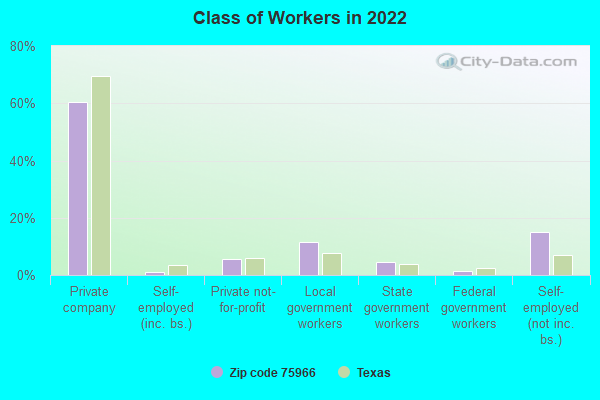
Zip code 75966 compared to state average:
Median household income below state average.
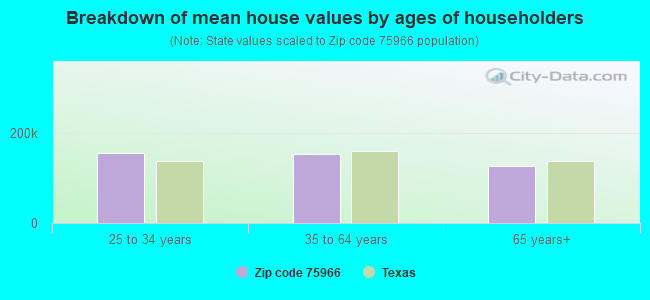
Median house value significantly below state average.
Unemployed percentage significantly above state average.
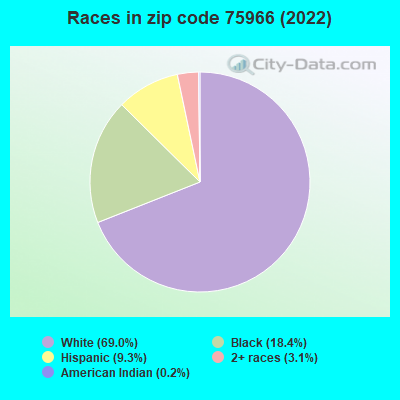
Hispanic race population percentage significantly below state average.
Median age above state average.
Foreign-born population percentage significantly below state average.
Length of stay since moving in significantly above state average.
Number of college students significantly below state average.
Percentage of population with a bachelor's degree or higher significantly below state average.
Averages for the 2020 tax year for zip code 75966, filed in 2021:
Average Adjusted Gross Income (AGI) in 2020: $47,392 (Individual Income Tax Returns)
Here:
$47,392
State:
$77,054
Salary/wage: $44,253 (reported on 82.0% of returns)
Here:
$44,253
State:
$62,766
(% of AGI for various income ranges: 1141.7% for AGIs below $25k, 3642.6% for AGIs $25k-50k, 6329.3% for AGIs $50k-75k, 9738.0% for AGIs $75k-100k, 15021.4% for AGIs $100k-200k)
Taxable interest for individuals: $842 (reported on 20.2% of returns)
This zip code:
$842
Texas:
$2,665
(% of AGI for various income ranges: 9.5% for AGIs below $25k, 20.3% for AGIs $25k-50k, 70.0% for AGIs $50k-75k, 26.0% for AGIs $75k-100k, 32.1% for AGIs $100k-200k)
Ordinary dividends: $2,581 (reported on 9.0% of returns)
Here:
$2,581
State:
$10,044
(% of AGI for various income ranges: 13.3% for AGIs below $25k, 10.3% for AGIs $25k-50k, 78.6% for AGIs $50k-75k, 131.4% for AGIs $100k-200k)
Net capital gain/loss in AGI: +$10,992 (reported on 7.3% of returns)
Here:
+$10,992
State:
+$39,590
(% of AGI for various income ranges: 7.0% for AGIs below $25k, 10.8% for AGIs $25k-50k, 107.1% for AGIs $50k-75k, 854.3% for AGIs $100k-200k)
Profit/loss from business: +$4,543 (reported on 16.9% of returns)
Here:
+$4,543
State:
+$10,888
(% of AGI for various income ranges: 79.2% for AGIs below $25k, 53.2% for AGIs $25k-50k, 112.1% for AGIs $50k-75k, 59.0% for AGIs $75k-100k, 335.7% for AGIs $100k-200k)
Taxable individual retirement arrangement distribution: $15,220 (reported on 5.6% of returns)
75966:
$15,220
Texas:
$24,740
(% of AGI for various income ranges: 31.5% for AGIs below $25k, 124.5% for AGIs $25k-50k, 860.0% for AGIs $75k-100k)
Total itemized deductions: $38,950 (reported on 3.4% of returns)
Here:
$38,950
State:
$40,428
(% of AGI for various income ranges: 796.4% for AGIs $50k-75k, 872.9% for AGIs $100k-200k)
Charity contributions: $15,200 (reported on 1.1% of returns)
Here:
$15,200
State:
$18,201
(% of AGI for various income ranges: 80.0% for AGIs $25k-50k)
Taxes paid: $4,867 (reported on 1.7% of returns)
75966:
$4,867
State:
$7,821
(% of AGI for various income ranges: 104.3% for AGIs $100k-200k)
Earned income credit: $2,725 (reported on 28.7% of returns)
Here:
$2,725
State:
$2,584
(% of AGI for various income ranges: 164.3% for AGIs below $25k, 106.3% for AGIs $25k-50k)
Percentage of individuals using paid preparers for their 2020 taxes: 93.8%
Here:
94%
State:
92%
(% for various income ranges: 94.6% for AGIs below $25k, 93.8% for AGIs $25k-50k, 94.7% for AGIs $50k-75k, 100.0% for AGIs $75k-100k, 90.0% for AGIs $100k-200k, 66.7% for AGIs over 200k)
Averages for the 2012 tax year for zip code 75966, filed in 2013:
Average Adjusted Gross Income (AGI) in 2012: $41,120 (Individual Income Tax Returns)
Here:
$41,120
State:
$65,384
Salary/wage: $38,026 (reported on 83.4% of returns)
Here:
$38,026
State:
$52,524
(% of AGI for various income ranges: 75.7% for AGIs below $25k, 81.5% for AGIs $25k-50k, 80.3% for AGIs $50k-75k, 82.7% for AGIs $75k-100k, 69.8% for AGIs $100k-200k)
Taxable interest for individuals: $1,087 (reported on 23.1% of returns)
This zip code:
$1,087
Texas:
$2,372
(% of AGI for various income ranges: 0.7% for AGIs below $25k, 0.5% for AGIs $25k-50k, 0.9% for AGIs $50k-75k, 0.6% for AGIs $75k-100k, 0.4% for AGIs $100k-200k)
Ordinary dividends: $4,653 (reported on 8.9% of returns)
Here:
$4,653
State:
$9,721
(% of AGI for various income ranges: 1.7% for AGIs below $25k, 1.7% for AGIs $25k-50k, 1.0% for AGIs $50k-75k, 0.7% for AGIs $100k-200k)
Net capital gain/loss in AGI: +$1,967 (reported on 7.1% of returns)
Here:
+$1,967
State:
+$35,319
(% of AGI for various income ranges: 0.1% for AGIs below $25k, 0.5% for AGIs $25k-50k, 0.8% for AGIs $100k-200k)
Profit/loss from business: +$8,613 (reported on 18.3% of returns)
Here:
+$8,613
State:
+$13,732
(% of AGI for various income ranges: 10.7% for AGIs below $25k, 0.7% for AGIs $25k-50k, 1.4% for AGIs $50k-75k, 2.3% for AGIs $75k-100k, 5.0% for AGIs $100k-200k)
Taxable individual retirement arrangement distribution: $14,127 (reported on 6.5% of returns)
75966:
$14,127
Texas:
$19,511
(% of AGI for various income ranges: 2.4% for AGIs below $25k, 5.4% for AGIs $25k-50k, 5.5% for AGIs $75k-100k)
Total itemized deductions: $23,188 (28% of AGI, reported on 14.8% of returns)
Here:
$23,188
State:
$24,724
Here:
27.8% of AGI
State:
15.9% of AGI
(% of AGI for various income ranges: 6.8% for AGIs below $25k, 5.7% for AGIs $25k-50k, 9.6% for AGIs $50k-75k, 10.3% for AGIs $75k-100k, 9.0% for AGIs $100k-200k)
Charity contributions: $6,300 (reported on 10.7% of returns)
Here:
$6,300
State:
$6,808
(% of AGI for various income ranges: 0.9% for AGIs below $25k, 1.0% for AGIs $25k-50k, 1.5% for AGIs $50k-75k, 2.2% for AGIs $75k-100k, 2.2% for AGIs $100k-200k)
Taxes paid: $2,862 (reported on 15.4% of returns)
75966:
$2,862
State:
$6,921
(% of AGI for various income ranges: 0.8% for AGIs below $25k, 0.8% for AGIs $25k-50k, 1.0% for AGIs $50k-75k, 1.1% for AGIs $75k-100k, 1.4% for AGIs $100k-200k)
Earned income credit: $2,636 (reported on 32.5% of returns)
Here:
$2,636
State:
$2,570
(% of AGI for various income ranges: 12.0% for AGIs below $25k, 1.4% for AGIs $25k-50k)
Percentage of individuals using paid preparers for their 2012 taxes: 66.9%
Here:
67%
State:
51%
(% for various income ranges: 65.4% for AGIs below $25k, 63.2% for AGIs $25k-50k, 66.7% for AGIs $50k-75k, 75.0% for AGIs $75k-100k, 78.6% for AGIs $100k-200k)
Averages for the 2004 tax year for zip code 75966, filed in 2005:
Average Adjusted Gross Income (AGI) in 2004: $27,470 (Individual Income Tax Returns)
Here:
$27,470
State:
$47,881
Salary/wage: $25,509 (reported on 85.7% of returns)
Here:
$25,509
State:
$41,947
(% of AGI for various income ranges: 105.1% for AGIs below $10k, 83.2% for AGIs $10k-25k, 82.8% for AGIs $25k-50k, 82.2% for AGIs $50k-75k, 77.8% for AGIs $75k-100k, 47.1% for AGIs over 100k)
Taxable interest for individuals: $1,588 (reported on 28.3% of returns)
This zip code:
$1,588
Texas:
$2,255
(% of AGI for various income ranges: 4.1% for AGIs below $10k, 1.7% for AGIs $10k-25k, 1.3% for AGIs $25k-50k, 1.5% for AGIs $50k-75k, 1.2% for AGIs $75k-100k, 2.3% for AGIs over 100k)
Taxable dividends: $2,395 (reported on 9.4% of returns)
Here:
$2,395
State:
$4,261
(% of AGI for various income ranges: 2.2% for AGIs below $10k, 0.5% for AGIs $10k-25k, 0.5% for AGIs $25k-50k, 0.5% for AGIs $50k-75k, 0.2% for AGIs $75k-100k, 3.1% for AGIs over 100k)
Net capital gain/loss: +$252 (reported on 7.6% of returns)
Here:
+$252
State:
+$16,110
(% of AGI for various income ranges: -1.2% for AGIs below $10k, 0.2% for AGIs $10k-25k, 0.2% for AGIs $25k-50k, -0.1% for AGIs $50k-75k, 0.1% for AGIs $75k-100k)
Profit/loss from business: +$4,486 (reported on 16.6% of returns)
Here:
+$4,486
State:
+$11,013
(% of AGI for various income ranges: 9.8% for AGIs below $10k, 4.8% for AGIs $10k-25k, 1.8% for AGIs $25k-50k, 2.3% for AGIs $50k-75k, 1.7% for AGIs $75k-100k)
IRA payment deduction: $1,273 (reported on 0.6% of returns)
75966:
$1,273
Texas:
$3,120
Total itemized deductions: $17,750 (32% of AGI, reported on 11.6% of returns)
Here:
$17,750
State:
$19,631
Here:
32.5% of AGI
State:
18.9% of AGI
(% of AGI for various income ranges: 4.6% for AGIs $10k-25k, 8.6% for AGIs $25k-50k, 9.0% for AGIs $50k-75k, 8.6% for AGIs $75k-100k, 8.6% for AGIs over 100k)
Charity contributions deductions: $5,282 (9% of AGI, reported on 8.7% of returns)
Here:
$5,282
State:
$4,753
Here:
9.2% of AGI
State:
4.2% of AGI
(% of AGI for various income ranges: 0.7% for AGIs $10k-25k, 1.3% for AGIs $25k-50k, 1.6% for AGIs $50k-75k, 2.9% for AGIs $75k-100k, 4.4% for AGIs over 100k)
Total tax: $3,204 (reported on 61.0% of returns)
75966:
$3,204
State:
$9,058
(% of AGI for various income ranges: 2.9% for AGIs below $10k, 3.0% for AGIs $10k-25k, 5.5% for AGIs $25k-50k, 8.2% for AGIs $50k-75k, 11.0% for AGIs $75k-100k, 16.8% for AGIs over 100k)
Earned income credit: $2,026 (reported on 35.2% of returns)
Here:
$2,026
State:
$2,024
Percentage of individuals using paid preparers for their 2004 taxes: 67.6%
Here:
68%
State:
57%
(% for various income ranges: 62.3% for AGIs below $10k, 71.5% for AGIs $10k-25k, 68.4% for AGIs $25k-50k, 66.0% for AGIs $50k-75k, 54.9% for AGIs $75k-100k, 76.5% for AGIs over 100k)
Household received Food Stamps/SNAP in the past 12 months: 304 Household did not receive Food Stamps/SNAP in the past 12 months: 1,440
Women who had a birth in the past 12 months: 125 (44 now married, 78 unmarried) Women who did not have a birth in the past 12 months: 840 (434 now married, 404 unmarried)
Housing units in zip code 75966 with a mortgage: 383 (20 second mortgage, 16 both second mortgage and home equity loan) Median monthly owner costs for units with a mortgage: $1,553 Median monthly owner costs for units without a mortgage: $406
Residents with income below the poverty level in 2022:
This zip code:
26.2%
Whole state:
14.0%
Residents with income below 50% of the poverty level in 2022:
This zip code:
8.6%
Whole state:
7.4%
Median number of rooms in houses and condos:
Here:
5.4
State:
6.3
Median number of rooms in apartments:
Here:
4.1
State:
4.0
Notable locations in this zip code not listed on our city pages
Notable locations in zip code 75966: East Texas Baptist Encampment (A), Newton County History Center (B), Newton City Fire Department (C), Newton Volunteer Fire Department (D). Display/hide their locations on the map
Churches in zip code 75966 include: Union Church (A), Pinehill Church (B), Quicksand Church (C), Cedar Grove Church (D), Ford Church (E), Lewis Chapel (F), West Bethlehem Church (G). Display/hide their locations on the map
Cemeteries: Saint Johns Cemetery (1), Big Spring Cemetery (2), Odom Cemetery (3), Simmons Cemetery (4), Herrin Cemetery (5), Griggs Cemetery (6), Wilkinson Cemetery (7). Display/hide their locations on the map
Lakes, reservoirs, and swamps: Chain Lakes (A), Alligator Lake (B), Armstrong Lake (C), Fowler Old River (D), Kimmey Lake (E), Temple Eastex Lake (F), Walker Lake (G), Club Lake (H). Display/hide their locations on the map
Streams, rivers, and creeks: Blue Branch (A), Bay Branch (B), Underwood Creek (C), Clare Creek (D), West Branch White Oak Creek (E), Thickety Creek (F), Threemile Branch (G), Caney Branch (H), Pole Slough (I). Display/hide their locations on the map
In group quarters: 163 (-1 institutionalized population)
Size of family households: 614 2-persons, 231 3-persons, 164 4-persons, 188 5-persons, 15 6-persons, 64 7-or-more-persons
Size of nonfamily households: 444 1-person, 10 2-persons, 6 3-persons
276 married couples with children.
798 single-parent households (312 men, 486 women).
97.6% of residents of 75966 zip code speak English at home.
0.1% of residents speak Spanish at home (33% very well, 67% well).
2.5% of residents speak other Indo-European language at home (100% very well).
0.1% of residents speak Asian or Pacific Island language at home (67% very well, 33% well).
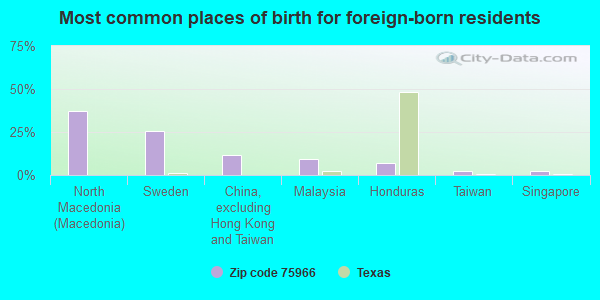
Foreign born population: 46 (0.9%) (97.9% of them are naturalized citizens)
This zip code:
0.9%
Whole state:
17.2%
37%North Macedonia (Macedonia)
26%Sweden
12%China, excluding Hong Kong and Taiwan
9%Malaysia
7%Honduras
2%Taiwan
2%Singapore
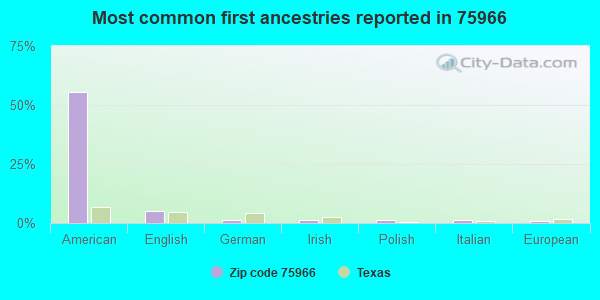
55%American
5%English
1%German
1%Irish
1%Polish
1%Italian
1%European
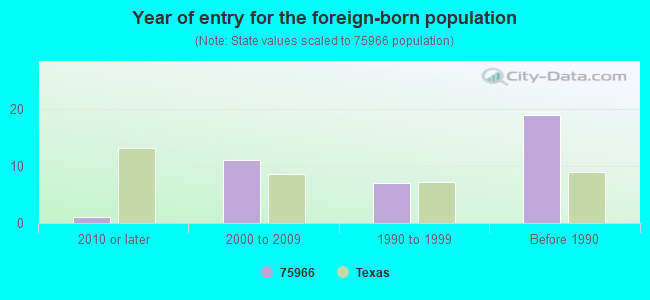
Year of entry for the foreign-born population
12010 or later
112000 to 2009
71990 to 1999
19Before 1990
Housing units lacking complete plumbing facilities: 9.7% Housing units lacking complete kitchen facilities: 8.0%
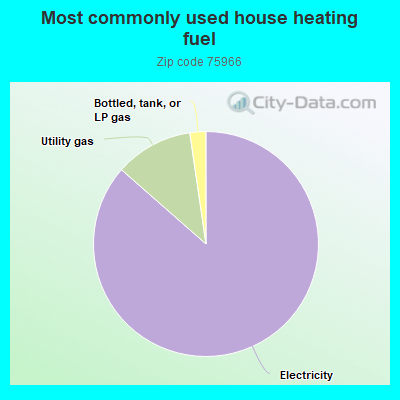
86.4%Electricity
11.2%Utility gas
2.3%Bottled, tank, or LP gas
Population in 1990: 4,184. Population change in the 1990s: +1,813 (+43.3%).
Place of birth for U.S.-born residents:
This state: 3,719
Northeast: 113
Midwest: 126
South: 678
West: 206
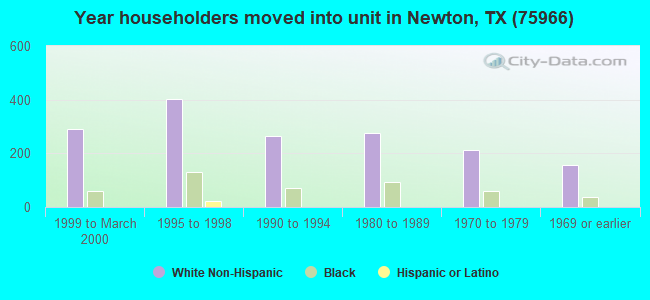
65% of the 75966 zip code residents lived in the same house 5 years ago. Out of people who lived in different houses, 47% lived in this county. Out of people who lived in different counties, 50% lived in Texas.
86% of the 75966 zip code residents lived in the same house 1 year ago. Out of people who lived in different houses, 42% moved from this county. Out of people who lived in different houses, 40% moved from different county within same state. Out of people who lived in different houses, 18% moved from different state. Out of people who lived in different houses, 1% moved from abroad.
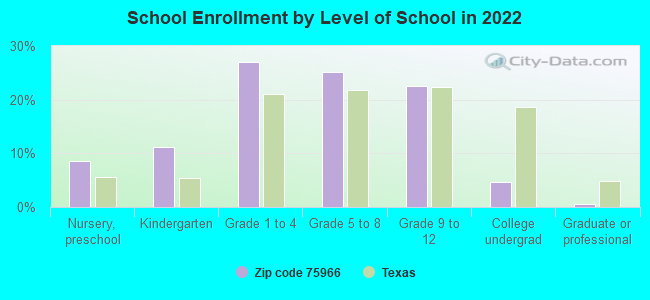
Private vs. public school enrollment:
Students in private schools in grades 1 to 8 (elementary and middle school): 73
Here:
12.3%
Texas:
8.8%
Students in private schools in grades 9 to 12 (high school): 33
Here:
13.0%
Texas:
8.0%
Students in private undergraduate colleges: 15
Here:
28.5%
Texas:
16.2%
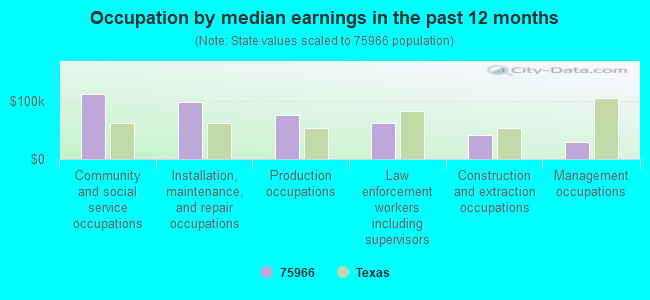
Occupation by median earnings in the past 12 months ($)
113,306Community and social service occupations
99,124Installation, maintenance, and repair occupations
76,419Production occupations
61,905Law enforcement workers including supervisors
41,036Construction and extraction occupations
29,684Management occupations
Companies with federal contracts located in this zip code:
JAMES WILLIAMS (505 SOUTH LOOP in NEWTON, TX; small business) 8 employees, $4000000 revenue.
$150,000 with National Park Service for Lumber and Related Basic Wood Materials. Signed on 2001-01-15. Completion date: 2001-02-15.
Top industries in this zip code by the number of employees in 2005:
Administrative and Support and Waste Management and Remediation Services: Facilities Support Services (100-249 employees: 1 establishment)
Health Care and Social Assistance: Home Health Care Services (100-249: 1)
Health Care and Social Assistance: Nursing Care Facilities (50-99: 1)
Health Care and Social Assistance: Offices of Physicians (except Mental Health Specialists) (20-49: 1, 10-19: 1, 5-9: 1)
Other Services (except Public Administration): Religious Organizations (5-9: 4, 1-4: 5)
Finance and Insurance: Commercial Banking (20-49: 1)
666 people in local jails and other municipal confinement facilities
58 people in nursing facilities/skilled-nursing facilities
People in group quarters in 2000:
531 people in local jails and other confinement facilities (including police lockups)
69 people in nursing homes
Fatal accident statistics in 2014:
Fatal accident count: 1
Vehicles involved in fatal accidents: 2
Fatal accidents caused by drunken drivers: 0
Fatalities: 1
Persons involved in fatal accidents: 2
Pedestrians involved in fatal accidents: 0
Fatal accident statistics in 2012:
Fatal accident count: 2
Vehicles involved in fatal accidents: 4
Fatal accidents caused by drunken drivers: 0
Fatalities: 2
Persons involved in fatal accidents: 5
Pedestrians involved in fatal accidents: 0
2002 - 2016 National Fire Incident Reporting System (NFIRS) incidents
According to the data from the years 2002 - 2016 the average number of fires per year is 21. The highest number of fires - 87 took place in 2008, and the least - 0 in 2012. The data has a growing trend.
When looking into fire subcategories, the most incidents belonged to: Outside Fires (53.8%), and Structure Fires (29.7%).
Fire incident types reported to NFIRS in Zip Code 75966
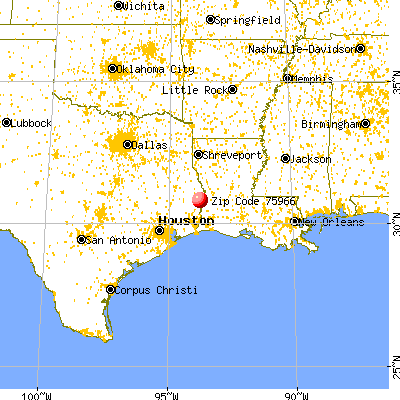


 Nearest zip codes: 75928, 70653, 75977, 75932, 70639, 75933.


 According to the data from the years 2002 - 2016 the average number of fires per year is 21. The highest number of fires - 87 took place in 2008, and the least - 0 in 2012. The data has a growing trend.
 When looking into fire subcategories, the most incidents belonged to: Outside Fires (53.8%), and Structure Fires (29.7%).