Estimated zip code population in 2022: 5,364 Zip code population in 2010: 4,881 Zip code population in 2000: 4,614
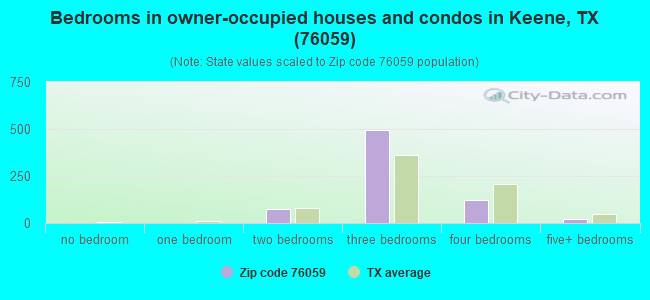
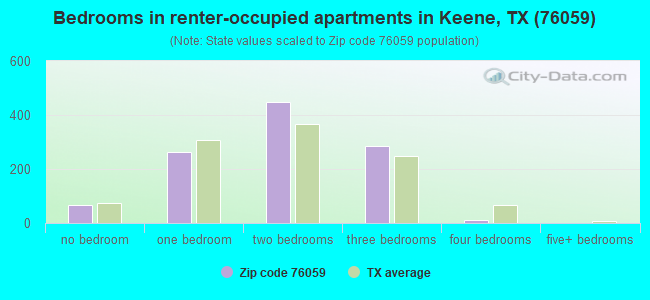
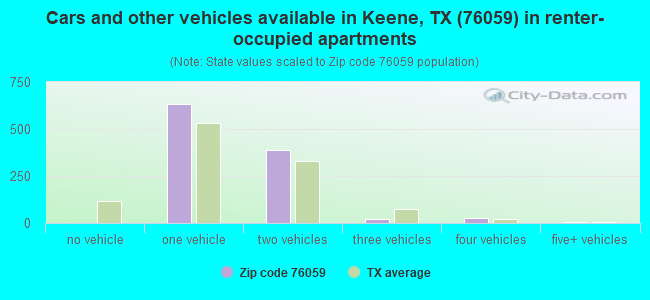
Houses and condos: 2,014 Renter-occupied apartments: 1,078
% of renters here:
60%
State:
38%
March 2022 cost of living index in zip code 76059: 94.9 (less than average, U.S. average is 100)
Land area: 2.7 sq. mi. Water area: 0.0 sq. mi.
Population density: 1,955 people per square mile
(low).
OSM Map
General Map
Google Map
MSN Map
OSM Map
General Map
Google Map
MSN Map
OSM Map
General Map
Google Map
MSN Map
OSM Map
General Map
Google Map
MSN Map
Please wait while loading the map...
Real estate property taxes paid for housing units in 2022:
This zip code:
1.2% ($2,583)
Texas:
1.5% ($4,050)
Median real estate property taxes paid for housing units with mortgages in 2022: $2,607 (1.1%) Median real estate property taxes paid for housing units with no mortgage in 2022: $2,563 (1.4%)
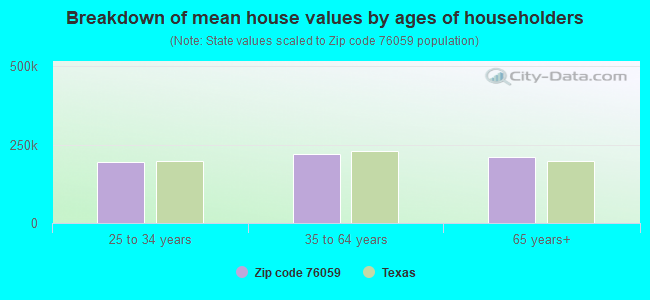
Estimated median house/condo value in 2022: $213,493
76059:
$213,493
Texas:
$275,400
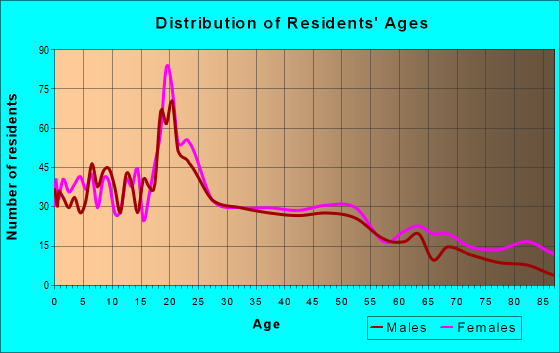
Median resident age:
This zip code:
30.5 years
Texas median age:
35.6 years
Average household size:
This zip code:
2.7 people
Texas:
2.6 people
Averages for the 2020 tax year for zip code 76059, filed in 2021:
Average Adjusted Gross Income (AGI) in 2020: $45,952 (Individual Income Tax Returns)
Here:
$45,952
State:
$77,054
Salary/wage: $41,423 (reported on 85.4% of returns)
Here:
$41,423
State:
$62,766
(% of AGI for various income ranges: 1172.7% for AGIs below $25k, 3620.9% for AGIs $25k-50k, 6562.3% for AGIs $50k-75k, 9716.7% for AGIs $75k-100k, 14873.6% for AGIs $100k-200k)
Taxable interest for individuals: $812 (reported on 15.6% of returns)
This zip code:
$812
Texas:
$2,665
(% of AGI for various income ranges: 7.9% for AGIs below $25k, 18.3% for AGIs $25k-50k, 23.2% for AGIs $50k-75k, 13.3% for AGIs $75k-100k, 47.3% for AGIs $100k-200k)
Ordinary dividends: $1,857 (reported on 6.6% of returns)
Here:
$1,857
State:
$10,044
(% of AGI for various income ranges: 7.7% for AGIs below $25k, 8.9% for AGIs $25k-50k, 45.9% for AGIs $50k-75k, 55.5% for AGIs $100k-200k)
Net capital gain/loss in AGI: +$3,787 (reported on 7.1% of returns)
Here:
+$3,787
State:
+$39,590
(% of AGI for various income ranges: 3.9% for AGIs below $25k, 3.2% for AGIs $25k-50k, 45.5% for AGIs $50k-75k, 386.4% for AGIs $100k-200k)
Profit/loss from business: +$11,915 (reported on 18.4% of returns)
Here:
+$11,915
State:
+$10,888
(% of AGI for various income ranges: 131.2% for AGIs below $25k, 136.8% for AGIs $25k-50k, 305.9% for AGIs $50k-75k, 745.0% for AGIs $75k-100k, 1353.6% for AGIs $100k-200k)
Taxable individual retirement arrangement distribution: $10,550 (reported on 5.7% of returns)
76059:
$10,550
Texas:
$24,740
(% of AGI for various income ranges: 19.4% for AGIs below $25k, 64.3% for AGIs $25k-50k, 115.0% for AGIs $50k-75k, 453.3% for AGIs $75k-100k)
Total itemized deductions: $40,591 (reported on 5.2% of returns)
Here:
$40,591
State:
$40,428
(% of AGI for various income ranges: 216.8% for AGIs $25k-50k, 585.8% for AGIs $75k-100k, 2375.5% for AGIs $100k-200k)
Charity contributions: $21,670 (reported on 4.7% of returns)
Here:
$21,670
State:
$18,201
(% of AGI for various income ranges: 66.4% for AGIs $25k-50k, 236.7% for AGIs $75k-100k, 1391.8% for AGIs $100k-200k)
Taxes paid: $5,482 (reported on 5.2% of returns)
76059:
$5,482
State:
$7,821
(% of AGI for various income ranges: 29.6% for AGIs $25k-50k, 106.7% for AGIs $75k-100k, 289.1% for AGIs $100k-200k)
Earned income credit: $2,463 (reported on 26.9% of returns)
Here:
$2,463
State:
$2,584
(% of AGI for various income ranges: 126.7% for AGIs below $25k, 105.1% for AGIs $25k-50k, 5.0% for AGIs $50k-75k)
Percentage of individuals using paid preparers for their 2020 taxes: 92.0%
Here:
92%
State:
92%
(% for various income ranges: 91.6% for AGIs below $25k, 93.8% for AGIs $25k-50k, 93.1% for AGIs $50k-75k, 94.1% for AGIs $75k-100k, 87.5% for AGIs $100k-200k, 66.7% for AGIs over 200k)
Averages for the 2012 tax year for zip code 76059, filed in 2013:
Average Adjusted Gross Income (AGI) in 2012: $37,920 (Individual Income Tax Returns)
Here:
$37,920
State:
$65,384
Salary/wage: $34,030 (reported on 84.5% of returns)
Here:
$34,030
State:
$52,524
(% of AGI for various income ranges: 75.5% for AGIs below $25k, 83.3% for AGIs $25k-50k, 81.5% for AGIs $50k-75k, 82.1% for AGIs $75k-100k, 92.4% for AGIs $100k-200k)
Taxable interest for individuals: $1,172 (reported on 16.6% of returns)
This zip code:
$1,172
Texas:
$2,372
(% of AGI for various income ranges: 0.7% for AGIs below $25k, 0.6% for AGIs $25k-50k, 0.3% for AGIs $50k-75k, 0.3% for AGIs $75k-100k, 0.9% for AGIs $100k-200k)
Ordinary dividends: $2,291 (reported on 5.7% of returns)
Here:
$2,291
State:
$9,721
(% of AGI for various income ranges: 0.2% for AGIs below $25k, 0.8% for AGIs $25k-50k, 0.4% for AGIs $50k-75k, 0.3% for AGIs $100k-200k)
Net capital gain/loss in AGI: +$5,123 (reported on 6.7% of returns)
Here:
+$5,123
State:
+$35,319
(% of AGI for various income ranges: 0.2% for AGIs $25k-50k, 0.4% for AGIs $50k-75k, 4.1% for AGIs $100k-200k)
Profit/loss from business: +$7,718 (reported on 19.7% of returns)
Here:
+$7,718
State:
+$13,732
(% of AGI for various income ranges: 11.6% for AGIs below $25k, 3.0% for AGIs $25k-50k, 3.3% for AGIs $50k-75k, 3.9% for AGIs $75k-100k, 1.8% for AGIs $100k-200k)
Taxable individual retirement arrangement distribution: $11,108 (reported on 6.2% of returns)
76059:
$11,108
Texas:
$19,511
(% of AGI for various income ranges: 1.3% for AGIs below $25k, 1.1% for AGIs $25k-50k, 2.3% for AGIs $50k-75k, 4.7% for AGIs $100k-200k)
Total itemized deductions: $21,728 (27% of AGI, reported on 20.2% of returns)
Here:
$21,728
State:
$24,724
Here:
26.7% of AGI
State:
15.9% of AGI
(% of AGI for various income ranges: 6.5% for AGIs below $25k, 8.6% for AGIs $25k-50k, 11.3% for AGIs $50k-75k, 12.6% for AGIs $75k-100k, 24.2% for AGIs $100k-200k)
Charity contributions: $10,218 (reported on 17.1% of returns)
Here:
$10,218
State:
$6,808
(% of AGI for various income ranges: 1.6% for AGIs below $25k, 2.8% for AGIs $25k-50k, 4.3% for AGIs $50k-75k, 5.3% for AGIs $75k-100k, 11.1% for AGIs $100k-200k)
Taxes paid: $4,050 (reported on 19.7% of returns)
76059:
$4,050
State:
$6,921
(% of AGI for various income ranges: 1.1% for AGIs below $25k, 1.6% for AGIs $25k-50k, 2.2% for AGIs $50k-75k, 2.6% for AGIs $75k-100k, 4.0% for AGIs $100k-200k)
Earned income credit: $2,565 (reported on 29.5% of returns)
Here:
$2,565
State:
$2,570
(% of AGI for various income ranges: 9.4% for AGIs below $25k, 2.3% for AGIs $25k-50k)
Percentage of individuals using paid preparers for their 2012 taxes: 50.3%
Here:
50%
State:
51%
(% for various income ranges: 44.3% for AGIs below $25k, 53.1% for AGIs $25k-50k, 56.5% for AGIs $50k-75k, 63.6% for AGIs $75k-100k, 72.7% for AGIs $100k-200k)
Averages for the 2004 tax year for zip code 76059, filed in 2005:
Average Adjusted Gross Income (AGI) in 2004: $30,920 (Individual Income Tax Returns)
Here:
$30,920
State:
$47,881
Salary/wage: $29,705 (reported on 84.5% of returns)
Here:
$29,705
State:
$41,947
(% of AGI for various income ranges: 167.9% for AGIs below $10k, 78.9% for AGIs $10k-25k, 84.3% for AGIs $25k-50k, 81.2% for AGIs $50k-75k, 87.4% for AGIs $75k-100k, 62.4% for AGIs over 100k)
Taxable interest for individuals: $1,713 (reported on 26.3% of returns)
This zip code:
$1,713
Texas:
$2,255
(% of AGI for various income ranges: 5.4% for AGIs below $10k, 2.1% for AGIs $10k-25k, 1.2% for AGIs $25k-50k, 1.4% for AGIs $50k-75k, 1.5% for AGIs $75k-100k, 0.7% for AGIs over 100k)
Taxable dividends: $1,052 (reported on 8.7% of returns)
Here:
$1,052
State:
$4,261
(% of AGI for various income ranges: 1.0% for AGIs below $10k, 0.3% for AGIs $10k-25k, 0.3% for AGIs $25k-50k, 0.4% for AGIs $50k-75k, 0.1% for AGIs $75k-100k, 0.3% for AGIs over 100k)
Net capital gain/loss: +$2,800 (reported on 8.2% of returns)
Here:
+$2,800
State:
+$16,110
(% of AGI for various income ranges: 0.6% for AGIs below $10k, 0.2% for AGIs $10k-25k, 0.2% for AGIs $25k-50k, 0.2% for AGIs $50k-75k, 1.2% for AGIs $75k-100k, 2.3% for AGIs over 100k)
Profit/loss from business: +$8,484 (reported on 17.9% of returns)
Here:
+$8,484
State:
+$11,013
(% of AGI for various income ranges: -19.3% for AGIs below $10k, 7.5% for AGIs $10k-25k, 3.5% for AGIs $25k-50k, 3.7% for AGIs $50k-75k, 1.2% for AGIs $75k-100k, 12.3% for AGIs over 100k)
IRA payment deduction: $2,739 (reported on 1.3% of returns)
76059:
$2,739
Texas:
$3,120
Total itemized deductions: $17,545 (28% of AGI, reported on 21.7% of returns)
Here:
$17,545
State:
$19,631
Here:
28.2% of AGI
State:
18.9% of AGI
(% of AGI for various income ranges: 10.1% for AGIs below $10k, 8.6% for AGIs $10k-25k, 10.3% for AGIs $25k-50k, 14.2% for AGIs $50k-75k, 13.4% for AGIs $75k-100k, 16.1% for AGIs over 100k)
Charity contributions deductions: $8,406 (13% of AGI, reported on 20.2% of returns)
Here:
$8,406
State:
$4,753
Here:
13.2% of AGI
State:
4.2% of AGI
(% of AGI for various income ranges: 2.8% for AGIs below $10k, 2.6% for AGIs $10k-25k, 4.1% for AGIs $25k-50k, 5.8% for AGIs $50k-75k, 6.2% for AGIs $75k-100k, 9.9% for AGIs over 100k)
Total tax: $4,189 (reported on 63.9% of returns)
76059:
$4,189
State:
$9,058
(% of AGI for various income ranges: 4.6% for AGIs below $10k, 3.6% for AGIs $10k-25k, 5.9% for AGIs $25k-50k, 8.5% for AGIs $50k-75k, 10.3% for AGIs $75k-100k, 17.1% for AGIs over 100k)
Earned income credit: $2,094 (reported on 26.6% of returns)
Here:
$2,094
State:
$2,024
Percentage of individuals using paid preparers for their 2004 taxes: 53.7%
Here:
54%
State:
57%
(% for various income ranges: 42.6% for AGIs below $10k, 61.1% for AGIs $10k-25k, 55.5% for AGIs $25k-50k, 52.5% for AGIs $50k-75k, 48.9% for AGIs $75k-100k, 65.6% for AGIs over 100k)
Household received Food Stamps/SNAP in the past 12 months: 221 Household did not receive Food Stamps/SNAP in the past 12 months: 1,572
Women who had a birth in the past 12 months: 98 (85 now married, 13 unmarried) Women who did not have a birth in the past 12 months: 1,520 (588 now married, 933 unmarried)
Housing units in zip code 76059 with a mortgage: 472 Median monthly owner costs for units with a mortgage: $1,356 Median monthly owner costs for units without a mortgage: $590
Residents with income below the poverty level in 2022:
This zip code:
15.6%
Whole state:
14.0%
Residents with income below 50% of the poverty level in 2022:
This zip code:
3.6%
Whole state:
7.4%
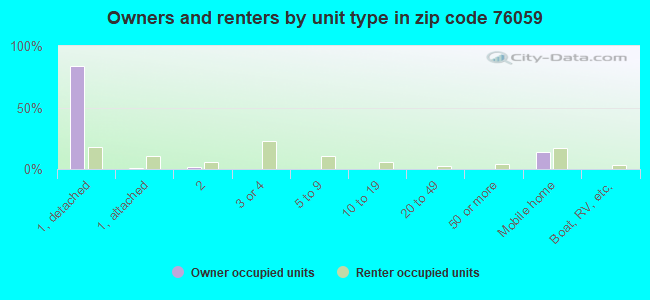
Median number of rooms in houses and condos:
Here:
5.7
State:
6.3
Median number of rooms in apartments:
Here:
3.7
State:
4.0
Notable locations in this zip code not listed on our city pages
985 married couples with children.
110 single-parent households (35 men, 75 women).
70.8% of residents of 76059 zip code speak English at home.
25.7% of residents speak Spanish at home (69% very well, 15% well, 15% not well, 1% not at all).
2.9% of residents speak Asian or Pacific Island language at home (20% very well, 80% well).
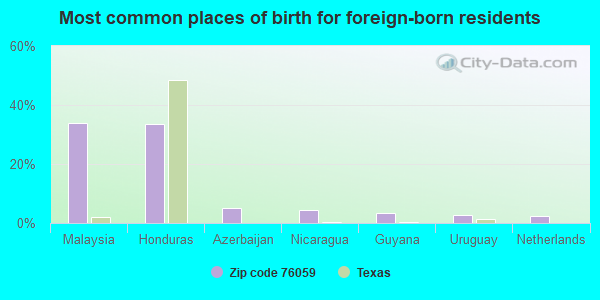
Foreign born population: 539 (10.1%) (64.0% of them are naturalized citizens)
This zip code:
10.1%
Whole state:
17.2%
34%Malaysia
33%Honduras
5%Azerbaijan
4%Nicaragua
3%Guyana
3%Uruguay
2%Netherlands
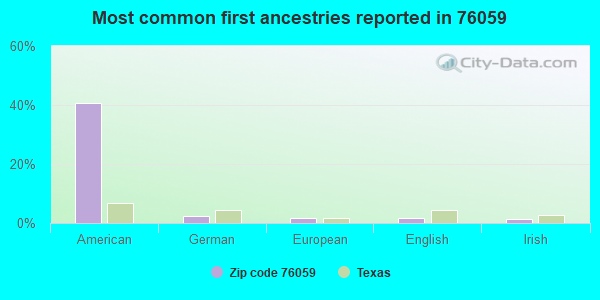
41%American
2%German
2%European
2%English
1%Irish
0%Jamaican
0%Serbian
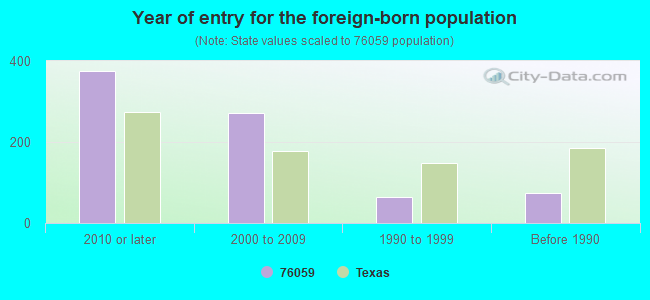
Year of entry for the foreign-born population
3762010 or later
2712000 to 2009
651990 to 1999
75Before 1990
Housing units lacking complete kitchen facilities: 3.1%
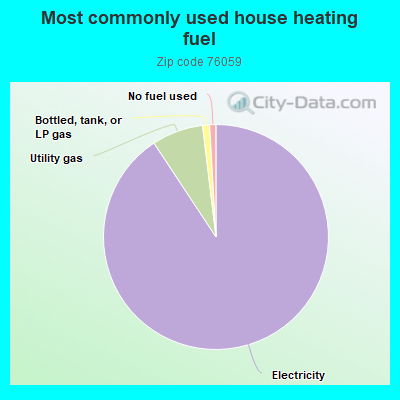
90.8%Electricity
7.4%Utility gas
1.0%Bottled, tank, or LP gas
0.9%No fuel used
Population in 1990: 5,863.
Place of birth for U.S.-born residents:
This state: 3,051
Northeast: 522
Midwest: 302
South: 271
West: 463
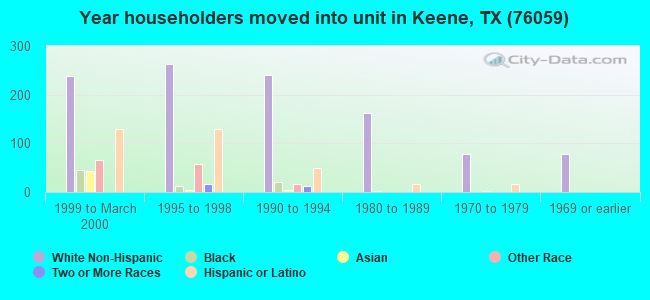
47% of the 76059 zip code residents lived in the same house 5 years ago. Out of people who lived in different houses, 49% lived in this county. Out of people who lived in different counties, 50% lived in Texas.
95% of the 76059 zip code residents lived in the same house 1 year ago. Out of people who lived in different houses, 62% moved from this county. Out of people who lived in different houses, 32% moved from different county within same state. Out of people who lived in different houses, 2% moved from different state. Out of people who lived in different houses, 5% moved from abroad.
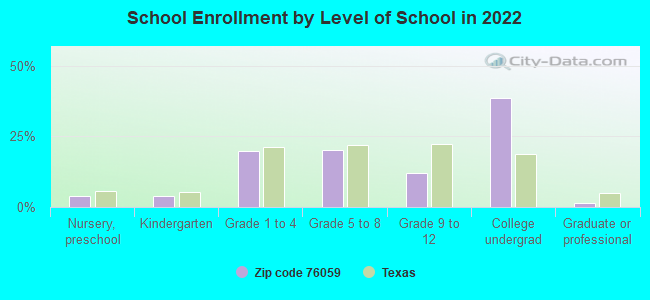
Private vs. public school enrollment:
Students in private schools in grades 1 to 8 (elementary and middle school): 30
Here:
5.1%
Texas:
8.8%
Students in private schools in grades 9 to 12 (high school): 5
Here:
3.0%
Texas:
8.0%
Students in private undergraduate colleges: 324
Here:
55.9%
Texas:
16.2%
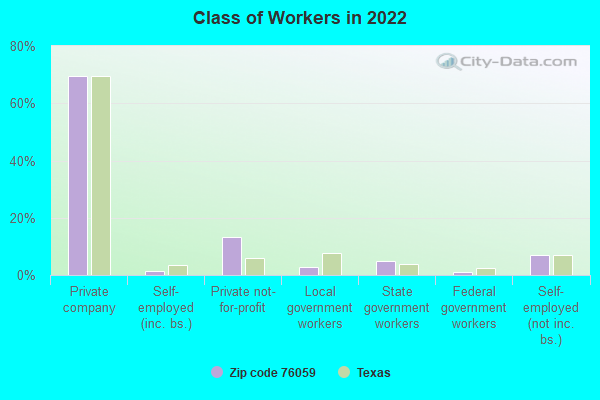
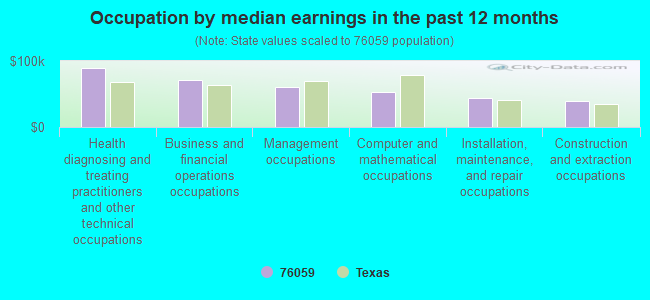
Occupation by median earnings in the past 12 months ($)
88,731Health diagnosing and treating practitioners and other technical occupations
70,841Business and financial operations occupations
60,970Management occupations
53,280Computer and mathematical occupations
43,722Installation, maintenance, and repair occupations
39,454Construction and extraction occupations
Top industries in this zip code by the number of employees in 2005:
Educational Services: Colleges, Universities, and Professional Schools (500-999 employees: 1 establishment)
Health Care and Social Assistance: Nursing Care Facilities (100-249: 1, 20-49: 1)
Finance and Insurance: Commercial Banking (50-99: 1, 20-49: 1)
Educational Services: Elementary and Secondary Schools (50-99: 1)
Real Estate and Rental and Leasing: Video Tape and Disc Rental (20-49: 1)
Administrative and Support and Waste Management and Remediation Services: Janitorial Services (20-49: 1)
Other Services (except Public Administration): Religious Organizations (20-49: 1)
Accommodation and Food Services: Limited-Service Restaurants (10-19: 1, 1-4: 3)
Health Care and Social Assistance: Offices of Physicians (except Mental Health Specialists) (10-19: 1, 1-4: 2)
People in group quarters in 2010:
287 people in college/university student housing
100 people in nursing facilities/skilled-nursing facilities
6 people in group homes intended for adults
People in group quarters in 2000:
288 people in college dormitories (includes college quarters off campus)
118 people in nursing homes
6 people in homes for the mentally retarded
Home Mortgage Disclosure Act Aggregated Statistics For Year 1999 (Based on 1 partial tract)
A) FHA, FSA/RHS & VA Home Purchase Loans
B) Conventional Home Purchase Loans
C) Refinancings
D) Home Improvement Loans
F) Non-occupant Loans on < 5 Family Dwellings (A B C & D)
Number
Average Value
Number
Average Value
Number
Average Value
Number
Average Value
Number
Average Value
LOANS ORIGINATED
2
$84,915
9
$59,853
5
$77,244
2
$27,265
2
$65,725
APPLICATIONS APPROVED, NOT ACCEPTED
0
$0
3
$40,757
2
$47,005
1
$17,090
0
$0
APPLICATIONS DENIED
0
$0
12
$41,637
2
$64,810
1
$17,140
1
$46,450
APPLICATIONS WITHDRAWN
0
$0
1
$114,640
2
$74,270
0
$0
0
$0
FILES CLOSED FOR INCOMPLETENESS
0
$0
0
$0
1
$75,210
0
$0
0
$0
Private Mortgage Insurance Companies Aggregated Statistics For Year 1999 (Based on 1 partial tract)
A) Conventional Home Purchase Loans
B) Refinancings
Number
Average Value
Number
Average Value
LOANS ORIGINATED
1
$119,390
1
$48,280
APPLICATIONS APPROVED, NOT ACCEPTED
0
$0
0
$0
APPLICATIONS DENIED
0
$0
0
$0
APPLICATIONS WITHDRAWN
0
$0
0
$0
FILES CLOSED FOR INCOMPLETENESS
0
$0
0
$0
2002 - 2018 National Fire Incident Reporting System (NFIRS) incidents
According to the data from the years 2002 - 2018 the average number of fire incidents per year is 63. The highest number of reported fires - 100 took place in 2011, and the least - 36 in 2002. The data has a rising trend.
When looking into fire subcategories, the most reports belonged to: Outside Fires (44.4%), and Structure Fires (42.1%).
Fire incident types reported to NFIRS in Zip Code 76059


 Nearest zip codes: 76031, 76058, 76009, 76028, 76061, 76093.


 According to the data from the years 2002 - 2018 the average number of fire incidents per year is 63. The highest number of reported fires - 100 took place in 2011, and the least - 36 in 2002. The data has a rising trend.
 When looking into fire subcategories, the most reports belonged to: Outside Fires (44.4%), and Structure Fires (42.1%).