Estimated zip code population in 2022: 10,003 Zip code population in 2010: 9,711 Zip code population in 2000: 9,449
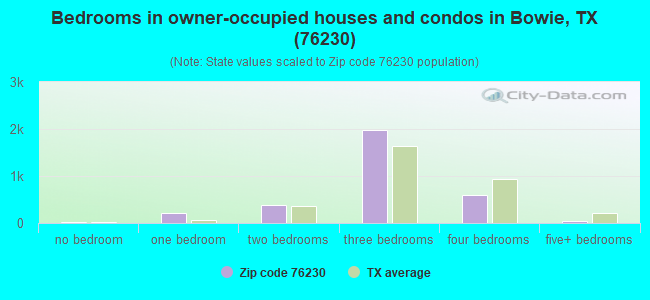
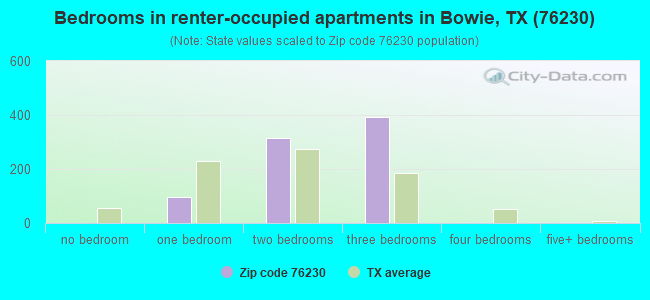
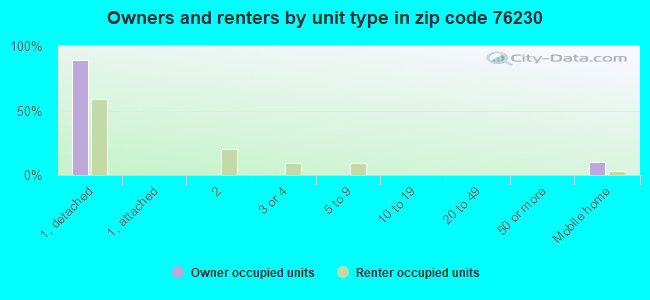
Houses and condos: 5,237 Renter-occupied apartments: 822
% of renters here:
20%
State:
38%
March 2022 cost of living index in zip code 76230: 80.1 (low, U.S. average is 100)
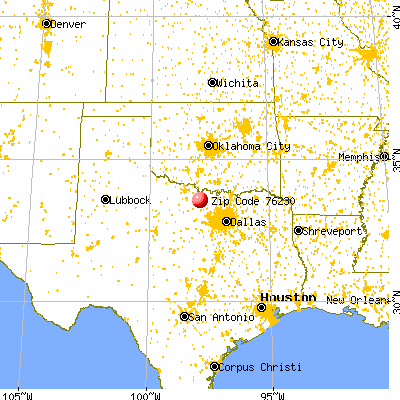
Land area: 378.7 sq. mi. Water area: 4.7 sq. mi.
Population density: 26 people per square mile
(very low).
OSM Map
General Map
Google Map
MSN Map
OSM Map
General Map
Google Map
MSN Map
OSM Map
General Map
Google Map
MSN Map
OSM Map
General Map
Google Map
MSN Map
Please wait while loading the map...
Real estate property taxes paid for housing units in 2022:
This zip code:
1.0% ($2,010)
Texas:
1.5% ($4,050)
Median real estate property taxes paid for housing units with mortgages in 2022: $2,184 (0.9%) Median real estate property taxes paid for housing units with no mortgage in 2022: $1,996 (1.1%)
Averages for the 2020 tax year for zip code 76230, filed in 2021:
Average Adjusted Gross Income (AGI) in 2020: $59,352 (Individual Income Tax Returns)
Here:
$59,352
State:
$77,054
Salary/wage: $53,090 (reported on 77.9% of returns)
Here:
$53,090
State:
$62,766
(% of AGI for various income ranges: 1154.1% for AGIs below $25k, 3626.3% for AGIs $25k-50k, 6532.6% for AGIs $50k-75k, 9309.4% for AGIs $75k-100k, 14902.6% for AGIs $100k-200k, 94270.0% for AGIs over 200k)
Taxable interest for individuals: $1,858 (reported on 29.2% of returns)
This zip code:
$1,858
Texas:
$2,665
(% of AGI for various income ranges: 17.8% for AGIs below $25k, 48.3% for AGIs $25k-50k, 57.2% for AGIs $50k-75k, 117.4% for AGIs $75k-100k, 120.3% for AGIs $100k-200k, 2480.0% for AGIs over 200k)
Ordinary dividends: $5,219 (reported on 13.4% of returns)
Here:
$5,219
State:
$10,044
(% of AGI for various income ranges: 27.3% for AGIs below $25k, 32.1% for AGIs $25k-50k, 102.6% for AGIs $50k-75k, 101.3% for AGIs $75k-100k, 221.8% for AGIs $100k-200k, 3150.0% for AGIs over 200k)
Net capital gain/loss in AGI: +$16,113 (reported on 14.1% of returns)
Here:
+$16,113
State:
+$39,590
(% of AGI for various income ranges: 12.2% for AGIs below $25k, 49.2% for AGIs $25k-50k, 106.4% for AGIs $50k-75k, 190.6% for AGIs $75k-100k, 800.0% for AGIs $100k-200k, 18760.0% for AGIs over 200k)
Profit/loss from business: +$10,597 (reported on 21.4% of returns)
Here:
+$10,597
State:
+$10,888
(% of AGI for various income ranges: 167.5% for AGIs below $25k, 220.0% for AGIs $25k-50k, 197.4% for AGIs $50k-75k, 220.6% for AGIs $75k-100k, 650.6% for AGIs $100k-200k, 8343.3% for AGIs over 200k)
Taxable individual retirement arrangement distribution: $19,439 (reported on 8.7% of returns)
76230:
$19,439
Texas:
$24,740
(% of AGI for various income ranges: 56.3% for AGIs below $25k, 106.2% for AGIs $25k-50k, 196.4% for AGIs $50k-75k, 433.5% for AGIs $75k-100k, 714.1% for AGIs $100k-200k, 3933.3% for AGIs over 200k)
Total itemized deductions: $42,421 (reported on 5.5% of returns)
Here:
$42,421
State:
$40,428
(% of AGI for various income ranges: 179.7% for AGIs $25k-50k, 246.4% for AGIs $50k-75k, 316.5% for AGIs $75k-100k, 810.9% for AGIs $100k-200k, 12696.7% for AGIs over 200k)
Charity contributions: $14,294 (reported on 4.1% of returns)
Here:
$14,294
State:
$18,201
(% of AGI for various income ranges: 25.4% for AGIs $25k-50k, 70.2% for AGIs $50k-75k, 83.5% for AGIs $75k-100k, 215.6% for AGIs $100k-200k, 3440.0% for AGIs over 200k)
Taxes paid: $5,148 (reported on 5.2% of returns)
76230:
$5,148
State:
$7,821
(% of AGI for various income ranges: 19.0% for AGIs $25k-50k, 30.6% for AGIs $50k-75k, 40.0% for AGIs $75k-100k, 123.8% for AGIs $100k-200k, 1126.7% for AGIs over 200k)
Earned income credit: $2,430 (reported on 18.5% of returns)
Here:
$2,430
State:
$2,584
(% of AGI for various income ranges: 115.8% for AGIs below $25k, 86.2% for AGIs $25k-50k, 2.2% for AGIs $50k-75k)
Percentage of individuals using paid preparers for their 2020 taxes: 92.9%
Here:
93%
State:
92%
(% for various income ranges: 92.9% for AGIs below $25k, 93.2% for AGIs $25k-50k, 92.9% for AGIs $50k-75k, 93.2% for AGIs $75k-100k, 92.6% for AGIs $100k-200k, 91.7% for AGIs over 200k)
Averages for the 2012 tax year for zip code 76230, filed in 2013:
Average Adjusted Gross Income (AGI) in 2012: $57,840 (Individual Income Tax Returns)
Here:
$57,840
State:
$65,384
Salary/wage: $45,323 (reported on 79.7% of returns)
Here:
$45,323
State:
$52,524
(% of AGI for various income ranges: 71.8% for AGIs below $25k, 79.6% for AGIs $25k-50k, 75.1% for AGIs $50k-75k, 74.9% for AGIs $75k-100k, 66.4% for AGIs $100k-200k, 22.9% for AGIs over 200k)
Taxable interest for individuals: $2,257 (reported on 32.2% of returns)
This zip code:
$2,257
Texas:
$2,372
(% of AGI for various income ranges: 2.0% for AGIs below $25k, 0.9% for AGIs $25k-50k, 0.9% for AGIs $50k-75k, 0.9% for AGIs $75k-100k, 1.0% for AGIs $100k-200k, 2.1% for AGIs over 200k)
Ordinary dividends: $5,258 (reported on 15.7% of returns)
Here:
$5,258
State:
$9,721
(% of AGI for various income ranges: 1.9% for AGIs below $25k, 1.3% for AGIs $25k-50k, 1.3% for AGIs $50k-75k, 0.7% for AGIs $75k-100k, 1.2% for AGIs $100k-200k, 2.3% for AGIs over 200k)
Net capital gain/loss in AGI: +$17,195 (reported on 14.3% of returns)
Here:
+$17,195
State:
+$35,319
(% of AGI for various income ranges: 1.1% for AGIs $25k-50k, 0.7% for AGIs $50k-75k, 1.8% for AGIs $75k-100k, 3.2% for AGIs $100k-200k, 13.9% for AGIs over 200k)
Profit/loss from business: +$16,343 (reported on 22.0% of returns)
Here:
+$16,343
State:
+$13,732
(% of AGI for various income ranges: 11.2% for AGIs below $25k, 4.0% for AGIs $25k-50k, 4.7% for AGIs $50k-75k, 4.0% for AGIs $75k-100k, 6.9% for AGIs $100k-200k, 7.9% for AGIs over 200k)
Taxable individual retirement arrangement distribution: $13,347 (reported on 9.2% of returns)
76230:
$13,347
Texas:
$19,511
(% of AGI for various income ranges: 2.3% for AGIs below $25k, 1.5% for AGIs $25k-50k, 2.2% for AGIs $50k-75k, 2.8% for AGIs $75k-100k, 2.7% for AGIs $100k-200k, 1.2% for AGIs over 200k)
Total itemized deductions: $22,797 (21% of AGI, reported on 22.8% of returns)
Here:
$22,797
State:
$24,724
Here:
21.4% of AGI
State:
15.9% of AGI
(% of AGI for various income ranges: 7.2% for AGIs below $25k, 8.1% for AGIs $25k-50k, 10.8% for AGIs $50k-75k, 10.9% for AGIs $75k-100k, 11.1% for AGIs $100k-200k, 4.9% for AGIs over 200k)
Charity contributions: $6,656 (reported on 17.2% of returns)
Here:
$6,656
State:
$6,808
(% of AGI for various income ranges: 1.0% for AGIs below $25k, 1.2% for AGIs $25k-50k, 1.8% for AGIs $50k-75k, 1.9% for AGIs $75k-100k, 2.9% for AGIs $100k-200k, 2.0% for AGIs over 200k)
Taxes paid: $4,464 (reported on 22.3% of returns)
76230:
$4,464
State:
$6,921
(% of AGI for various income ranges: 1.3% for AGIs below $25k, 1.1% for AGIs $25k-50k, 1.7% for AGIs $50k-75k, 1.9% for AGIs $75k-100k, 2.1% for AGIs $100k-200k, 1.8% for AGIs over 200k)
Earned income credit: $2,186 (reported on 18.6% of returns)
Here:
$2,186
State:
$2,570
(% of AGI for various income ranges: 6.9% for AGIs below $25k, 1.1% for AGIs $25k-50k)
Percentage of individuals using paid preparers for their 2012 taxes: 64.9%
Here:
65%
State:
51%
(% for various income ranges: 57.1% for AGIs below $25k, 61.3% for AGIs $25k-50k, 71.2% for AGIs $50k-75k, 72.7% for AGIs $75k-100k, 76.7% for AGIs $100k-200k, 90.9% for AGIs over 200k)
Averages for the 2004 tax year for zip code 76230, filed in 2005:
Average Adjusted Gross Income (AGI) in 2004: $35,358 (Individual Income Tax Returns)
Here:
$35,358
State:
$47,881
Salary/wage: $33,248 (reported on 78.1% of returns)
Here:
$33,248
State:
$41,947
(% of AGI for various income ranges: 226.8% for AGIs below $10k, 67.9% for AGIs $10k-25k, 79.2% for AGIs $25k-50k, 81.8% for AGIs $50k-75k, 74.9% for AGIs $75k-100k, 50.4% for AGIs over 100k)
Taxable interest for individuals: $2,160 (reported on 39.0% of returns)
This zip code:
$2,160
Texas:
$2,255
(% of AGI for various income ranges: 16.8% for AGIs below $10k, 4.2% for AGIs $10k-25k, 1.6% for AGIs $25k-50k, 1.2% for AGIs $50k-75k, 1.7% for AGIs $75k-100k, 3.2% for AGIs over 100k)
Taxable dividends: $2,324 (reported on 19.3% of returns)
Here:
$2,324
State:
$4,261
(% of AGI for various income ranges: 9.3% for AGIs below $10k, 1.5% for AGIs $10k-25k, 1.0% for AGIs $25k-50k, 1.1% for AGIs $50k-75k, 1.1% for AGIs $75k-100k, 1.3% for AGIs over 100k)
Net capital gain/loss: +$6,853 (reported on 18.4% of returns)
Here:
+$6,853
State:
+$16,110
(% of AGI for various income ranges: 0.7% for AGIs below $10k, 0.5% for AGIs $10k-25k, 0.9% for AGIs $25k-50k, 1.6% for AGIs $50k-75k, 2.4% for AGIs $75k-100k, 11.7% for AGIs over 100k)
Profit/loss from business: +$10,064 (reported on 22.3% of returns)
Here:
+$10,064
State:
+$11,013
(% of AGI for various income ranges: 26.2% for AGIs below $10k, 10.8% for AGIs $10k-25k, 4.4% for AGIs $25k-50k, 2.5% for AGIs $50k-75k, 6.1% for AGIs $75k-100k, 9.5% for AGIs over 100k)
IRA payment deduction: $3,447 (reported on 2.6% of returns)
76230:
$3,447
Texas:
$3,120
(% of AGI for various income ranges: 0.2% for AGIs $10k-25k, 0.3% for AGIs $25k-50k, 0.2% for AGIs $50k-75k, 0.3% for AGIs $75k-100k, 0.3% for AGIs over 100k)
Self-employed pension: $12,083 (reported on 0.3% of returns)
Here:
$12,083
Texas:
$16,401
Total itemized deductions: $17,420 (26% of AGI, reported on 16.7% of returns)
Here:
$17,420
State:
$19,631
Here:
26.3% of AGI
State:
18.9% of AGI
(% of AGI for various income ranges: 30.3% for AGIs below $10k, 7.1% for AGIs $10k-25k, 7.0% for AGIs $25k-50k, 8.1% for AGIs $50k-75k, 9.3% for AGIs $75k-100k, 8.5% for AGIs over 100k)
Charity contributions deductions: $4,980 (7% of AGI, reported on 12.6% of returns)
Here:
$4,980
State:
$4,753
Here:
7.0% of AGI
State:
4.2% of AGI
(% of AGI for various income ranges: 2.1% for AGIs below $10k, 1.0% for AGIs $10k-25k, 1.4% for AGIs $25k-50k, 1.2% for AGIs $50k-75k, 2.2% for AGIs $75k-100k, 3.1% for AGIs over 100k)
Total tax: $5,060 (reported on 71.4% of returns)
76230:
$5,060
State:
$9,058
(% of AGI for various income ranges: 8.2% for AGIs below $10k, 4.4% for AGIs $10k-25k, 6.4% for AGIs $25k-50k, 8.5% for AGIs $50k-75k, 11.4% for AGIs $75k-100k, 19.3% for AGIs over 100k)
Earned income credit: $1,648 (reported on 19.1% of returns)
Here:
$1,648
State:
$2,024
Percentage of individuals using paid preparers for their 2004 taxes: 69.5%
Here:
69%
State:
57%
(% for various income ranges: 63.8% for AGIs below $10k, 69.9% for AGIs $10k-25k, 71.5% for AGIs $25k-50k, 71.2% for AGIs $50k-75k, 69.3% for AGIs $75k-100k, 82.6% for AGIs over 100k)
Household received Food Stamps/SNAP in the past 12 months: 173 Household did not receive Food Stamps/SNAP in the past 12 months: 3,864
Women who had a birth in the past 12 months: 131 (133 now married, 0 unmarried) Women who did not have a birth in the past 12 months: 1,634 (792 now married, 838 unmarried)
Housing units in zip code 76230 with a mortgage: 1,526 (36 second mortgage, 39 both second mortgage and home equity loan) Median monthly owner costs for units with a mortgage: $1,469 Median monthly owner costs for units without a mortgage: $592
Residents with income below the poverty level in 2022:
This zip code:
10.1%
Whole state:
14.0%
Residents with income below 50% of the poverty level in 2022:
This zip code:
2.8%
Whole state:
7.4%
Median number of rooms in houses and condos:
Here:
5.9
State:
6.3
Median number of rooms in apartments:
Here:
4.4
State:
4.0
Notable locations in this zip code not listed on our city pages
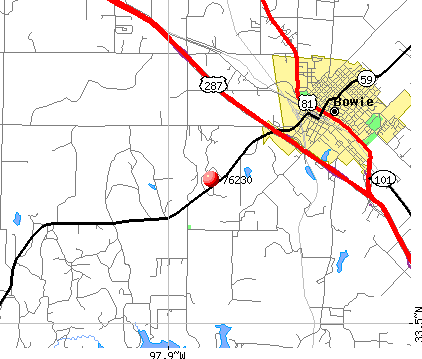
Notable locations in zip code 76230: Texas Agricultural Experimental Station (A), Fort Worth and Denver City Depot (B), Kenedy Public Library (C), Karnes City Public Library (D), Newport Volunteer Fire Department (E), Bowie Fire Department Emergency Medical Service (F), Bowie Rural Volunteer Fire Department (G). Display/hide their locations on the map
Churches in zip code 76230 include: Pleasant Ridge Church (A), Carter Lake Chapel (B), Lone Star Church (C), Seventh Day Adventist Church (D), Truth Tabernacle United Pentecostal Church (E), Saint Jerome Catholic Church (F), Union Hill Missionary Baptist Church (G), Hispanic Baptist Mission Church (H), First Baptist Church (I). Display/hide their locations on the map
Cemeteries: Brushy Cemetery (1), Elmwood Cemetery (2), Prairie Branch Cemetery (3), McDonald Cemetery (4), Lindale Cemetery (5), Selma Cemetery (6), Oak Hill Cemetery (7). Display/hide their locations on the map
Reservoirs: Sediment Control Structure 2-9 Reservoir (A), Gray Lake (B), Ellenburg Lake (C), Hinds Clark Lake (D), Soil Conservation Service Site 1f Reservoir (E), C E Campbell Lake (F), Soil Conservation Service Site 6 Reservoir (G), Soil Conservation Service Site 5b Reservoir (H). Display/hide their locations on the map
Streams, rivers, and creeks: Brier Creek (A), Victoria Creek (B), West Belknap Creek (C), South Creek (D), Trail Creek (E), Canyon Creek (F), Prairie Branch (G), Polecat Creek (H), North Fork Crooked Creek (I). Display/hide their locations on the map
In group quarters: 172 (-1 institutionalized population)
Size of family households: 1,278 2-persons, 643 3-persons, 411 4-persons, 333 5-persons, 88 6-persons
Size of nonfamily households: 1,023 1-person, 283 2-persons
1,521 married couples with children.
720 single-parent households (209 men, 511 women).
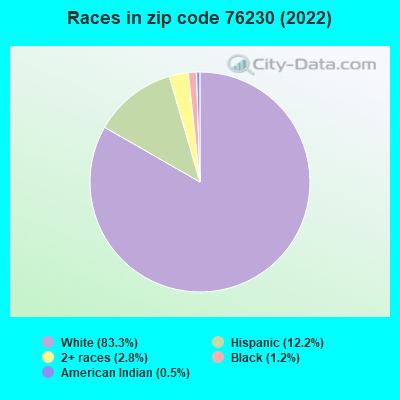
89.6% of residents of 76230 zip code speak English at home.
9.8% of residents speak Spanish at home (73% very well, 21% well, 6% not well).
0.7% of residents speak other Indo-European language at home (79% very well, 21% well).
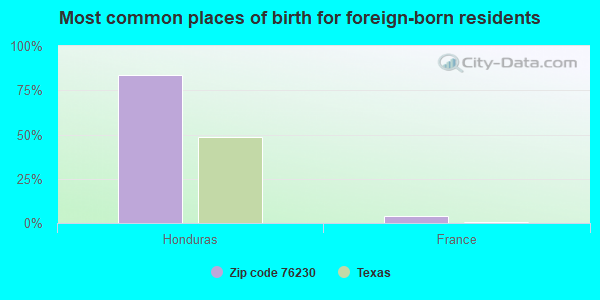
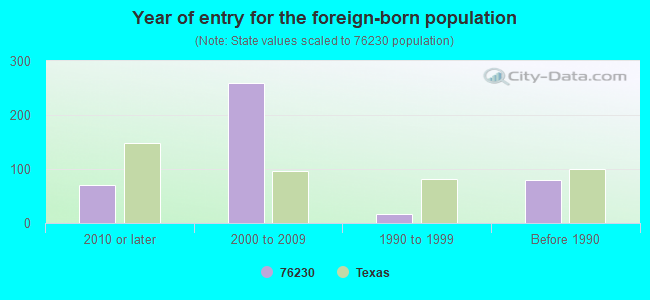
Foreign born population: 392 (3.9%) (15.2% of them are naturalized citizens)
This zip code:
3.9%
Whole state:
17.2%
84%Honduras
4%France
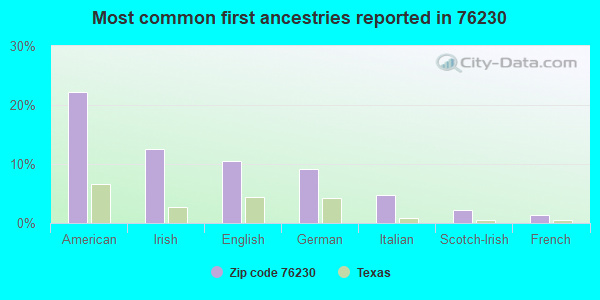
22%American
13%Irish
10%English
9%German
5%Italian
2%Scotch-Irish
1%French
Year of entry for the foreign-born population
702010 or later
2592000 to 2009
171990 to 1999
80Before 1990
Facilities with environmental interests located in this zip code:
ARCO PIPE LINE COMPANY (US HIGHWAY 287 in BOWIE, TX)
(Resource Conservation and Recovery Act (tracking hazardous waste)) Alternative names: KOCH PIPELINE CO BOWIE STATION
ASHLEY OIL CO BULK PLANT (CLAY & COWAN STREET in BOWIE, TX)
(Resource Conservation and Recovery Act (tracking hazardous waste))
AMOCO PIPELINE CO (2 MI WEST ON FM 174 in BOWIE, TX)
AIR MAJOR (AIRS/AFS) CRITERIA AND HAZARDOUS AIR POLLUTANT INVENTORY (Inventory of air pollution sources) Business SIC classification: CRUDE PETROLEUM PIPELINES
Housing units lacking complete plumbing facilities: 6.1% Housing units lacking complete kitchen facilities: 6.9%
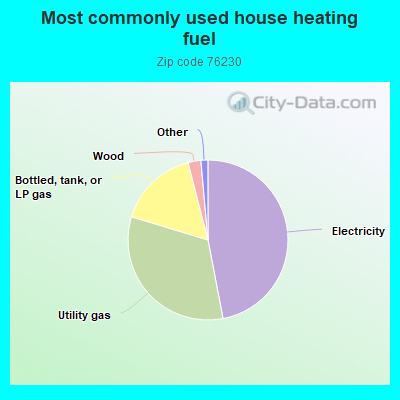
47.0%Electricity
32.7%Utility gas
16.3%Bottled, tank, or LP gas
2.6%Wood
0.8%Other fuel
0.7%No fuel used
Population in 1990: 8,686. Population change in the 1990s: +763 (+8.8%).
Place of birth for U.S.-born residents:
This state: 7,223
Northeast: 117
Midwest: 358
South: 615
West: 1,238
59% of the 76230 zip code residents lived in the same house 5 years ago. Out of people who lived in different houses, 46% lived in this county. Out of people who lived in different counties, 50% lived in Texas.
86% of the 76230 zip code residents lived in the same house 1 year ago. Out of people who lived in different houses, 33% moved from this county. Out of people who lived in different houses, 56% moved from different county within same state. Out of people who lived in different houses, 10% moved from different state. Out of people who lived in different houses, 2% moved from abroad.
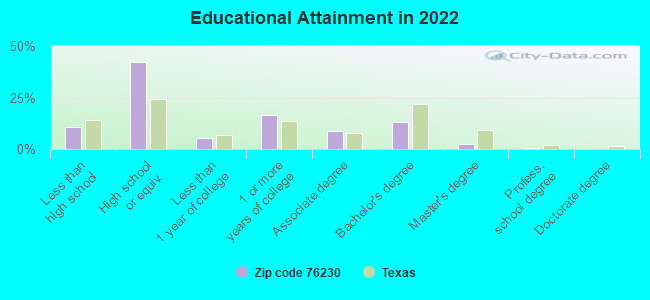
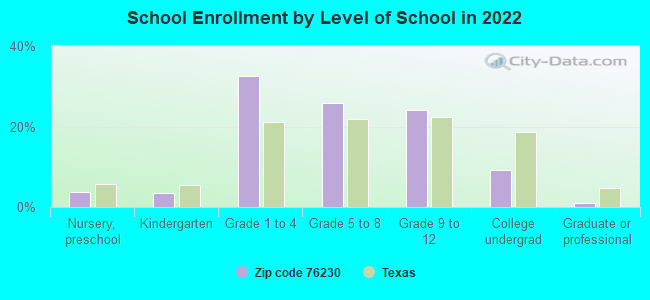
Private vs. public school enrollment:
Students in private schools in grades 1 to 8 (elementary and middle school): 44
Here:
3.3%
Texas:
8.8%
Students in private schools in grades 9 to 12 (high school): 45
Here:
8.3%
Texas:
8.0%
Students in private undergraduate colleges: 161
Here:
74.5%
Texas:
16.2%
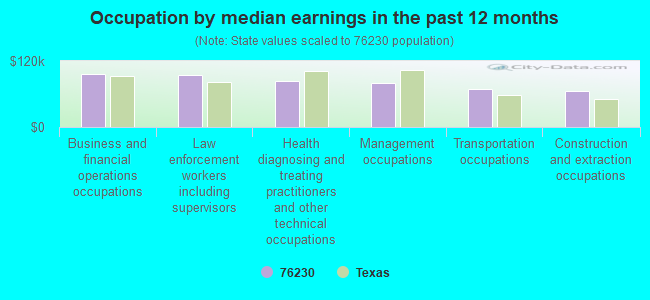
Occupation by median earnings in the past 12 months ($)
95,710Business and financial operations occupations
95,446Law enforcement workers including supervisors
83,546Health diagnosing and treating practitioners and other technical occupations
80,881Management occupations
69,938Transportation occupations
64,688Construction and extraction occupations
Companies with federal contracts located in this zip code:
PETES SUZUKI & POLARIS (606 W. WISE in BOWIE, TX; small business) : $127,034 in 3 contractsfrom 1999 to 2000
$95,248 with Army for Combat, Assault, and Tactical Vehicles, Tracked. Signed on 2000-05-16. Completion date: 2000-06-22.
$25,786 with Army for Motorcycles, Motor Scooters, and Bicycles. Signed on 2000-04-07. Completion date: 2000-04-21.
$6,000 with U.S. Fish and Wildlife Service for Motorcycles, Motor Scooters, and Bicycles. Taking place in MA. Signed on 1999-12-15. Completion date: 2000-02-15.
MARK DODD (1201 HWY 81 N in BOWIE, TX; small business)
$4,279 with Army for Paints, Dopes, Varnishes, and Related Products. Signed on 2004-05-19. Completion date: 2004-05-21.
BOWIE INDUSTRIES INCORPORATED (1004 E WISE ST in BOWIE, TX)
$2,376 with Army for Power and Hand Pumps. Signed on 2005-07-08. Completion date: 2005-08-10.
Top industries in this zip code by the number of employees in 2005:
Mining: Support Activities for Oil and Gas Operations (100-249 employees: 1 establishment, 20-49 employees: 1 establishment, 10-19 employees: 2 establishments, 1-4 employees: 8 establishments)
Health Care and Social Assistance: General Medical and Surgical Hospitals (100-249: 1)
131 people in nursing facilities/skilled-nursing facilities
People in group quarters in 2000:
196 people in nursing homes
Fatal accident statistics in 2012:
Fatal accident count: 2
Vehicles involved in fatal accidents: 2
Fatal accidents caused by drunken drivers: 0
Fatalities: 2
Persons involved in fatal accidents: 2
Pedestrians involved in fatal accidents: 1
Fatal accident statistics in 2011:
Fatal accident count: 1
Vehicles involved in fatal accidents: 1
Fatal accidents caused by drunken drivers: 0
Fatalities: 1
Persons involved in fatal accidents: 6
Pedestrians involved in fatal accidents: 0
2003 - 2018 National Fire Incident Reporting System (NFIRS) incidents
Based on the data from the years 2003 - 2018 the average number of fire incidents per year is 89. The highest number of reported fire incidents - 188 took place in 2005, and the least - 8 in 2018. The data has a decreasing trend.
When looking into fire subcategories, the most reports belonged to: Outside Fires (58.2%), and Structure Fires (26.2%).
Fire incident types reported to NFIRS in Zip Code 76230


 Nearest zip codes: 76228, 76270, 76431, 76261, 76251, 76225.


 Based on the data from the years 2003 - 2018 the average number of fire incidents per year is 89. The highest number of reported fire incidents - 188 took place in 2005, and the least - 8 in 2018. The data has a decreasing trend.
 When looking into fire subcategories, the most reports belonged to: Outside Fires (58.2%), and Structure Fires (26.2%).