Estimated zip code population in 2022: 21,043 Zip code population in 2010: 19,677 Zip code population in 2000: 19,892
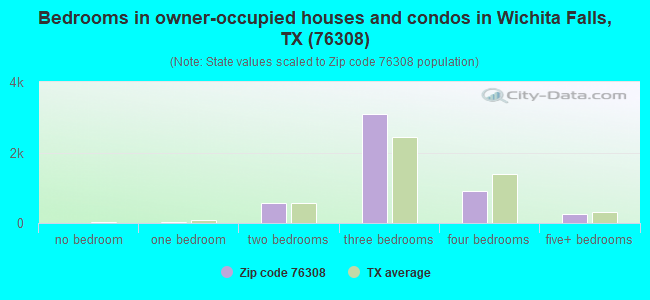
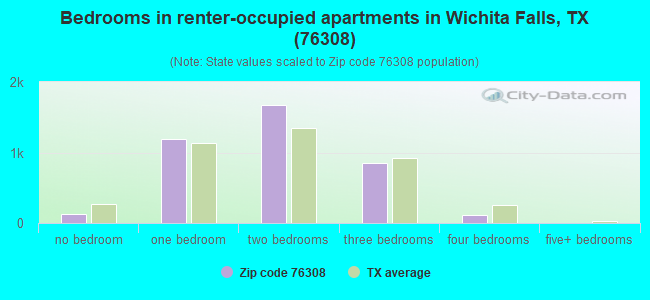
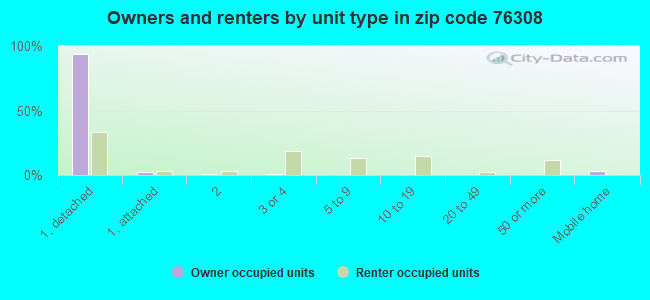
Houses and condos: 9,911 Renter-occupied apartments: 4,012
% of renters here:
45%
State:
38%
March 2022 cost of living index in zip code 76308: 83.5 (less than average, U.S. average is 100)
Land area: 9.0 sq. mi. Water area: 1.4 sq. mi.
Population density: 2,348 people per square mile
(low).
OSM Map
General Map
Google Map
MSN Map
OSM Map
General Map
Google Map
MSN Map
OSM Map
General Map
Google Map
MSN Map
OSM Map
General Map
Google Map
MSN Map
Please wait while loading the map...
Real estate property taxes paid for housing units in 2022:
This zip code:
1.7% ($3,538)
Texas:
1.5% ($4,050)
Median real estate property taxes paid for housing units with mortgages in 2022: $3,962 (1.7%) Median real estate property taxes paid for housing units with no mortgage in 2022: $3,049 (1.7%)
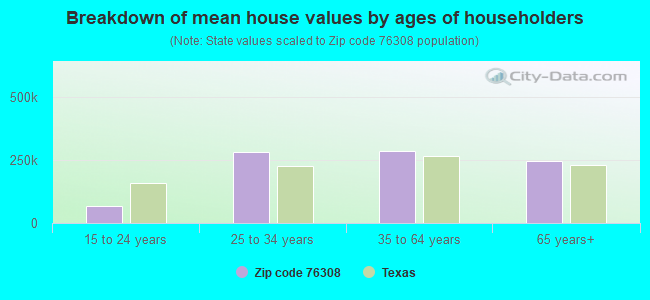
Estimated median house/condo value in 2022: $214,419
76308:
$214,419
Texas:
$275,400
According to our research of Texas and other state lists, there were 22 registered sex offenders living in 76308 zip code as of April 27, 2024. The ratio of all residents to sex offenders in zip code 76308 is 879 to 1. The ratio of registered sex offenders to all residents in this zip code is lower than the state average.
Median resident age:
This zip code:
31.7 years
Texas median age:
35.6 years
Average household size:
This zip code:
2.2 people
Texas:
2.6 people
Averages for the 2020 tax year for zip code 76308, filed in 2021:
Average Adjusted Gross Income (AGI) in 2020: $75,816 (Individual Income Tax Returns)
Here:
$75,816
State:
$77,054
Salary/wage: $53,293 (reported on 81.4% of returns)
Here:
$53,293
State:
$62,766
(% of AGI for various income ranges: 1165.2% for AGIs below $25k, 3445.6% for AGIs $25k-50k, 6332.5% for AGIs $50k-75k, 9179.6% for AGIs $75k-100k, 17462.6% for AGIs $100k-200k, 78336.4% for AGIs over 200k)
Taxable interest for individuals: $3,282 (reported on 31.0% of returns)
This zip code:
$3,282
Texas:
$2,665
(% of AGI for various income ranges: 13.8% for AGIs below $25k, 27.5% for AGIs $25k-50k, 51.4% for AGIs $50k-75k, 107.1% for AGIs $75k-100k, 257.4% for AGIs $100k-200k, 5386.4% for AGIs over 200k)
Ordinary dividends: $13,459 (reported on 19.5% of returns)
Here:
$13,459
State:
$10,044
(% of AGI for various income ranges: 29.8% for AGIs below $25k, 39.1% for AGIs $25k-50k, 120.7% for AGIs $50k-75k, 214.0% for AGIs $75k-100k, 620.3% for AGIs $100k-200k, 15313.6% for AGIs over 200k)
Net capital gain/loss in AGI: +$33,848 (reported on 18.8% of returns)
Here:
+$33,848
State:
+$39,590
(% of AGI for various income ranges: 7.7% for AGIs below $25k, 31.3% for AGIs $25k-50k, 68.7% for AGIs $50k-75k, 247.6% for AGIs $75k-100k, 897.3% for AGIs $100k-200k, 46508.2% for AGIs over 200k)
Profit/loss from business: +$19,735 (reported on 16.9% of returns)
Here:
+$19,735
State:
+$10,888
(% of AGI for various income ranges: 81.3% for AGIs below $25k, 90.3% for AGIs $25k-50k, 270.5% for AGIs $50k-75k, 432.5% for AGIs $75k-100k, 932.9% for AGIs $100k-200k, 15003.6% for AGIs over 200k)
Taxable individual retirement arrangement distribution: $19,844 (reported on 10.0% of returns)
76308:
$19,844
Texas:
$24,740
(% of AGI for various income ranges: 38.0% for AGIs below $25k, 88.1% for AGIs $25k-50k, 253.7% for AGIs $50k-75k, 370.9% for AGIs $75k-100k, 750.6% for AGIs $100k-200k, 5969.1% for AGIs over 200k)
Self-employed (Keogh) retirement plans: $37,800 (reported on 0.6% of returns)
76308:
$37,800
Texas:
$29,298
(% of AGI for various income ranges: 2061.8% for AGIs over 200k)
Total itemized deductions: $51,024 (reported on 7.6% of returns)
Here:
$51,024
State:
$40,428
(% of AGI for various income ranges: 41.5% for AGIs below $25k, 95.5% for AGIs $25k-50k, 259.4% for AGIs $50k-75k, 471.3% for AGIs $75k-100k, 1148.2% for AGIs $100k-200k, 19261.8% for AGIs over 200k)
Charity contributions: $27,208 (reported on 6.3% of returns)
Here:
$27,208
State:
$18,201
(% of AGI for various income ranges: 18.9% for AGIs $25k-50k, 56.1% for AGIs $50k-75k, 119.1% for AGIs $75k-100k, 406.7% for AGIs $100k-200k, 10729.1% for AGIs over 200k)
Taxes paid: $7,118 (reported on 7.6% of returns)
76308:
$7,118
State:
$7,821
(% of AGI for various income ranges: 4.1% for AGIs below $25k, 15.7% for AGIs $25k-50k, 48.1% for AGIs $50k-75k, 76.4% for AGIs $75k-100k, 235.9% for AGIs $100k-200k, 2070.0% for AGIs over 200k)
Earned income credit: $2,161 (reported on 14.4% of returns)
Here:
$2,161
State:
$2,584
(% of AGI for various income ranges: 73.5% for AGIs below $25k, 58.0% for AGIs $25k-50k, 1.1% for AGIs $50k-75k)
Percentage of individuals using paid preparers for their 2020 taxes: 93.1%
Here:
93%
State:
92%
(% for various income ranges: 93.7% for AGIs below $25k, 95.5% for AGIs $25k-50k, 92.6% for AGIs $50k-75k, 92.9% for AGIs $75k-100k, 91.3% for AGIs $100k-200k, 84.9% for AGIs over 200k)
Averages for the 2012 tax year for zip code 76308, filed in 2013:
Average Adjusted Gross Income (AGI) in 2012: $72,971 (Individual Income Tax Returns)
Here:
$72,971
State:
$65,384
Salary/wage: $46,941 (reported on 82.2% of returns)
Here:
$46,941
State:
$52,524
(% of AGI for various income ranges: 81.3% for AGIs below $25k, 78.1% for AGIs $25k-50k, 70.6% for AGIs $50k-75k, 70.2% for AGIs $75k-100k, 63.6% for AGIs $100k-200k, 26.6% for AGIs over 200k)
Taxable interest for individuals: $3,216 (reported on 36.2% of returns)
This zip code:
$3,216
Texas:
$2,372
(% of AGI for various income ranges: 1.2% for AGIs below $25k, 0.9% for AGIs $25k-50k, 1.5% for AGIs $50k-75k, 1.4% for AGIs $75k-100k, 1.2% for AGIs $100k-200k, 2.1% for AGIs over 200k)
Ordinary dividends: $14,817 (reported on 21.1% of returns)
Here:
$14,817
State:
$9,721
(% of AGI for various income ranges: 1.7% for AGIs below $25k, 1.3% for AGIs $25k-50k, 1.7% for AGIs $50k-75k, 1.8% for AGIs $75k-100k, 2.3% for AGIs $100k-200k, 7.9% for AGIs over 200k)
Net capital gain/loss in AGI: +$36,243 (reported on 18.2% of returns)
Here:
+$36,243
State:
+$35,319
(% of AGI for various income ranges: 0.2% for AGIs below $25k, 0.6% for AGIs $25k-50k, 0.5% for AGIs $50k-75k, 1.3% for AGIs $75k-100k, 2.5% for AGIs $100k-200k, 20.4% for AGIs over 200k)
Profit/loss from business: +$28,341 (reported on 17.3% of returns)
Here:
+$28,341
State:
+$13,732
(% of AGI for various income ranges: 4.1% for AGIs below $25k, 3.2% for AGIs $25k-50k, 4.4% for AGIs $50k-75k, 4.8% for AGIs $75k-100k, 5.4% for AGIs $100k-200k, 10.0% for AGIs over 200k)
Taxable individual retirement arrangement distribution: $15,896 (reported on 11.5% of returns)
76308:
$15,896
Texas:
$19,511
(% of AGI for various income ranges: 3.1% for AGIs below $25k, 1.9% for AGIs $25k-50k, 2.2% for AGIs $50k-75k, 3.8% for AGIs $75k-100k, 3.6% for AGIs $100k-200k, 1.8% for AGIs over 200k)
Self-employment retirement plans: $26,756 (reported on 1.0% of returns)
76308:
$26,756
Texas:
$23,938
(% of AGI for various income ranges: 0.3% for AGIs $100k-200k, 0.7% for AGIs over 200k)
Total itemized deductions: $30,846 (17% of AGI, reported on 24.8% of returns)
Here:
$30,846
State:
$24,724
Here:
17.4% of AGI
State:
15.9% of AGI
(% of AGI for various income ranges: 6.3% for AGIs below $25k, 6.7% for AGIs $25k-50k, 9.2% for AGIs $50k-75k, 11.6% for AGIs $75k-100k, 11.8% for AGIs $100k-200k, 11.6% for AGIs over 200k)
Charity contributions: $12,319 (reported on 19.7% of returns)
Here:
$12,319
State:
$6,808
(% of AGI for various income ranges: 0.8% for AGIs below $25k, 0.8% for AGIs $25k-50k, 1.7% for AGIs $50k-75k, 2.3% for AGIs $75k-100k, 3.0% for AGIs $100k-200k, 5.3% for AGIs over 200k)
Taxes paid: $7,004 (reported on 24.2% of returns)
76308:
$7,004
State:
$6,921
(% of AGI for various income ranges: 1.2% for AGIs below $25k, 1.4% for AGIs $25k-50k, 1.9% for AGIs $50k-75k, 2.9% for AGIs $75k-100k, 3.2% for AGIs $100k-200k, 2.3% for AGIs over 200k)
Earned income credit: $2,001 (reported on 15.3% of returns)
Here:
$2,001
State:
$2,570
(% of AGI for various income ranges: 4.9% for AGIs below $25k, 0.9% for AGIs $25k-50k)
Percentage of individuals using paid preparers for their 2012 taxes: 43.3%
Here:
43%
State:
51%
(% for various income ranges: 32.0% for AGIs below $25k, 38.2% for AGIs $25k-50k, 47.2% for AGIs $50k-75k, 55.6% for AGIs $75k-100k, 61.4% for AGIs $100k-200k, 82.6% for AGIs over 200k)
Averages for the 2004 tax year for zip code 76308, filed in 2005:
Average Adjusted Gross Income (AGI) in 2004: $54,714 (Individual Income Tax Returns)
Here:
$54,714
State:
$47,881
Salary/wage: $38,693 (reported on 80.8% of returns)
Here:
$38,693
State:
$41,947
(% of AGI for various income ranges: 211.0% for AGIs below $10k, 77.1% for AGIs $10k-25k, 76.6% for AGIs $25k-50k, 74.3% for AGIs $50k-75k, 71.5% for AGIs $75k-100k, 36.8% for AGIs over 100k)
Taxable interest for individuals: $2,973 (reported on 46.2% of returns)
This zip code:
$2,973
Texas:
$2,255
(% of AGI for various income ranges: 13.6% for AGIs below $10k, 3.2% for AGIs $10k-25k, 2.6% for AGIs $25k-50k, 2.3% for AGIs $50k-75k, 2.1% for AGIs $75k-100k, 2.4% for AGIs over 100k)
Taxable dividends: $7,090 (reported on 25.5% of returns)
Here:
$7,090
State:
$4,261
(% of AGI for various income ranges: 9.9% for AGIs below $10k, 1.5% for AGIs $10k-25k, 1.3% for AGIs $25k-50k, 1.4% for AGIs $50k-75k, 2.0% for AGIs $75k-100k, 5.0% for AGIs over 100k)
Net capital gain/loss: +$15,363 (reported on 21.9% of returns)
Here:
+$15,363
State:
+$16,110
(% of AGI for various income ranges: -1.7% for AGIs below $10k, 0.2% for AGIs $10k-25k, 0.5% for AGIs $25k-50k, 0.6% for AGIs $50k-75k, 1.3% for AGIs $75k-100k, 11.9% for AGIs over 100k)
Profit/loss from business: +$25,247 (reported on 17.6% of returns)
Here:
+$25,247
State:
+$11,013
(% of AGI for various income ranges: 0.2% for AGIs below $10k, 4.2% for AGIs $10k-25k, 3.9% for AGIs $25k-50k, 3.7% for AGIs $50k-75k, 5.7% for AGIs $75k-100k, 12.1% for AGIs over 100k)
IRA payment deduction: $3,510 (reported on 3.4% of returns)
76308:
$3,510
Texas:
$3,120
(% of AGI for various income ranges: 0.2% for AGIs $10k-25k, 0.3% for AGIs $25k-50k, 0.3% for AGIs $50k-75k, 0.3% for AGIs $75k-100k, 0.1% for AGIs over 100k)
Self-employed pension: $23,108 (reported on 1.4% of returns)
Here:
$23,108
Texas:
$16,401
Total itemized deductions: $21,765 (18% of AGI, reported on 25.0% of returns)
Here:
$21,765
State:
$19,631
Here:
17.8% of AGI
State:
18.9% of AGI
(% of AGI for various income ranges: 16.9% for AGIs below $10k, 6.9% for AGIs $10k-25k, 7.9% for AGIs $25k-50k, 10.3% for AGIs $50k-75k, 12.1% for AGIs $75k-100k, 10.4% for AGIs over 100k)
Charity contributions deductions: $8,477 (6% of AGI, reported on 21.5% of returns)
Here:
$8,477
State:
$4,753
Here:
6.4% of AGI
State:
4.2% of AGI
(% of AGI for various income ranges: 1.1% for AGIs below $10k, 0.9% for AGIs $10k-25k, 1.5% for AGIs $25k-50k, 2.5% for AGIs $50k-75k, 3.2% for AGIs $75k-100k, 4.6% for AGIs over 100k)
Total tax: $10,996 (reported on 75.9% of returns)
76308:
$10,996
State:
$9,058
(% of AGI for various income ranges: 4.6% for AGIs below $10k, 4.3% for AGIs $10k-25k, 7.3% for AGIs $25k-50k, 9.3% for AGIs $50k-75k, 11.4% for AGIs $75k-100k, 22.4% for AGIs over 100k)
Earned income credit: $1,611 (reported on 12.7% of returns)
Here:
$1,611
State:
$2,024
Percentage of individuals using paid preparers for their 2004 taxes: 52.3%
Here:
52%
State:
57%
(% for various income ranges: 42.1% for AGIs below $10k, 52.1% for AGIs $10k-25k, 48.0% for AGIs $25k-50k, 54.6% for AGIs $50k-75k, 60.2% for AGIs $75k-100k, 75.7% for AGIs over 100k)
Likely homosexual households (counted as self-reported same-sex unmarried-partner households)
Lesbian couples: 0.1% of all households
Gay men: 0.0% of all households
Household received Food Stamps/SNAP in the past 12 months: 444 Household did not receive Food Stamps/SNAP in the past 12 months: 8,394
Women who had a birth in the past 12 months: 201 (186 now married, 17 unmarried) Women who did not have a birth in the past 12 months: 5,431 (1,929 now married, 3,517 unmarried)
Housing units in zip code 76308 with a mortgage: 2,684 (137 second mortgage, 43 home equity loan, 98 both second mortgage and home equity loan) Houses without a mortgage: 8
Median monthly owner costs for units with a mortgage: $1,611 Median monthly owner costs for units without a mortgage: $687
Residents with income below the poverty level in 2022:
This zip code:
16.7%
Whole state:
14.0%
Residents with income below 50% of the poverty level in 2022:
This zip code:
7.9%
Whole state:
7.4%
Median number of rooms in houses and condos:
Here:
6.5
State:
6.3
Median number of rooms in apartments:
Here:
4.0
State:
4.0
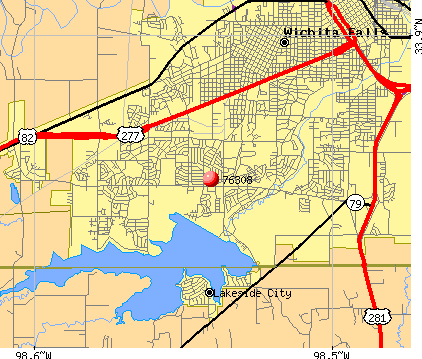
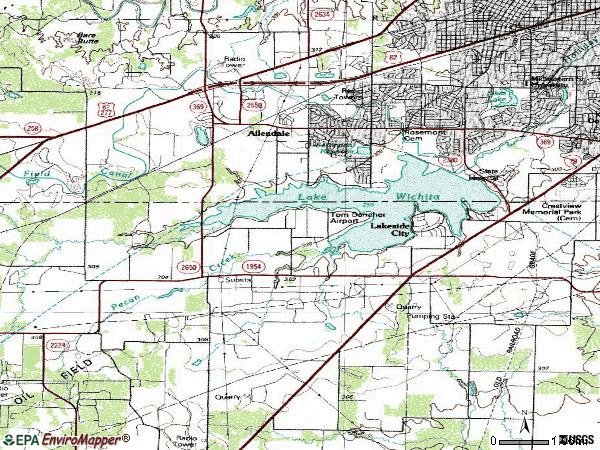
Notable locations in this zip code not listed on our city pages
Notable locations in zip code 76308: Milam School (A), Bowman School (B), Wichita Falls Fire Department Station 8 (C), Lakeside City Volunteer Fire Department (D), Wichita Falls Museum and Art Center (E), Bowman Volunteer Fire Department (F), Trans Star Ambulance (G). Display/hide their locations on the map
Churches in zip code 76308 include: Faith Church (A), Faith Baptist Church (B), Grant Street Church of Christ (C), Saint Marks United Methodist Church (D), Westminster Presbyterian Church (E), Trinity Presbyterianchurch (F), Fain Presbyterian Church (G), Barnett Road Baptist Church (H). Display/hide their locations on the map
Cemeteries: Crestview Cemetery (1), Lakeview Cemetery (2), Rosemont Cemetery (3), Rest Cemetery (4), Bowman Cemetery (5). Display/hide their locations on the map
Parks in zip code 76308 include: Lakeview Park (1), Kiwanis Park (2), Jaycee Park (3), Rotary Park (4), Tesco Park (5), Martin Plaza Park (6), Roselawn Park (7), D L Ligon Coliseum (8), Barwise Junior High School Field (9). Display/hide their locations on the map
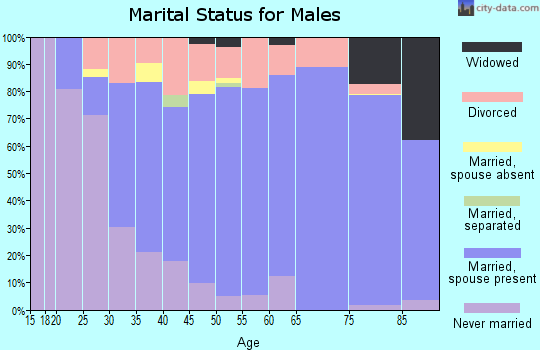
2,568 married couples with children.
1,538 single-parent households (385 men, 1,153 women).
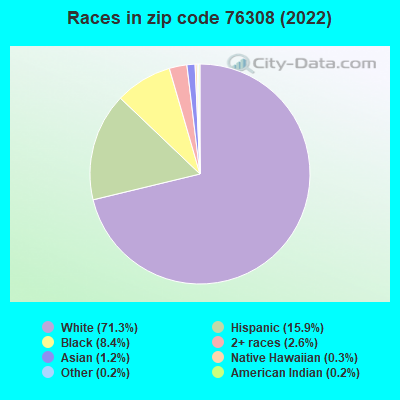
89.3% of residents of 76308 zip code speak English at home.
6.6% of residents speak Spanish at home (75% very well, 15% well, 10% not well).
1.9% of residents speak other Indo-European language at home (74% very well, 26% not well).
0.4% of residents speak Asian or Pacific Island language at home (78% very well, 12% well, 1% not well, 9% not at all).
2.0% of residents speak other language at home (100% very well).
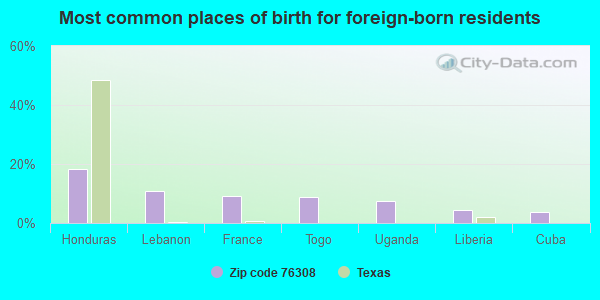
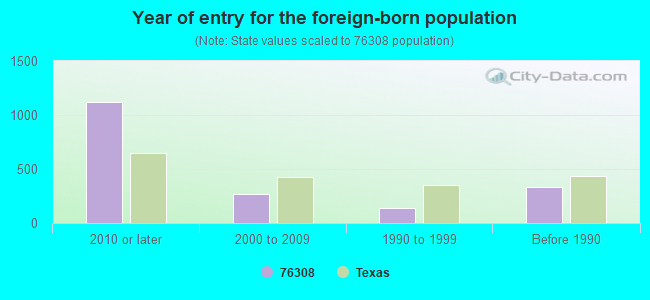
Foreign born population: 1,464 (7.0%) (25.4% of them are naturalized citizens)
Facilities with environmental interests located in this zip code:
A-1 EXTERMINATORS (3209 KEMP in WICHITA FALLS, TX)
(Resource Conservation and Recovery Act (tracking hazardous waste))
Housing units lacking complete plumbing facilities: 1.1% Housing units lacking complete kitchen facilities: 1.0%
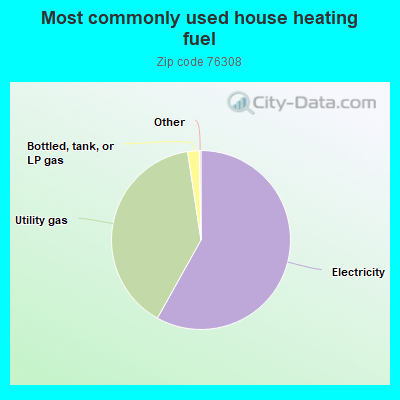
58.1%Electricity
39.5%Utility gas
2.1%Bottled, tank, or LP gas
Population in 1990: 19,151. Population change in the 1990s: +741 (+3.9%).
Place of birth for U.S.-born residents:
This state: 13,504
Northeast: 465
Midwest: 1,400
South: 2,206
West: 1,704
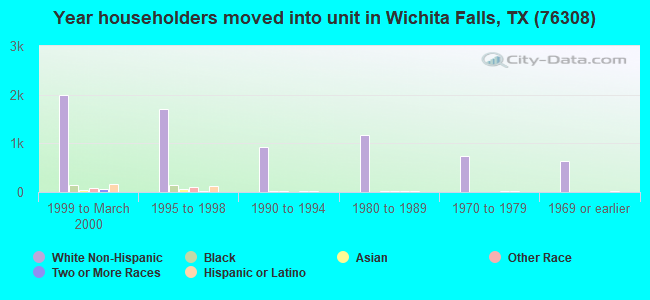
50% of the 76308 zip code residents lived in the same house 5 years ago. Out of people who lived in different houses, 53% lived in this county. Out of people who lived in different counties, 50% lived in Texas.
83% of the 76308 zip code residents lived in the same house 1 year ago. Out of people who lived in different houses, 43% moved from this county. Out of people who lived in different houses, 36% moved from different county within same state. Out of people who lived in different houses, 18% moved from different state. Out of people who lived in different houses, 3% moved from abroad.
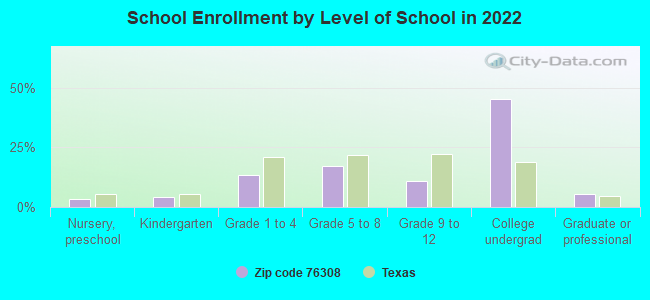
Private vs. public school enrollment:
Students in private schools in grades 1 to 8 (elementary and middle school): 191
Here:
9.4%
Texas:
8.8%
Students in private schools in grades 9 to 12 (high school): 50
Here:
7.1%
Texas:
8.0%
Students in private undergraduate colleges: 154
Here:
5.2%
Texas:
16.2%
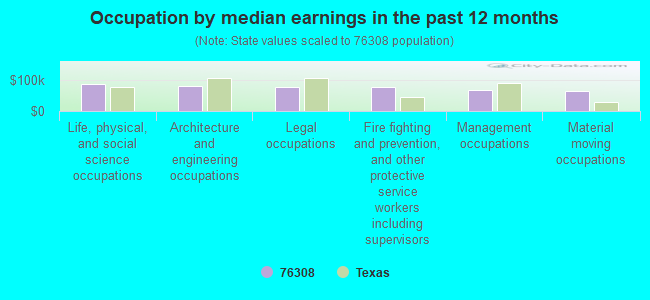
Occupation by median earnings in the past 12 months ($)
88,779Life, physical, and social science occupations
80,093Architecture and engineering occupations
79,778Legal occupations
76,744Fire fighting and prevention, and other protective service workers including supervisors
69,857Management occupations
66,710Material moving occupations
Companies with biggest federal contracts located in this zip code (WICHITA FALLS, TX):
CHOCTAW CONTRACTORS INC (3201 GARFIELD ST; small business) : $11,981,909 in 52 contractsfrom 2002 to 2006
Contracts for Maintenance, Repair or Alteration of Real Property -- Miscellaneous Buildings, Miscellaneous Items, Maintenance, Repair or Alteration of Real Property -- Other Non-Building Facilities, Maintenance, Repair or Alteration of Real Property -- Hospitals and Infirmaries, and moreby Air Force, Federal Supply Service, Department of Veterans Affairs, Navy, and others Signed by year:2000: $0; 2001: $0; 2002: $2,826,452; 2003: $4,549,671; 2004: $723,205; 2005: $3,800,489; 2006: $82,092.
Biggest contracts:
$2,230,718 with Air Force for Maintenance, Repair or Alteration of Real Property -- Miscellaneous Buildings. Signed on 2003-08-29. Completion date: 2004-10-11.
$1,441,257, same as above.Signed on 2003-08-14. Completion date: 2004-03-29.
$1,275,652 with Federal Supply Service for Miscellaneous Items. Signed on 2005-03-23. Completion date: 2005-09-22.
$1,199,662 with Air Force for Maintenance, Repair or Alteration of Real Property -- Other Non-Building Facilities. Signed on 2002-09-30. Completion date: 2003-07-27.
MEDCAM JOINT VENTURE (3115 A BUCHANAN) : $6,930,865 in 21 contractsfrom 1999 to 2000
Contracts for Operation of Government-Owned Facilities -- Hospitals and Infirmaries by Army Signed by year:2000: $6,619,743; 2001: $0; 2002: $0; 2003: $0; 2004: $0; 2005: $0; 2006: $0.
Biggest contracts:
$1,124,988 with Army for Operation of Government-Owned Facilities -- Hospitals and Infirmaries. Taking place in HI. Signed on 2000-02-01. Completion date: 2000-04-30.
$1,121,789 with Army for Operation of Government-Owned Facilities -- Hospitals and Infirmaries. Taking place in KY. Signed on 2000-02-29. Completion date: 2000-09-15.
$1,099,191 with Army for Operation of Government-Owned Facilities -- Hospitals and Infirmaries. Signed on 2000-05-14. Completion date: 2000-09-15.
$873,823 with Army for Operation of Government-Owned Facilities -- Hospitals and Infirmaries. Taking place in GA. Signed on 2000-02-29. Completion date: 2000-09-15.
SECORD & LEBOW ARCHITECTS, L L (2004 QUAIL CREEK, SUITE 20; small business)
$99,963 with Army for Other Buildings. Signed on 2004-07-30. Completion date: 2004-09-01.
LANCO TURF & SEEDING, INC (3103 BARRETT PL; small business)
$71,700 with U.S. Army Corps of Engineers - civil program financing only for Construction of Structures and Facilities -- Recreation Facilities (Non-Building). Signed on 2003-04-29. Completion date: 2003-06-20.
RAINBOW INTERNATIONAL CARPET (5023 LAKE RD; small business) : $53,781 in 5 contractsfrom 2004 to 2006
Contracts for Maintenance, Repair or Alteration of Real Property -- Miscellaneous Buildings, Custodial Janitorial Services by Air Force Signed by year:2000: $0; 2001: $0; 2002: $0; 2003: $0; 2004: $10,000; 2005: $11,457; 2006: $32,324.
Biggest contracts:
$25,000 with Air Force for Maintenance, Repair or Alteration of Real Property -- Miscellaneous Buildings. Signed on 2006-04-08. Completion date: 2006-04-14.
$10,000 with Air Force for Custodial Janitorial Services. Signed on 2004-12-29. Completion date: 2005-01-27.
$7,324 with Air Force for Maintenance, Repair or Alteration of Real Property -- Miscellaneous Buildings. Signed on 2006-05-05. Completion date: 2006-04-14.
$5,876 with Air Force for Custodial Janitorial Services. Signed on 2005-06-20. Completion date: 2005-07-22.
UNITED STATES CELLULAR CORPORA (4245 KEMP BLVD STE 820; small business)
$37,357 with Air Force for Lease or Rental of Equipment -- Communication, Detection, and Coherent Radiation Equipment. Taking place in OK. Signed on 1999-10-01. Completion date: 2000-09-30.
GOVERNMENT TECHNICAL SERVICES, (3115 BUCHANAN; small business) : $27,470 in 4 contractsfrom 2005 to 2006
$14,575 with Air Force for Maintenance, Repair or Alteration of Real Property -- Miscellaneous Buildings. Signed on 2005-09-21. Completion date: 2005-11-21.
$8,498, same as above.Signed on 2005-09-27. Completion date: 2005-11-24.
$4,197, same as above.Signed on 2006-01-04. Completion date: 2006-01-23.
$200 with Army for Construction of Structures and Facilities -- Maintenance Buildings. Signed on 2005-08-16. Completion date: 2007-06-30.
MIDWESTERN STATE UNIVERSITY (3410 TAFT BLVD) : $17,660 in 3 contractsin 2005
$6,879 with Air Force for Tuition, Registration, and Membership Fees. Signed on 2005-04-13. Completion date: 2005-09-30.
$5,688, same as above.Signed on 2005-03-23. Completion date: 2005-09-30.
$5,093, same as above.Signed on 2005-12-02. Completion date: 2005-12-02.
ROGER HOLCOMBS PLUMBING &MECHA (4401 ABBOTT; small business)
$8,500 with Air Force for Maintenance, Repair or Alteration of Real Property -- Sewage and Waste Facilities. Signed on 2000-01-24. Completion date: 2000-03-06.
CADY & LANDES ENTERPRISES INC (2801 KELL BLVD; small business)
$5,761 with Navy for Floor Coverings. Signed on 2005-07-27. Completion date: 2005-08-09.
Top industries in this zip code by the number of employees in 2005:
Health Care and Social Assistance: Psychiatric and Substance Abuse Hospitals (over 1000 employees: 1 establishment)
2004 - 2018 National Fire Incident Reporting System (NFIRS) incidents
According to the data from the years 2004 - 2018 the average number of fires per year is 70. The highest number of fire incidents - 114 took place in 2012, and the least - 4 in 2004. The data has a rising trend.
When looking into fire subcategories, the most reports belonged to: Outside Fires (48.0%), and Structure Fires (37.3%).
Fire incident types reported to NFIRS in Zip Code 76308

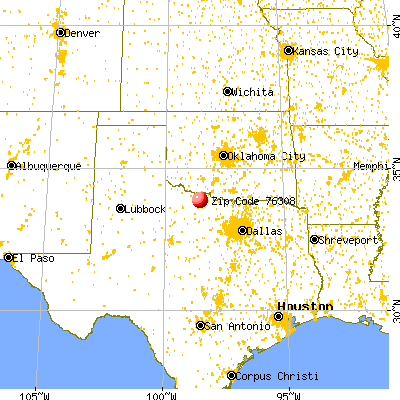


 Nearest zip codes: 76309, 76302, 76310, 76301, 76306, 76311.


 According to the data from the years 2004 - 2018 the average number of fires per year is 70. The highest number of fire incidents - 114 took place in 2012, and the least - 4 in 2004. The data has a rising trend.
 When looking into fire subcategories, the most reports belonged to: Outside Fires (48.0%), and Structure Fires (37.3%).