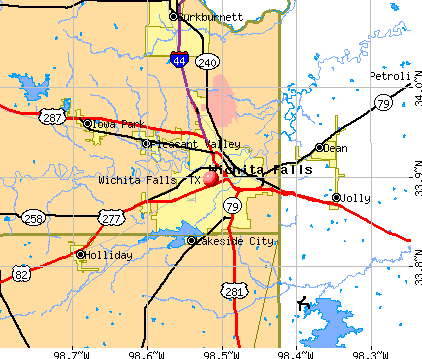
Wichita Falls, Texas
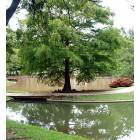
Wichita Falls: Duck Pond in Lucy Park

Wichita Falls: The Falls in Wichita Falls

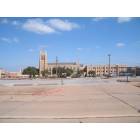
Wichita Falls: Midwestern State University Bell Tower
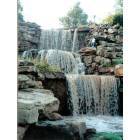
Wichita Falls: The Falls
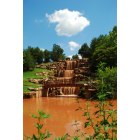
Wichita Falls: Wichita Falls.. The Falls
Wichita Falls
Wichita Falls: I love old rocks & found this landmark rock last week upon visiting.

Wichita Falls: Wee chee tah is what the Indian lady was telling the braves-which means the water is waist deep

Wichita Falls: Pagoda in Lucy Park
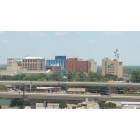
Wichita Falls: Wichita Falls downtown skyline
Wichita Falls: Part of downtown
- see
16
more - add
your
Submit your own pictures of this city and show them to the world
- OSM Map
- General Map
- Google Map
- MSN Map
Population change since 2000: -1.5%
 |
| Males: 54,834 | |
| Females: 47,830 |
| Median resident age: | 34.4 years |
| Texas median age: | 35.6 years |
Zip codes: 76301, 76302, 76306, 76309, 76311.
Wichita Falls Zip Code Map| Wichita Falls: | $56,091 |
| TX: | $72,284 |
Estimated per capita income in 2022: $31,730 (it was $16,761 in 2000)
Wichita Falls city income, earnings, and wages data
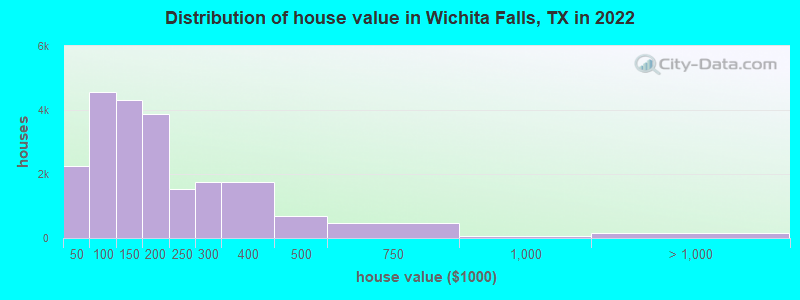
Estimated median house or condo value in 2022: $148,900 (it was $60,900 in 2000)
| Wichita Falls: | $148,900 |
| TX: | $275,400 |
Mean prices in 2022: all housing units: $220,094; detached houses: $211,338; townhouses or other attached units: $250,320; in 2-unit structures: $127,797; in 3-to-4-unit structures: $168,164; in 5-or-more-unit structures: $204,957; mobile homes: $512,312
Median gross rent in 2022: $965.
(13.1% for White Non-Hispanic residents, 23.8% for Black residents, 24.7% for Hispanic or Latino residents, 8.1% for American Indian residents, 15.8% for Native Hawaiian and other Pacific Islander residents, 18.3% for other race residents, 23.0% for two or more races residents)
Detailed information about poverty and poor residents in Wichita Falls, TX


Compare current foreclosures in Wichita Falls, TX:
| Photo | Address | Area | Beds / Baths | Price | Details |
|---|---|---|---|---|---|

|
#1
Country Holw
Wichita Falls, TX 76310
|
1,918 sq. feet
|
2 baths 3 beds |
$184,900
|
show details |

|
#2
Garfield St
Wichita Falls, TX 76308
|
970 sq. feet
|
1 baths 2 beds |
show details | |

|
#3
Karla St
Wichita Falls, TX 76310
|
1,451 sq. feet
|
2 baths 3 beds |
show details | |

|
#4
Deer Park Way
Wichita Falls, TX 76306
|
1,198 sq. feet
|
2 baths 3 beds |
show details | |

|
#5
Gladiolus St
Wichita Falls, TX 76301
|
1,974 sq. feet
|
3 baths 4 beds |
show details | |

|
#6
Hursh Ave
Wichita Falls, TX 76302
|
1,674 sq. feet
|
2 baths 3 beds |
show details | |

|
#7
Seymour Rd
Wichita Falls, TX 76309
|
4,227 sq. feet
|
4 baths 4 beds |
show details | |

|
#8
Ecleto Blvd
Wichita Falls, TX 76308
|
1,563 sq. feet
|
2 baths 3 beds |
show details | |

|
#9
K Mart Dr
Wichita Falls, TX 76308
|
1,443 sq. feet
|
2 baths 3 beds |
show details | |

|
#10
Edgecliff Dr
Wichita Falls, TX 76302
|
2,308 sq. feet
|
2 baths 3 beds |
show details |
| Photo | Address | Area | Beds / Baths | Price | Details |
|---|---|---|---|---|---|

|
#11
Colquit Rd
Wichita Falls, TX 76309
|
720 sq. feet
|
1 baths 2 beds |
show details | |

|
#12
Bullington St
Wichita Falls, TX 76301
|
1,698 sq. feet
|
2 baths 3 beds |
show details | |

|
#13
Ridgemont Dr
Wichita Falls, TX 76309
|
2,466 sq. feet
|
3 baths 3 beds |
show details | |

|
#14
Blazing Star Ct
Wichita Falls, TX 76310
|
1,292 sq. feet
|
2 baths 3 beds |
show details | |

|
#15
Westward Dr
Wichita Falls, TX 76308
|
1,428 sq. feet
|
1 baths 3 beds |
show details | |

|
#16
Geronimo Dr
Wichita Falls, TX 76310
|
1,675 sq. feet
|
2 baths 3 beds |
show details | |

|
#17
Elizabeth Ave
Wichita Falls, TX 76301
|
1,304 sq. feet
|
1 baths 2 beds |
show details | |

|
#18
El Capitan Dr
Wichita Falls, TX 76310
|
2,052 sq. feet
|
2 baths 3 beds |
show details | |

|
#19
Jenney Lee Dr
Wichita Falls, TX 76302
|
1,761 sq. feet
|
2 baths 3 beds |
show details | |

|
#20
Fillmore St
Wichita Falls, TX 76309
|
1,512 sq. feet
|
2 baths 4 beds |
show details |
| Photo | Address | Area | Beds / Baths | Price | Details |
|---|---|---|---|---|---|

|
#21
Grandview W
Wichita Falls, TX 76306
|
2,755 sq. feet
|
2 baths 4 beds |
show details | |

|
#22
Buchanan St
Wichita Falls, TX 76308
|
1,484 sq. feet
|
1 baths 3 beds |
show details | |

|
#23
Kingston Dr
Wichita Falls, TX 76310
|
1,650 sq. feet
|
2 baths 3 beds |
show details | |

|
#24
Amherst Dr
Wichita Falls, TX 76308
|
2,465 sq. feet
|
3 baths 4 beds |
show details | |

|
#25
Huff St
Wichita Falls, TX 76301
|
1,963 sq. feet
|
3 baths 5 beds |
show details | |

|
#26
Belmount Dr
Wichita Falls, TX 76308
|
1,558 sq. feet
|
2 baths 3 beds |
show details | |

|
#27
Smoke Rise Cir
Wichita Falls, TX 76306
|
1,211 sq. feet
|
2 baths 3 beds |
show details | |

|
#28
Canberra Dr
Wichita Falls, TX 76308
|
1,904 sq. feet
|
2 baths 3 beds |
show details | |

|
#29
Mcniel Ave
Wichita Falls, TX 76308
|
1,499 sq. feet
|
2 baths 3 beds |
show details | |

|
#30
Reilly Rd
Wichita Falls, TX 76306
|
1,452 sq. feet
|
2 baths 3 beds |
show details |
| Photo | Address | Area | Beds / Baths | Price | Details |
|---|---|---|---|---|---|

|
#31
Glenhaven Dr
Wichita Falls, TX 76306
|
1,075 sq. feet
|
2 baths 3 beds |
show details | |

|
#32
Craigmont Dr
Wichita Falls, TX 76309
|
2,406 sq. feet
|
3 baths 3 beds |
show details | |

|
#33
Talunar Ln
Wichita Falls, TX 76301
|
1,622 sq. feet
|
2 baths 3 beds |
show details | |

|
#34
Newsom Cir
Wichita Falls, TX 76308
|
1,125 sq. feet
|
1 baths 2 beds |
show details | |

|
#35
Sabota Ave
Wichita Falls, TX 76310
|
1,658 sq. feet
|
2 baths 3 beds |
show details | |

|
#36
Seymour Rd
Wichita Falls, TX 76309
|
1,598 sq. feet
|
2 baths 4 beds |
show details | |

|
#37
Mesquite St
Wichita Falls, TX 76302
|
2,572 sq. feet
|
2 baths 3 beds |
show details | |

|
#38
Webb Ave
Wichita Falls, TX 76310
|
1,131 sq. feet
|
2 baths 3 beds |
show details | |

|
#39
Dayton Ave
Wichita Falls, TX 76301
|
1,202 sq. feet
|
1 baths 2 beds |
show details | |

|
#40
Wyneth Dr
Wichita Falls, TX 76306
|
1,248 sq. feet
|
1 baths 3 beds |
show details |
| Photo | Address | Area | Beds / Baths | Price | Details |
|---|---|---|---|---|---|

|
#41
Ardath Ave
Wichita Falls, TX 76301
|
1,411 sq. feet
|
3 baths 3 beds |
show details | |

|
#42
Ardath Ave
Wichita Falls, TX 76301
|
1,330 sq. feet
|
2 baths 3 beds |
show details | |

|
#43
Hughes Dr
Wichita Falls, TX 76308
|
1,425 sq. feet
|
2 baths 4 beds |
show details | |

|
#44
Cape Cod Dr
Wichita Falls, TX 76310
|
1,080 sq. feet
|
2 baths 3 beds |
show details | |

|
#45
Mcgaha Ave
Wichita Falls, TX 76308
|
840 sq. feet
|
1 baths 2 beds |
show details | |

|
#46
N 8th St
Wichita Falls, TX 76306
|
1,248 sq. feet
|
1 baths 3 beds |
show details | |

|
#47
Crescent Ln
Wichita Falls, TX 76306
|
1,261 sq. feet
|
2 baths 3 beds |
show details | |

|
#48
Avalon Pl
Wichita Falls, TX 76306
|
1,538 sq. feet
|
2 baths 3 beds |
show details | |

|
#49
Sheridan Rd
Wichita Falls, TX 76302
|
1,868 sq. feet
|
2 baths 2 beds |
show details | |

|
Check over 1 million property listings on Foreclosure.com!
|
browse all offers | |||


- 60,55459.0%White alone
- 22,96022.4%Hispanic
- 10,87910.6%Black alone
- 4,0964.0%Two or more races
- 2,8292.8%Asian alone
- 1,0121.0%Native Hawaiian and Other
Pacific Islander alone - 2150.2%American Indian alone
- 1140.1%Other race alone
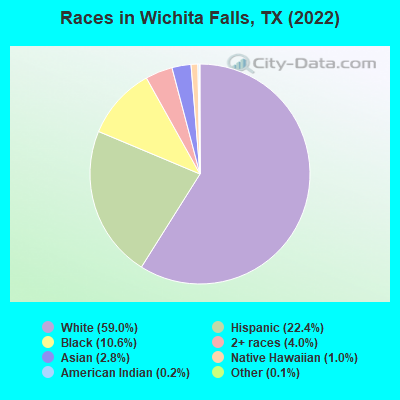
Races in Wichita Falls detailed stats: ancestries, foreign born residents, place of birth
According to our research of Texas and other state lists, there were 251 registered sex offenders living in Wichita Falls, Texas as of April 27, 2024.
The ratio of all residents to sex offenders in Wichita Falls is 417 to 1.
The ratio of registered sex offenders to all residents in this city is near the state average.
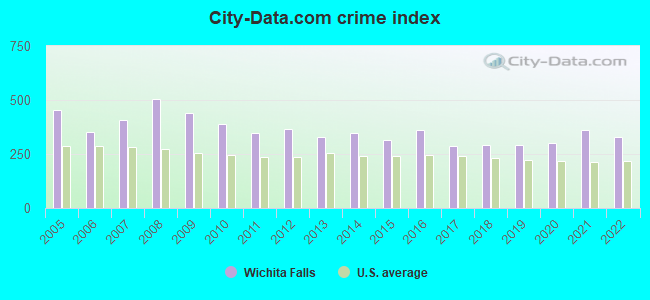
The City-Data.com crime index weighs serious crimes and violent crimes more heavily. Higher means more crime, U.S. average is 246.1. It adjusts for the number of visitors and daily workers commuting into cities.
- means the value is smaller than the state average.- means the value is about the same as the state average.
- means the value is bigger than the state average.
- means the value is much bigger than the state average.
Crime rate in Wichita Falls detailed stats: murders, rapes, robberies, assaults, burglaries, thefts, arson
Full-time law enforcement employees in 2021, including police officers: 265 (197 officers - 183 male; 14 female).
| Officers per 1,000 residents here: | 1.87 |
| Texas average: | 2.07 |
 Recent articles from our blog. Our writers, many of them Ph.D. graduates or candidates, create easy-to-read articles on a wide variety of topics.

 | Why is it that Houston seems to have more of an "energetic vibe" than Dallas? (607 replies) |
| Wichita Falls Welcome Package (11 replies) |
| Who is Really Moving to Texas? (64 replies) |
| Wichita Falls vs Tyler? Dallas/Fort Worth? (6 replies) |
| Coronavirus in Texas (main thread) (428 replies) |
| Driving from STL to Fredericksburg area: DFW route or Wichita Falls route? (4 replies) |
Latest news from Wichita Falls, TX collected exclusively by city-data.com from local newspapers, TV, and radio stations
Ancestries: American (11.4%), German (8.8%), Irish (7.0%), English (6.3%), European (2.4%), Scottish (1.1%).
Current Local Time: CST time zone
Elevation: 954 feet
Land area: 70.7 square miles.
Population density: 1,452 people per square mile (low).
7,483 residents are foreign born (3.5% Latin America, 1.9% Asia, 0.9% Africa).
| This city: | 7.3% |
| Texas: | 17.1% |
Median real estate property taxes paid for housing units with mortgages in 2022: $3,114 (2.0%)
Median real estate property taxes paid for housing units with no mortgage in 2022: $2,208 (1.6%)
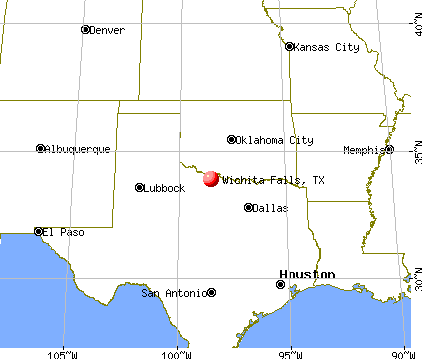
Nearest city with pop. 200,000+: Northeast Tarrant, TX (104.3 miles  , pop. 402,130).
Nearest city with pop. 1,000,000+: Dallas, TX (125.4 miles , pop. 1,188,580).
Nearest cities:
), ), ), ), ), Latitude: 33.90 N, Longitude: 98.51 W
Daytime population change due to commuting: +9,603 (+9.4%)
Workers who live and work in this city: 46,214 (91.0%)
Area code: 940
Wichita Falls tourist attractions:
Wichita Falls, Texas accommodation & food services, waste management - Economy and Business Data
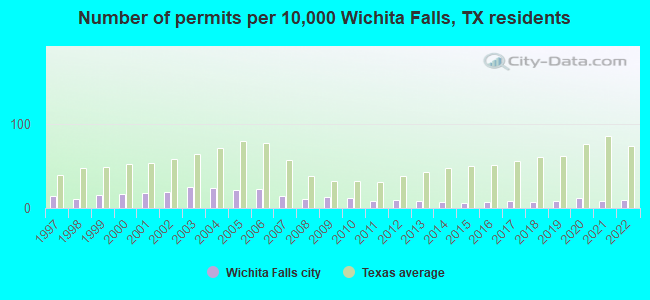
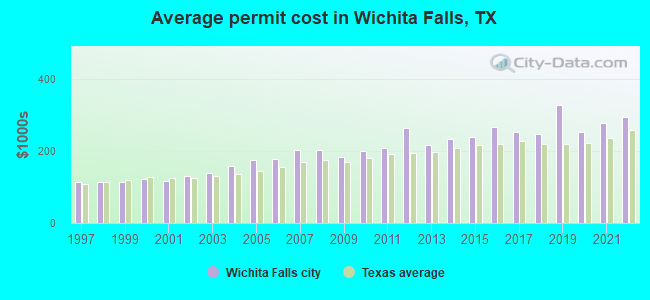
Single-family new house construction building permits:
- 2022: 96 buildings, average cost: $292,600
- 2021: 93 buildings, average cost: $276,700
- 2020: 130 buildings, average cost: $252,600
- 2019: 92 buildings, average cost: $327,400
- 2018: 75 buildings, average cost: $248,400
- 2017: 83 buildings, average cost: $252,300
- 2016: 71 buildings, average cost: $266,000
- 2015: 58 buildings, average cost: $239,000
- 2014: 74 buildings, average cost: $232,000
- 2013: 93 buildings, average cost: $215,600
- 2012: 105 buildings, average cost: $262,600
- 2011: 90 buildings, average cost: $207,300
- 2010: 119 buildings, average cost: $199,100
- 2009: 140 buildings, average cost: $182,400
- 2008: 111 buildings, average cost: $201,500
- 2007: 153 buildings, average cost: $202,300
- 2006: 238 buildings, average cost: $175,900
- 2005: 226 buildings, average cost: $173,900
- 2004: 248 buildings, average cost: $157,900
- 2003: 258 buildings, average cost: $138,100
- 2002: 205 buildings, average cost: $130,600
- 2001: 190 buildings, average cost: $116,300
- 2000: 177 buildings, average cost: $122,300
- 1999: 165 buildings, average cost: $113,900
- 1998: 112 buildings, average cost: $115,100
- 1997: 150 buildings, average cost: $115,000
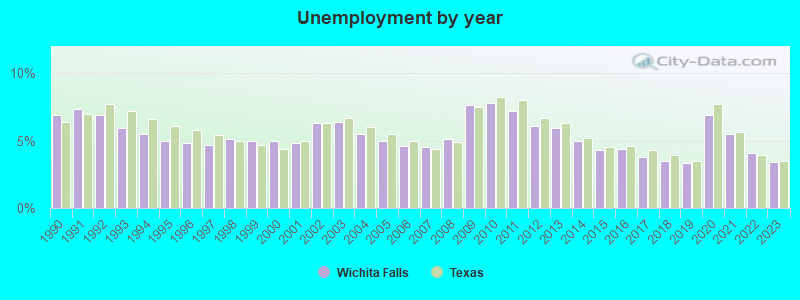
| Here: | 3.4% |
| Texas: | 3.5% |
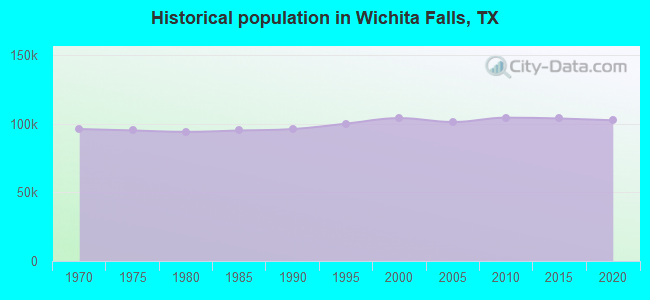
Population change in the 1990s: +7,589 (+7.9%).
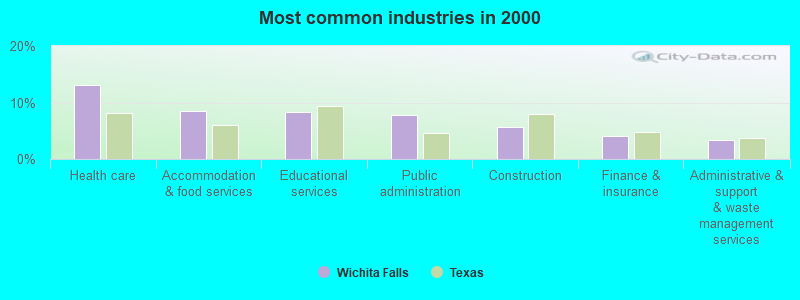
- Health care (13.1%)
- Accommodation & food services (8.5%)
- Educational services (8.3%)
- Public administration (7.8%)
- Construction (5.7%)
- Finance & insurance (4.1%)
- Administrative & support & waste management services (3.3%)
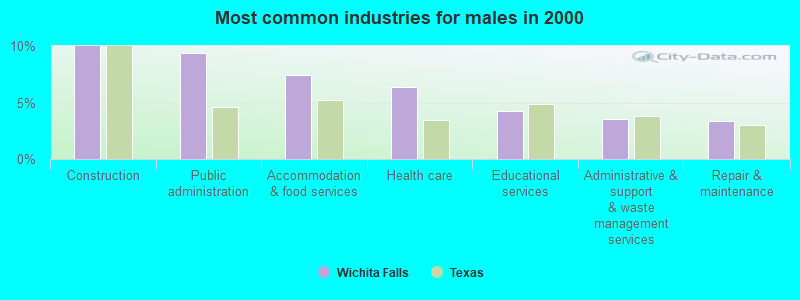
- Construction (10.0%)
- Public administration (9.4%)
- Accommodation & food services (7.5%)
- Health care (6.3%)
- Educational services (4.2%)
- Administrative & support & waste management services (3.5%)
- Repair & maintenance (3.4%)
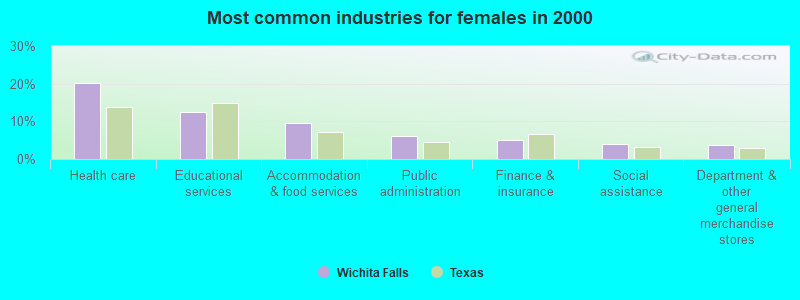
- Health care (20.3%)
- Educational services (12.6%)
- Accommodation & food services (9.6%)
- Public administration (6.1%)
- Finance & insurance (5.0%)
- Social assistance (3.9%)
- Department & other general merchandise stores (3.7%)
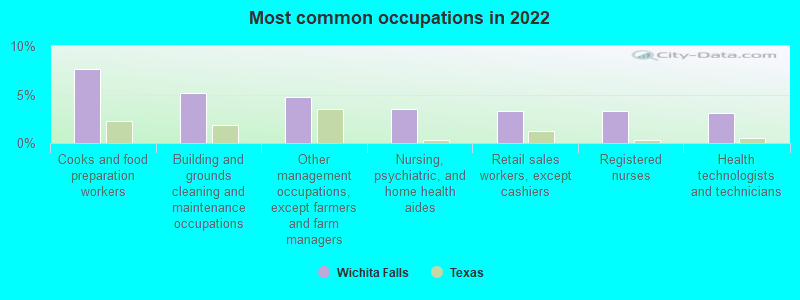
- Cooks and food preparation workers (7.7%)
- Building and grounds cleaning and maintenance occupations (5.1%)
- Other management occupations, except farmers and farm managers (4.7%)
- Nursing, psychiatric, and home health aides (3.5%)
- Retail sales workers, except cashiers (3.3%)
- Registered nurses (3.3%)
- Health technologists and technicians (3.1%)
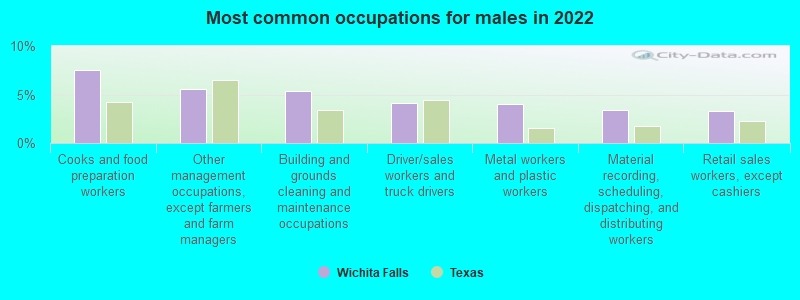
- Cooks and food preparation workers (7.6%)
- Other management occupations, except farmers and farm managers (5.5%)
- Building and grounds cleaning and maintenance occupations (5.3%)
- Driver/sales workers and truck drivers (4.2%)
- Metal workers and plastic workers (4.0%)
- Material recording, scheduling, dispatching, and distributing workers (3.4%)
- Retail sales workers, except cashiers (3.3%)
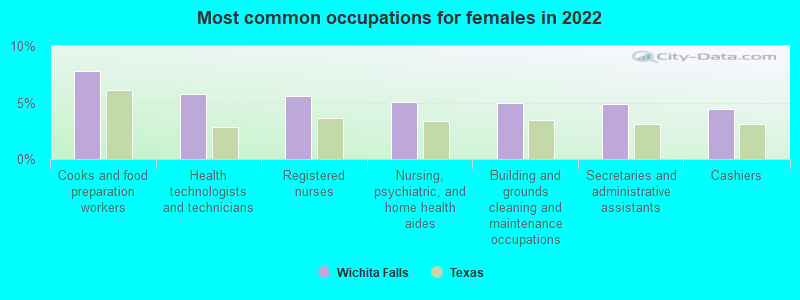
- Cooks and food preparation workers (7.8%)
- Health technologists and technicians (5.8%)
- Registered nurses (5.6%)
- Nursing, psychiatric, and home health aides (5.1%)
- Building and grounds cleaning and maintenance occupations (5.0%)
- Secretaries and administrative assistants (4.8%)
- Cashiers (4.4%)
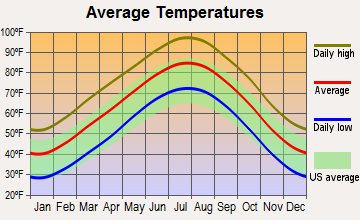
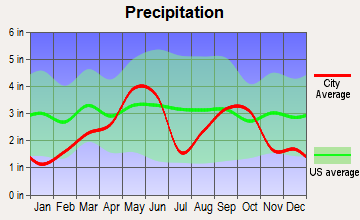
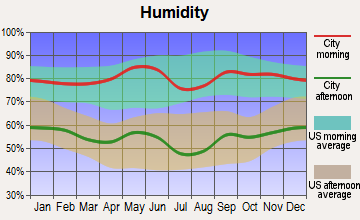
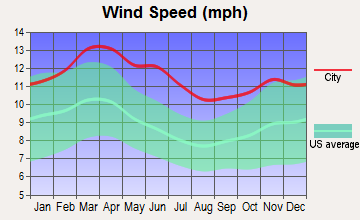
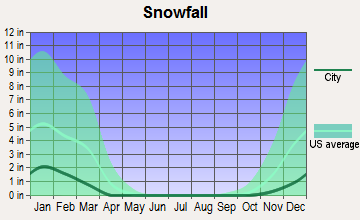
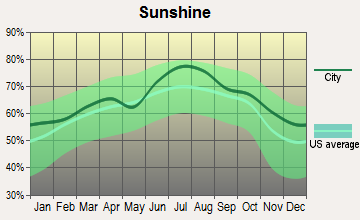
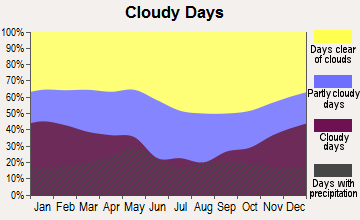
Average climate in Wichita Falls, Texas
Based on data reported by over 4,000 weather stations
|
|

(lower is better)
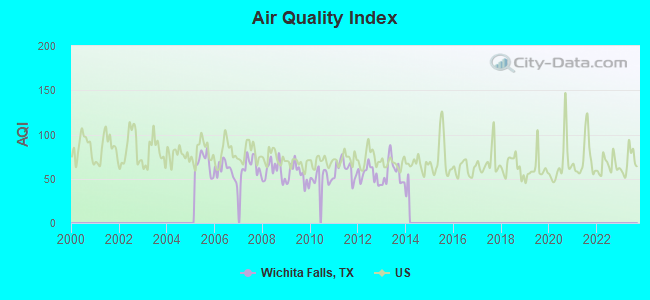
Air Quality Index (AQI) level in 2013 was 57.5. This is better than average.
| City: | 57.5 |
| U.S.: | 72.6 |
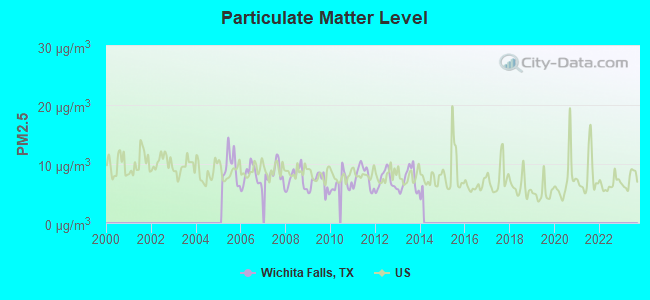
Particulate Matter (PM2.5) [µg/m3] level in 2013 was 7.24. This is about average. There were 0 monitors within city limits.
| City: | 7.24 |
| U.S.: | 8.11 |
Tornado activity:
Wichita Falls-area historical tornado activity is above Texas state average. It is 103% greater than the overall U.S. average.
On 4/3/1964, a category F5 (max. wind speeds 261-318 mph) tornado 0.9 miles away from the Wichita Falls city center killed 7 people and injured 111 people and caused between $5,000,000 and $50,000,000 in damages.
On 4/10/1979, a category F4 (max. wind speeds 207-260 mph) tornado 9.4 miles away from the city center killed 42 people and injured 1740 people and caused between $50,000,000 and $500,000,000 in damages.
Earthquake activity:
Wichita Falls-area historical earthquake activity is significantly above Texas state average. It is 592% greater than the overall U.S. average.On 11/6/2011 at 03:53:10, a magnitude 5.7 (5.7 MW, Depth: 3.2 mi, Class: Moderate, Intensity: VI - VII) earthquake occurred 150.6 miles away from the city center
On 9/3/2016 at 12:02:44, a magnitude 5.8 (5.8 MW, Depth: 3.5 mi) earthquake occurred 196.5 miles away from Wichita Falls center
On 6/16/1978 at 11:46:54, a magnitude 5.3 (4.4 MB, 4.6 UK, 5.3 ML) earthquake occurred 143.1 miles away from the city center
On 2/13/2016 at 17:07:06, a magnitude 5.1 (5.1 MW, Depth: 5.2 mi) earthquake occurred 179.7 miles away from Wichita Falls center
On 11/7/2016 at 01:44:24, a magnitude 5.0 (5.0 MW, Depth: 2.8 mi) earthquake occurred 174.3 miles away from Wichita Falls center
On 11/8/2011 at 02:46:57, a magnitude 4.8 (4.8 MW, Depth: 3.1 mi, Class: Light, Intensity: IV - V) earthquake occurred 149.7 miles away from the city center
Magnitude types: body-wave magnitude (MB), local magnitude (ML), moment magnitude (MW)
Natural disasters:
The number of natural disasters in Wichita County (18) is near the US average (15).Major Disasters (Presidential) Declared: 8
Emergencies Declared: 6
Causes of natural disasters: Fires: 8, Storms: 6, Floods: 5, Tornadoes: 5, Hurricanes: 3, Wind: 1, Other: 1 (Note: some incidents may be assigned to more than one category).

Hospitals in Wichita Falls:
- AMERICAN HOSPICE (4210 KELL BOULEVARD SUITE 211)
- COUNTRYVIEW COMMUNITY HOME (4666 SIERRA MADRE DR)
- DNS HOSPICE (2101 KEMP BLVD)
- HAMLIN HOUSE (1509 P B LN)
- HOSPICE OF WICHITA FALLS (4909 JOHNSON ROAD)
- KELL WEST REGIONAL HOSPITAL (Proprietary, provides emergency services, 5402 KELL WEST BOULEVARD)
- NORRIS PLACE (1555 NORRIS ST)
- OUACHITA ACRES (7752 STATE HWY 79 SOUTH)
- RED RIVER HOSPITAL (1505 8TH ST)
- UNITED REGIONAL HEALTH CARE SYSTEM (Voluntary non-profit - Private, 1600 11TH STREET)
Airports located in Wichita Falls:
- Sheppard Afb/Wichita Falls Municipal Airport (SPS) (Runways: 4, Commercial Ops: 1,977, Itinerant Ops: 2,099, Local Ops: 3,261, Military Ops: 97,691)
- Kickapoo Downtown Airport (CWC) (Runways: 1, Air Taxi Ops: 200, Itinerant Ops: 8,400, Local Ops: 25,200, Military Ops: 150)
- Wichita Valley Airport (F14) (Runways: 3, Itinerant Ops: 7,100, Local Ops: 14,200)
- Danaher Airport (7TX0) (Runways: 1, Itinerant Ops: 1,400, Local Ops: 2,800)
- Cactus Hill Airport (29TA) (Runways: 1)
- Klinkerman Airport (52XA) (Runways: 1)
Colleges/Universities in Wichita Falls:
- Midwestern State University (Full-time enrollment: 4,901; Location: 3410 Taft Blvd; Public; Website: www.mwsu.edu; Offers Master's degree)
- American Commercial College-Wichita Falls (Full-time enrollment: 146; Location: 4317 Barnett Rd; Private, for-profit; Website: www.americancommercialcollege.com)
Other colleges/universities with over 2000 students near Wichita Falls:
- Cameron University (about 50 miles; Lawton, OK; Full-time enrollment: 4,695)
- Vernon College (about 50 miles; Vernon, TX; FT enrollment: 2,216)
- Western Oklahoma State College (about 72 miles; Altus, OK; FT enrollment: 2,054)
- North Central Texas College (about 80 miles; Gainesville, TX; FT enrollment: 6,550)
- Weatherford College (about 91 miles; Weatherford, TX; FT enrollment: 4,080)
- University of North Texas (about 92 miles; Denton, TX; FT enrollment: 31,694)
- Texas Woman's University (about 93 miles; Denton, TX; FT enrollment: 11,837)
Biggest public high schools in Wichita Falls:
- RIDER H S (Students: 1,739, Location: 4611 CYPRESS AVE, Grades: 9-12)
- WICHITA FALLS H S (Students: 1,414, Location: 2149 AVE H, Grades: 9-12)
- MCNIEL J H (Students: 617, Location: 4712 BARNETT RD, Grades: 7-9)
- BRIGHT IDEAS CHARTER (Students: 197, Location: 2617 PLAZA PKWY UNIT 720, Grades: KG-12, Charter school)
- HARRELL ACCELERATED LEARNING CENTER (Students: 60, Location: 3115 FIFTH ST, Grades: 10-12)
- WICHITA COUNTY JUVENILE JUSTICE AEP (Students: 22, Location: 401 BURKBURNETT RD, Grades: 6-11)
- CITY VIEW JUNIOR/SENIOR HIGH (Location: 1600 CITY VIEW DR, Grades: 7-12)
- HIRSCHI H S (Location: 3106 BORTON ST, Grades: 9-12)
- KIRBY MIDDLE (Location: 1715 N LOOP 11, Grades: 6-9)
- DENVER CTR (Location: 5TH AND DENVER, Grades: 3-12)
Private high schools in Wichita Falls:
- WICHITA CHRISTIAN SCHOOL (Students: 329, Location: 4729 NETA LN, Grades: PK-12)
- CHRIST ACADEMY (Students: 241, Location: 5501 STONE LAKE DR, Grades: PK-12)
- NOTRE DAME CATHOLIC SCHOOL (Students: 205, Location: 2821 LANSING BLVD, Grades: PK-12)
- BIBLE BAPTIST CHRISTIAN SCHOOL (Students: 27, Location: 1606 30TH ST, Grades: PK-12)
Biggest public elementary/middle schools in Wichita Falls:
- JOHN G TOWER EL (Students: 729, Location: 5200 HOOPER DR, Grades: PK-5)
- SOUTHERN HILLS EL (Students: 570, Location: 3920 ARMORY RD, Grades: PK-6)
- CITY VIEW EL (Students: 559, Location: 1023 CITY VIEW DR, Grades: PK-6)
- FAIN EL (Students: 549, Location: 1562 NORMAN ST, Grades: PK-6)
- SCOTLAND PARK EL (Students: 496, Location: 1415 N 5TH ST, Grades: PK-6)
- WEST FOUNDATION EL (Students: 491, Location: 5220 LK WELLINGTON PKWY, Grades: PK-6)
- JEFFERSON EL (Students: 469, Location: 4628 MISTLETOE DR, Grades: PK-6)
- BURGESS EL (Students: 362, Location: 3106 MAURINE ST, Grades: PK-6)
- WASHINGTON-JACKSON EL MAGNET (Students: 346, Location: 1300 HARDING ST, Grades: PK-6)
- CUNNINGHAM SCHOOL (Students: 335, Location: 4107 PHILLIPS DR, Grades: PK-6)
User-submitted facts and corrections:
- Please add the Wichita Falls Church of Christ located at 4318 Fairway to your list of churches. Thank you so much for the service you provide to our city.
- Under churches in Wichita Falls, there should be listed "Jackson Memorial Church of God in Christ"
- Wichita Christian School is a PK - 12 school and I would like to see the school included under the private High School listings. Thank you
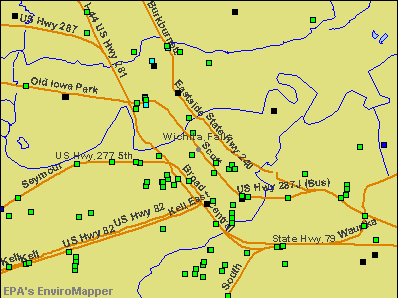
Points of interest:
Notable locations in Wichita Falls: Cook Ranch (A), Milam School (B), Oildom (C), Oklahoma Yards (D), Sunshine Yard (E), Skyline Country Club (F), Morningside Historic District (G), Hodges-Hardy-Chambers House (H), Wichita Falls Fire Department Station 2 (I), Wichita Falls Fire Department Station 5 (J), Wichita Falls Fire Department Station 7 (K), Wichita Falls Fire Department Station 8 (L), Wichita Falls Fire Department Station 6 (M), Wichita Falls Fire Department Station 4 (N), Wichita Falls Fire Department Station 3 (O), Wichita Falls Museum and Art Center (P), Kell House Museum (Q), Wichita Falls Fire Department Station 1 (R), Trans Star Ambulance (S), Air - Evac Lifeteam 34 Wichita Falls (T). Display/hide their locations on the map
Shopping Centers: Parker Square Shopping Center (1), Sikes Senter Shopping Center (2). Display/hide their locations on the map
Churches in Wichita Falls include: Faith Church (A), Morning Star Baptist Church (B), Messiah Baptist Church (C), Liberty Baptist Church (D), Jefferson Street Baptist Church (E), Iglesia Libertad Bautista Church (F), Iglesia Bautista Emanuel Church (G), Greater Saint Mark Baptist Church (H), Grace Baptist Church (I). Display/hide their locations on the map
Cemeteries: Crestview Memorial Park Cemetery (1), Crestview Cemetery (2), Sacred Heart Cemetery (3), Lakeview Cemetery (4), Rosemont Cemetery (5), Rest Cemetery (6), Riverside Cemetery (7). Display/hide their locations on the map
Reservoirs: City of Wichita Falls Lake (A), Sikes Lake (B), Denver Tank (C), Secondary Reservoir (D). Display/hide their locations on the map
Creeks: Pond Creek (A), Plum Creek (B). Display/hide their locations on the map
Parks in Wichita Falls include: Loch Lomond Park (1), Lakeview Park (2), Lamar Park (3), Kiwanis Park (4), Jaycee Park (5), Jefferson Park (6), Hursh Park (7), Southern Hills Park (8), Rotary Park (9). Display/hide their locations on the map
Tourist attractions: A Visit with Mark Twain (Cultural Attractions- Events- & Facilities; 3515 Grant Street) (1), Castaway Cove Waterpark (Water Parks & Slides; 1000 Central Freeway East) (2), River Bend Nature Center (Nature Centers; 2200 3rd Street) (3), Cc's Gameroom (Amusement & Theme Parks; 1210 North Rosewood Avenue) (4), Field of Honor Paintball Games (2317 Hampton Road) (5). Display/hide their approximate locations on the map
Hotels: Circle Inn (3153 5th Street) (1), Best Western Wichita Falls Inn (1032 Central Freeway) (2), Catalina Motel & Coffee Shop (1108 East Scott Avenue) (3), Budget Inn Motel (914 East Scott Avenue) (4), Best Western Northtown Inn (1317 Kenley Avenue) (5), Best Western Towne Crest Inn (1601 8th St) (6). Display/hide their approximate locations on the map
Courts: Wichita Appraisal District (600 Scott Avenue) (1), United States Government - Pretrial Services Agency- Judicial Branch-United States Co (Federal Building) (2), United States Government - Judicial Branch-United States Courts- Interior Depart (Federal Building) (3), United States Government - Federal Bureau Of Investigation (2301 Kell Boulevard) (4). Display/hide their approximate locations on the map
Birthplace of: Greyson Chance - Singer-pianist, Greg Abbott - Texas Attorney General, Frank Kell Cahoon - Member of the Texas House of Representatives, Larry McMurtry - (1936-), novelist, Ray Farabee - Politician, Tommy Tune - Choreographer, Aaron Taylor (American football, born 1975) - College football player, Bert Clark - Player of and football, Clint Longley - Football player, John Barron (journalist) - Political writer.
Drinking water stations with addresses in Wichita Falls and their reported violations in the past:
CHARLIE WSC (Population served: 117, Purch surface water):Past monitoring violations:
- Monitoring, Source Water (GWR) - In JAN-01-2011, Contaminant: E. COLI. Follow-up actions: St Public Notif requested (MAR-02-2011), St Violation/Reminder Notice (MAR-02-2011), St Public Notif received (JUL-15-2011)
- Monitoring, Source Water (GWR) - In DEC-01-2010, Contaminant: E. COLI. Follow-up actions: St Public Notif requested (FEB-10-2011), St Violation/Reminder Notice (FEB-10-2011), St Public Notif received (MAR-16-2011)
Drinking water stations with addresses in Wichita Falls that have no violations reported:
- ARCHER COUNTY MUD 1 (Population served: 1,028, Primary Water Source Type: Purch surface water)
- RRA DONLEY COUNTY REST AREAS (Population served: 400, Primary Water Source Type: Purch surface water)
| This city: | 2.4 people |
| Texas: | 2.8 people |
| This city: | 62.3% |
| Whole state: | 69.9% |
| This city: | 6.4% |
| Whole state: | 6.0% |
Likely homosexual households (counted as self-reported same-sex unmarried-partner households)
- Lesbian couples: 0.3% of all households
- Gay men: 0.2% of all households
People in group quarters in Wichita Falls in 2010:
- 5,487 people in military barracks and dormitories (nondisciplinary)
- 3,627 people in state prisons
- 1,072 people in nursing facilities/skilled-nursing facilities
- 802 people in college/university student housing
- 553 people in local jails and other municipal confinement facilities
- 125 people in group homes intended for adults
- 97 people in other noninstitutional facilities
- 32 people in hospitals with patients who have no usual home elsewhere
- 25 people in group homes for juveniles (non-correctional)
- 25 people in emergency and transitional shelters (with sleeping facilities) for people experiencing homelessness
- 18 people in residential treatment centers for adults
- 14 people in correctional facilities intended for juveniles
- 11 people in in-patient hospice facilities
People in group quarters in Wichita Falls in 2000:
- 4,652 people in military barracks, etc.
- 3,654 people in state prisons
- 765 people in nursing homes
- 653 people in college dormitories (includes college quarters off campus)
- 493 people in local jails and other confinement facilities (including police lockups)
- 249 people in mental (psychiatric) hospitals or wards
- 105 people in homes for the mentally retarded
- 75 people in other group homes
- 69 people in hospitals/wards and hospices for chronically ill
- 69 people in hospices or homes for chronically ill
- 55 people in other noninstitutional group quarters
- 44 people in military transient quarters for temporary residents
- 42 people in homes for the mentally ill
- 37 people in homes or halfway houses for drug/alcohol abuse
- 31 people in schools, hospitals, or wards for the intellectually disabled
- 15 people in other nonhousehold living situations
- 12 people in short-term care, detention or diagnostic centers for delinquent children
Banks with most branches in Wichita Falls (2011 data):
- Wells Fargo Bank, National Association: Wichita Falls Fairway Branch, Jacksboro Highway Branch, Kell Branch, Wichita Falls Downtown Branch, Southwest Branch. Info updated 2011/04/05: Bank assets: $1,161,490.0 mil, Deposits: $905,653.0 mil, headquarters in Sioux Falls, SD, positive income, 6395 total offices, Holding Company: Wells Fargo & Company
- JPMorgan Chase Bank, National Association: Scott Street Drive-Up Branch, Elliot Street Drive-Up Branch, Wichita Falls Main Branch, Southwest Tower Branch. Info updated 2011/11/10: Bank assets: $1,811,678.0 mil, Deposits: $1,190,738.0 mil, headquarters in Columbus, OH, positive income, International Specialization, 5577 total offices, Holding Company: Jpmorgan Chase & Co.
- Citibank, National Association: 3710 Fairway Boulevard Branch, Elmwood Avenue Drive-Thru, Wichita Falls Branch. Info updated 2012/01/10: Bank assets: $1,288,658.0 mil, Deposits: $882,541.0 mil, headquarters in Sioux Falls, SD, positive income, International Specialization, 1048 total offices, Holding Company: Citigroup Inc.
- American National Bank: Downtown Wichita Falls Branch, Elmwood Branch, at 2732a Midwestern Parkway. Info updated 2007/09/14: Bank assets: $467.3 mil, Deposits: $400.6 mil, local headquarters, positive income, Commercial Lending Specialization, 6 total offices, Holding Company: Ameribancshares, Inc.
- First National Bank Texas: Greenbriar Banking Center - Rc 827, Wichita Falls Central Bkg Center - R, Wichita Falls Lawrence Bkg Center -. Info updated 2006/11/03: Bank assets: $944.3 mil, Deposits: $815.9 mil, headquarters in Killeen, TX, positive income, Mortgage Lending Specialization, 250 total offices, Holding Company: First Community Bancshares, Inc.
- First Bank: Midwestern Branch, Wichita Falls Branch, Wichita Falls - Downtown Branch. Info updated 2009/08/03: Bank assets: $254.0 mil, Deposits: $209.1 mil, headquarters in Burkburnett, TX, positive income, Commercial Lending Specialization, 5 total offices, Holding Company: First Burkburnett Bancshares, Inc.
- Fidelity Bank: at 2525 Kell Boulevard, Suite 100, branch established on 2003/09/09; Wichita Falls Downtown Branch at 909 8th Street, Suite 101, branch established on 2006/09/27. Info updated 2006/11/03: Bank assets: $248.1 mil, Deposits: $225.2 mil, local headquarters, positive income, Commercial Lending Specialization, 3 total offices, Holding Company: Fb Bancshares, Inc.
- State National Bank of Texas: Wichita Falls Branch at 2618 Iowa Park Road, branch established on 1994/07/05; Jacksboro Highway Branch at 4301 Jacksboro Highway, branch established on 1999/10/21. Info updated 2007/05/08: Bank assets: $207.1 mil, Deposits: $186.6 mil, headquarters in Iowa Park, TX, positive income, 8 total offices, Holding Company: North Central Texas Bancshares, Inc.
- Bank of America, National Association: Wichita Falls Main Bnking Ctr Branch at 2733 Midwestern Parkway, branch established on 1995/07/31; Wichita Falls Motor Branch at 810 Lamar Street, branch established on 1992/06/30. Info updated 2009/11/18: Bank assets: $1,451,969.3 mil, Deposits: $1,077,176.8 mil, headquarters in Charlotte, NC, positive income, 5782 total offices, Holding Company: Bank Of America Corporation
- 5 other banks with 6 local branches
For population 15 years and over in Wichita Falls:
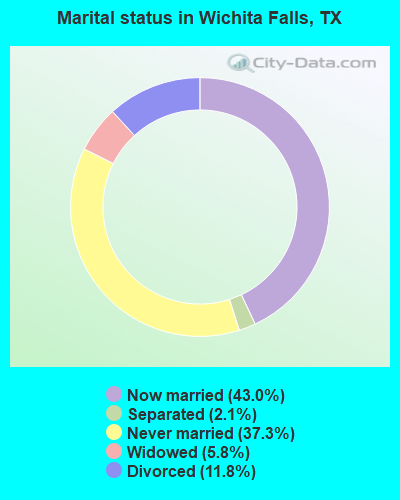
- Never married: 37.3%
- Now married: 43.0%
- Separated: 2.1%
- Widowed: 5.8%
- Divorced: 11.8%
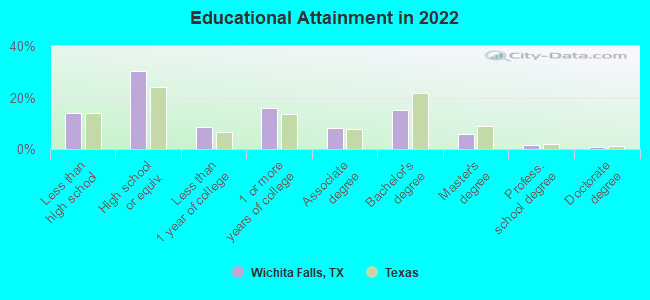
For population 25 years and over in Wichita Falls:
- High school or higher: 86.1%
- Bachelor's degree or higher: 23.5%
- Graduate or professional degree: 8.2%
- Unemployed: 6.5%
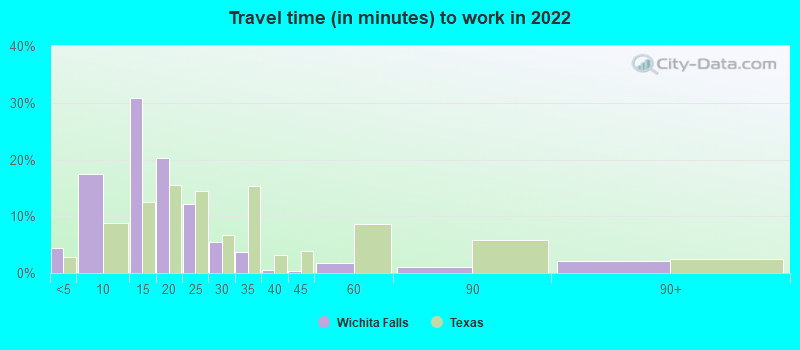
- Mean travel time to work (commute): 14.6 minutes
| Here: | 13.5 |
| Texas average: | 14.0 |
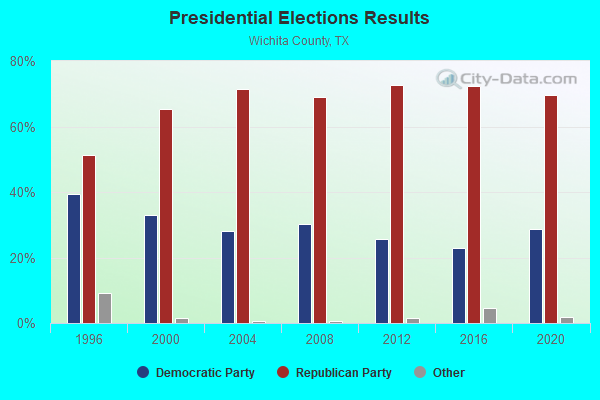
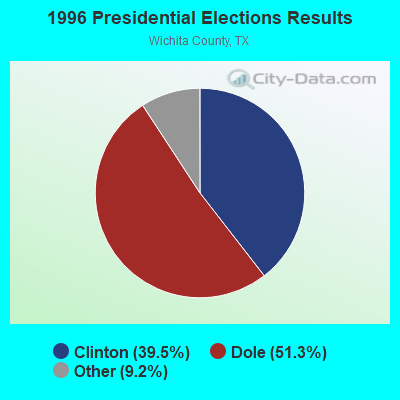
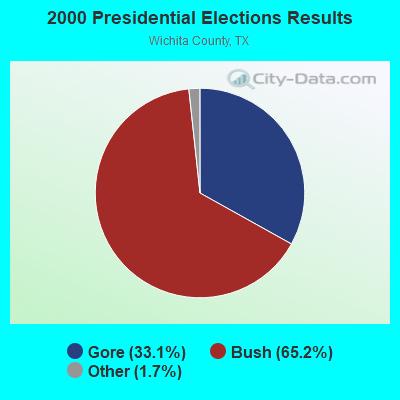

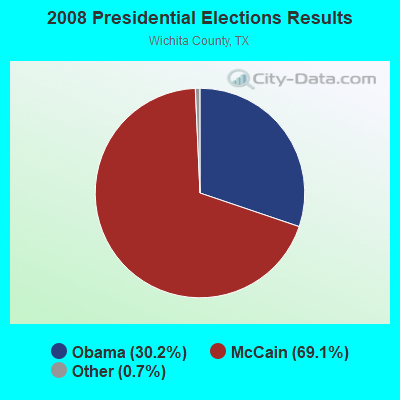
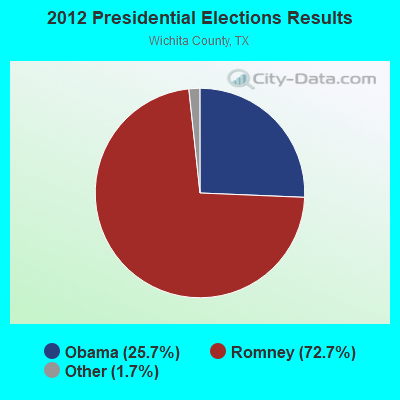
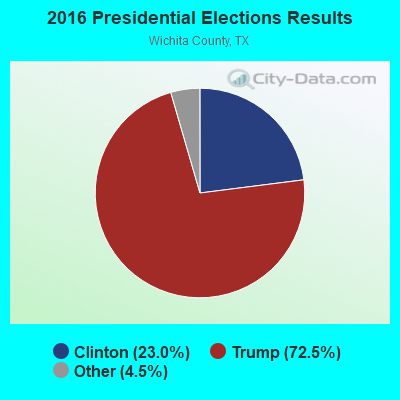

Graphs represent county-level data. Detailed 2008 Election Results
Religion statistics for Wichita Falls, TX (based on Wichita County data)
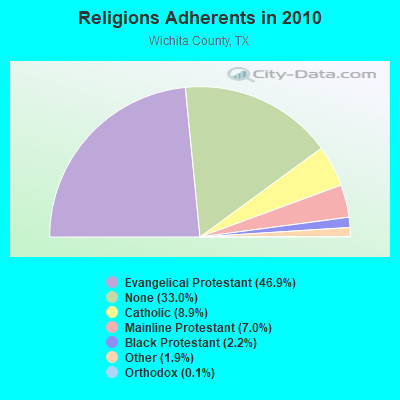
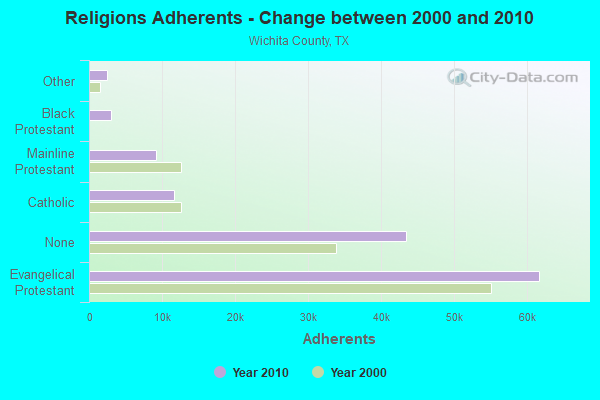
| Religion | Adherents | Congregations |
|---|---|---|
| Evangelical Protestant | 61,669 | 154 |
| Catholic | 11,699 | 7 |
| Mainline Protestant | 9,205 | 27 |
| Black Protestant | 2,957 | 13 |
| Other | 2,472 | 8 |
| Orthodox | 144 | 2 |
| None | 43,354 | - |
Food Environment Statistics:
| This county: | 1.17 / 10,000 pop. |
| Texas: | 1.47 / 10,000 pop. |
| Here: | 0.23 / 10,000 pop. |
| Texas: | 0.14 / 10,000 pop. |
| This county: | 0.86 / 10,000 pop. |
| State: | 1.11 / 10,000 pop. |
| This county: | 3.75 / 10,000 pop. |
| State: | 3.95 / 10,000 pop. |
| This county: | 7.04 / 10,000 pop. |
| Texas: | 6.13 / 10,000 pop. |
| Wichita County: | 10.2% |
| Texas: | 8.9% |
| This county: | 26.4% |
| State: | 26.6% |
| Here: | 14.8% |
| State: | 15.7% |
Health and Nutrition:
| Wichita Falls: | 47.8% |
| Texas: | 48.6% |
| Here: | 44.9% |
| Texas: | 47.4% |
| This city: | 28.7 |
| Texas: | 28.5 |
| Wichita Falls: | 20.9% |
| State: | 20.6% |
| This city: | 11.1% |
| Texas: | 10.3% |
| Wichita Falls: | 6.8 |
| Texas: | 6.8 |
| Here: | 32.2% |
| State: | 33.1% |
| Wichita Falls: | 55.2% |
| Texas: | 56.2% |
| Wichita Falls: | 79.4% |
| State: | 80.7% |
More about Health and Nutrition of Wichita Falls, TX Residents
| Local government employment and payroll (March 2022) | |||||
| Function | Full-time employees | Monthly full-time payroll | Average yearly full-time wage | Part-time employees | Monthly part-time payroll |
|---|---|---|---|---|---|
| Police Protection - Officers | 192 | $1,402,502 | $87,656 | 0 | $0 |
| Firefighters | 160 | $1,063,684 | $79,776 | 0 | $0 |
| Streets and Highways | 94 | $363,297 | $46,378 | 15 | $14,860 |
| Other and Unallocable | 91 | $319,978 | $42,195 | 0 | $0 |
| Health | 89 | $350,191 | $47,217 | 5 | $2,783 |
| Parks and Recreation | 87 | $296,113 | $40,843 | 37 | $31,763 |
| Water Supply | 83 | $317,588 | $45,916 | 0 | $0 |
| Police - Other | 79 | $282,465 | $42,906 | 7 | $5,256 |
| Solid Waste Management | 78 | $274,864 | $42,287 | 0 | $0 |
| Sewerage | 61 | $215,842 | $42,461 | 1 | $1,907 |
| Transit | 26 | $99,931 | $46,122 | 8 | $6,737 |
| Financial Administration | 26 | $133,613 | $61,668 | 0 | $0 |
| Other Government Administration | 21 | $141,969 | $81,125 | 0 | $0 |
| Judicial and Legal | 17 | $94,722 | $66,863 | 8 | $10,631 |
| Local Libraries | 15 | $54,229 | $43,383 | 0 | $0 |
| Housing and Community Development (Local) | 10 | $34,325 | $41,190 | 0 | $0 |
| Airports | 9 | $32,323 | $43,097 | 5 | $4,972 |
| Fire - Other | 2 | $6,267 | $37,602 | 0 | $0 |
| Totals for Government | 1,140 | $5,483,905 | $57,725 | 86 | $78,908 |
Wichita Falls government finances - Expenditure in 2021 (per resident):
- Construction - Water Utilities: $7,077,000 ($68.93)
Regular Highways: $3,119,000 ($30.38)
Sewerage: $2,183,000 ($21.26)
General - Other: $493,000 ($4.80)
- Current Operations - Police Protection: $27,070,000 ($263.68)
Water Utilities: $26,612,000 ($259.21)
General - Other: $19,798,000 ($192.84)
Local Fire Protection: $18,365,000 ($178.88)
Solid Waste Management: $13,773,000 ($134.16)
Parks and Recreation: $8,113,000 ($79.02)
Regular Highways: $7,460,000 ($72.66)
Health - Other: $6,094,000 ($59.36)
Housing and Community Development: $5,524,000 ($53.81)
Sewerage: $5,422,000 ($52.81)
Financial Administration: $3,522,000 ($34.31)
Central Staff Services: $3,249,000 ($31.65)
General Public Buildings: $2,671,000 ($26.02)
Transit Utilities: $2,600,000 ($25.33)
Judicial and Legal Services: $1,825,000 ($17.78)
Air Transportation: $1,700,000 ($16.56)
Libraries: $1,365,000 ($13.30)
Protective Inspection and Regulation - Other: $1,365,000 ($13.30)
- General - Interest on Debt: $1,544,000 ($15.04)
- Other Capital Outlay - General - Other: $4,329,000 ($42.17)
Solid Waste Management: $1,157,000 ($11.27)
Regular Highways: $886,000 ($8.63)
Sewerage: $638,000 ($6.21)
Water Utilities: $530,000 ($5.16)
Financial Administration: $185,000 ($1.80)
Health - Other: $37,000 ($0.36)
Parks and Recreation: $16,000 ($0.16)
Central Staff Services: $7,000 ($0.07)
Housing and Community Development: $3,000 ($0.03)
Judicial and Legal Services: $2,000 ($0.02)
- Total Salaries and Wages: $67,355,000 ($656.07)
- Water Utilities - Interest on Debt: $2,907,000 ($28.32)
Wichita Falls government finances - Revenue in 2021 (per resident):
- Charges - Solid Waste Management: $14,329,000 ($139.57)
Sewerage: $3,898,000 ($37.97)
Other: $3,313,000 ($32.27)
Parks and Recreation: $2,705,000 ($26.35)
Air Transportation: $2,200,000 ($21.43)
- Federal Intergovernmental - Housing and Community Development: $7,365,000 ($71.74)
Air Transportation: $4,104,000 ($39.98)
Transit Utilities: $1,873,000 ($18.24)
Other: $46,000 ($0.45)
- Miscellaneous - General Revenue - Other: $10,872,000 ($105.90)
Fines and Forfeits: $3,005,000 ($29.27)
Interest Earnings: $1,434,000 ($13.97)
Rents: $517,000 ($5.04)
Donations From Private Sources: $172,000 ($1.68)
Sale of Property: $53,000 ($0.52)
- Revenue - Water Utilities: $47,722,000 ($464.84)
Transit Utilities: $445,000 ($4.33)
- State Intergovernmental - Health and Hospitals: $2,075,000 ($20.21)
Other: $886,000 ($8.63)
Transit Utilities: $745,000 ($7.26)
General Local Government Support: $577,000 ($5.62)
Highways: $207,000 ($2.02)
- Tax - Property: $39,354,000 ($383.33)
General Sales and Gross Receipts: $26,199,000 ($255.19)
Public Utilities Sales: $7,378,000 ($71.87)
Other Selective Sales: $2,143,000 ($20.87)
Occupation and Business License - Other: $1,147,000 ($11.17)
Other License: $165,000 ($1.61)
Wichita Falls government finances - Debt in 2021 (per resident):
- Long Term Debt - Beginning Outstanding - Unspecified Public Purpose: $156,881,000 ($1528.10)
Outstanding Unspecified Public Purpose: $136,573,000 ($1330.29)
Retired Unspecified Public Purpose: $20,308,000 ($197.81)
Wichita Falls government finances - Cash and Securities in 2021 (per resident):
- Bond Funds - Cash and Securities: $19,770,000 ($192.57)
- Other Funds - Cash and Securities: $95,567,000 ($930.87)
- Sinking Funds - Cash and Securities: $14,330,000 ($139.58)
7.93% of this county's 2021 resident taxpayers lived in other counties in 2020 ($51,896 average adjusted gross income)
| Here: | 7.93% |
| Texas average: | 8.12% |
0.12% of residents moved from foreign countries ($1,403 average AGI)
Wichita County: 0.12% Texas average: 0.04%
Top counties from which taxpayers relocated into this county between 2020 and 2021:
| from Tarrant County, TX | |
| from Dallas County, TX | |
| from Archer County, TX |
7.97% of this county's 2020 resident taxpayers moved to other counties in 2021 ($47,184 average adjusted gross income)
| Here: | 7.97% |
| Texas average: | 7.40% |
0.18% of residents moved to foreign countries ($911 average AGI)
Wichita County: 0.18% Texas average: 0.03%
Top counties to which taxpayers relocated from this county between 2020 and 2021:
| to Tarrant County, TX | |
| to Archer County, TX | |
| to Clay County, TX |
| Businesses in Wichita Falls, TX | ||||
| Name | Count | Name | Count | |
|---|---|---|---|---|
| 7-Eleven | 10 | Lane Furniture | 3 | |
| AT&T | 2 | Little Caesars Pizza | 2 | |
| Academy Sports + Outdoors | 1 | Long John Silver's | 2 | |
| Advance Auto Parts | 1 | Lowe's | 1 | |
| Aeropostale | 1 | Marriott | 1 | |
| Albertsons | 1 | MasterBrand Cabinets | 6 | |
| American Eagle Outfitters | 1 | Maurices | 2 | |
| Applebee's | 1 | Mazda | 1 | |
| Arby's | 2 | McDonald's | 6 | |
| Ashley Furniture | 1 | Men's Wearhouse | 1 | |
| AutoZone | 2 | Motel 6 | 2 | |
| BMW | 1 | Motherhood Maternity | 1 | |
| Bath & Body Works | 1 | New Balance | 1 | |
| Baymont Inn | 1 | Nike | 3 | |
| Bed Bath & Beyond | 1 | Nissan | 1 | |
| Best Western | 1 | Office Depot | 1 | |
| Blockbuster | 1 | Old Navy | 1 | |
| Budget Car Rental | 1 | Olive Garden | 1 | |
| Burger King | 2 | On The Border | 1 | |
| CVS | 2 | Pac Sun | 1 | |
| Carl\s Jr. | 2 | Papa John's Pizza | 2 | |
| Catherines | 1 | Payless | 1 | |
| Chevrolet | 1 | Penske | 2 | |
| Chuck E. Cheese's | 1 | PetSmart | 1 | |
| Church's Chicken | 2 | Pier 1 Imports | 1 | |
| Cinnabon | 1 | Pizza Hut | 4 | |
| ColorTyme | 1 | Popeyes | 2 | |
| Cracker Barrel | 1 | Qdoba Mexican Grill | 1 | |
| Curves | 1 | Quality | 1 | |
| Dairy Queen | 1 | Quiznos | 3 | |
| Days Inn | 1 | RadioShack | 2 | |
| Deb | 1 | Ramada | 1 | |
| Dennys | 2 | Red Lobster | 1 | |
| Discount Tire | 1 | Red Roof Inn | 1 | |
| Domino's Pizza | 1 | Rue21 | 1 | |
| Dressbarn | 1 | SONIC Drive-In | 10 | |
| Econo Lodge | 1 | Sam's Club | 1 | |
| FedEx | 15 | Sears | 2 | |
| Finish Line | 1 | Shoe Carnival | 1 | |
| Foot Locker | 1 | Spencer Gifts | 1 | |
| Ford | 1 | Sprint Nextel | 1 | |
| GNC | 1 | Starbucks | 2 | |
| GameStop | 3 | Subway | 11 | |
| Goodwill | 8 | Super 8 | 1 | |
| H&R Block | 6 | T-Mobile | 4 | |
| Hilton | 1 | T.J.Maxx | 1 | |
| Hobby Lobby | 1 | Taco Bell | 4 | |
| Holiday Inn | 3 | Target | 1 | |
| Hollister Co. | 1 | Toyota | 1 | |
| Home Depot | 1 | Toys"R"Us | 1 | |
| Honda | 1 | Travelodge | 1 | |
| Hot Topic | 1 | True Value | 1 | |
| Howard Johnson | 1 | U-Haul | 6 | |
| IHOP | 1 | U.S. Cellular | 5 | |
| JCPenney | 1 | UPS | 21 | |
| JoS. A. Bank | 1 | Vans | 3 | |
| Jones New York | 1 | Verizon Wireless | 1 | |
| Journeys | 1 | Victoria's Secret | 1 | |
| Justice | 1 | Volkswagen | 1 | |
| KFC | 2 | Walgreens | 3 | |
| Kohl's | 1 | Walmart | 3 | |
| La Quinta | 1 | Wendy's | 2 | |
| La-Z-Boy | 2 | YMCA | 5 | |
| Lane Bryant | 1 | |||
Strongest AM radio stations in Wichita Falls:
- KCAF (990 AM; 10 kW; FARMERSVILLE, TX; Owner: RENAISSANCE RADIO, INC.)
- KWFS (1290 AM; 5 kW; WICHITA FALLS, TX; Owner: CCB TEXAS LICENSES, L.P.)
- WBAP (820 AM; 50 kW; FORT WORTH, TX; Owner: WBAP-KSCS OPERATING, LTD.)
- KAHZ (1360 AM; 50 kW; HURST, TX)
- KESS (1270 AM; 50 kW; FORT WORTH, TX; Owner: KESS-AM LICENSE CORP.)
- KRLD (1080 AM; 50 kW; DALLAS, TX; Owner: TEXAS INFINITY BROADCASTING L.P.)
- KOMA (1520 AM; 50 kW; OKLAHOMA CITY, OK; Owner: RENDA BROADCASTING CORP. OF NEVADA)
- KZMP (1540 AM; 50 kW; UNIVERSITY PARK, TX; Owner: ENTRAVISION HOLDINGS, LLC)
- KFXR (1190 AM; 50 kW; DALLAS, TX; Owner: CLEAR CHANNEL BROADCASTING LICENSES, INC.)
- KRMG (740 AM; 50 kW; TULSA, OK; Owner: CXR HOLDINGS, INC.)
- KSKY (660 AM; 20 kW; BALCH SPRINGS, TX; Owner: BISON MEDIA, INC.)
- KBIS (1150 AM; 25 kW; HIGHLAND PARK, TX; Owner: DALLAS AM RADIO PARTNERS, L.P.)
- KHVN (970 AM; 10 kW; FORT WORTH, TX; Owner: MORTENSON BROADCASTING COMPANY)
Strongest FM radio stations in Wichita Falls:
- KWFS-FM (102.3 FM; WICHITA FALLS, TX; Owner: CCB TEXAS LICENSES, L.P.)
- KLUR (99.9 FM; WICHITA FALLS, TX; Owner: CUMULUS LICENSING CORP.)
- KQXC-FM (103.9 FM; WICHITA FALLS, TX; Owner: CUMULUS LICENSING CORP.)
- KMOC (89.5 FM; WICHITA FALLS, TX; Owner: CHRISTIAN SERVICE FOUNDATION, INC.)
- KTEO (90.5 FM; WICHITA FALLS, TX; Owner: CORNERSTONE UNIVERSITY)
- KBZS (106.3 FM; WICHITA FALLS, TX; Owner: CCB TEXAS LICENSES, L.P.)
- K202DR (88.3 FM; WICHITA FALLS, TX; Owner: NORTH TEXAS PUBLIC BROADCASTING, INC)
- KMCU (88.7 FM; WICHITA FALLS, TX; Owner: CAMERON UNIVERSITY)
- K211ED (90.1 FM; WICHITA FALLS, TX; Owner: EDUCATIONAL MEDIA FOUNDATION)
- KNIN-FM (92.9 FM; WICHITA FALLS, TX; Owner: CCB TEXAS LICENSES, L.P.)
- KYYI (104.7 FM; BURKBURNETT, TX; Owner: CUMULUS LICENSING CORP.)
- KWRD-FM (100.7 FM; HIGHLAND VILLAGE, TX; Owner: INSPIRATION MEDIA OF TEXAS, L.L.C.)
- KOLI (94.9 FM; ELECTRA, TX; Owner: CUMULUS LICENSING CORP.)
TV broadcast stations around Wichita Falls:
- KAUZ-TV (Channel 6; WICHITA FALLS, TX; Owner: CHELSEY BROADCASTING COMPANY OF WICHITA FALLS, LLC)
- KFDX-TV (Channel 3; WICHITA FALLS, TX; Owner: NEXSTAR BROADCASTING OF WICHITA FALLS, L.L.C.)
- K24AD (Channel 24; WICHITA FALLS, TX; Owner: NORTH TEXAS PUBLIC BROADCASTING, INC.)
- K20DN (Channel 20; WICHITA FALLS, TX; Owner: CHRISTIAN FAMILY NETWORK TV, INC.)
- K26DL (Channel 26; WICHITA FALLS, TX; Owner: NATIONAL MINORITY T.V., INC.)
- KJBO-LP (Channel 35; WICHITA FALLS, TX; Owner: MISSION BROADCASTING, INC.)
- K22FE (Channel 22; WICHITA FALLS, TX; Owner: LOCKE SUPPLY CO.)
- K30DJ (Channel 30; WICHITA FALLS, TX; Owner: CHRISTIAN FAMILY NETWORK, INC.)
- KSWO-TV (Channel 7; LAWTON, OK; Owner: KSWO TELEVISION COMPANY, INC.)
- KJTL (Channel 18; WICHITA FALLS, TX; Owner: MISSION BROADCASTING, INC.)
- K47DK (Channel 47; GRANDFIELD, OK; Owner: MISSION BROADCASTING, INC.)
Medal of Honor Recipients
Medal of Honor Recipients born in Wichita Falls: Neel E. Kearby, Thomas W. Fowler.
- National Bridge Inventory (NBI) Statistics
- 364Number of bridges
- 6,401ft / 1,951mTotal length
- $12,304,000Total costs
- 3,596,831Total average daily traffic
- 427,747Total average daily truck traffic
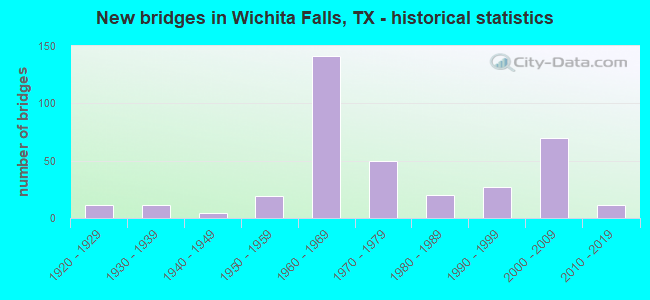
- New bridges - historical statistics
- 111920-1929
- 111930-1939
- 41940-1949
- 191950-1959
- 1411960-1969
- 501970-1979
- 201980-1989
- 271990-1999
- 702000-2009
- 112010-2019
FCC Registered Antenna Towers: 559 (See the full list of FCC Registered Antenna Towers)
FCC Registered Commercial Land Mobile Towers: 8 (See the full list of FCC Registered Commercial Land Mobile Towers in Wichita Falls, TX)
FCC Registered Private Land Mobile Towers: 15 (See the full list of FCC Registered Private Land Mobile Towers)
FCC Registered Broadcast Land Mobile Towers: 102 (See the full list of FCC Registered Broadcast Land Mobile Towers)
FCC Registered Microwave Towers: 276 (See the full list of FCC Registered Microwave Towers in this town)
FCC Registered Paging Towers: 19 (See the full list of FCC Registered Paging Towers)
FCC Registered Maritime Coast & Aviation Ground Towers: 13 (See the full list of FCC Registered Maritime Coast & Aviation Ground Towers)
FCC Registered Amateur Radio Licenses: 661 (See the full list of FCC Registered Amateur Radio Licenses in Wichita Falls)
FAA Registered Aircraft Manufacturers and Dealers: 10 (See the full list of FAA Registered Manufacturers and Dealers in Wichita Falls)
FAA Registered Aircraft: 203 (See the full list of FAA Registered Aircraft)
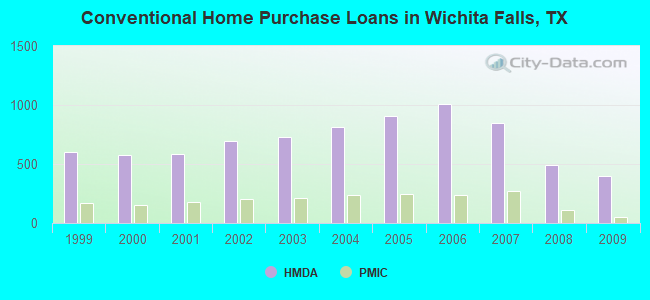
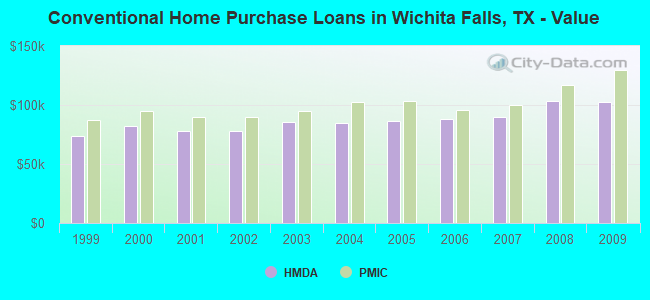
| Home Mortgage Disclosure Act Aggregated Statistics For Year 2009 (Based on 17 full and 12 partial tracts) | ||||||||||||||
| A) FHA, FSA/RHS & VA Home Purchase Loans | B) Conventional Home Purchase Loans | C) Refinancings | D) Home Improvement Loans | E) Loans on Dwellings For 5+ Families | F) Non-occupant Loans on < 5 Family Dwellings (A B C & D) | G) Loans On Manufactured Home Dwelling (A B C & D) | ||||||||
|---|---|---|---|---|---|---|---|---|---|---|---|---|---|---|
| Number | Average Value | Number | Average Value | Number | Average Value | Number | Average Value | Number | Average Value | Number | Average Value | Number | Average Value | |
| LOANS ORIGINATED | 435 | $111,565 | 401 | $102,401 | 641 | $122,615 | 79 | $42,450 | 2 | $213,020 | 215 | $63,326 | 3 | $61,220 |
| APPLICATIONS APPROVED, NOT ACCEPTED | 18 | $125,895 | 24 | $107,777 | 44 | $117,449 | 12 | $19,705 | 0 | $0 | 6 | $91,652 | 4 | $59,032 |
| APPLICATIONS DENIED | 26 | $103,415 | 50 | $82,353 | 154 | $101,603 | 87 | $18,974 | 1 | $6,320,760 | 18 | $59,700 | 3 | $48,610 |
| APPLICATIONS WITHDRAWN | 29 | $126,557 | 15 | $84,931 | 103 | $105,510 | 11 | $18,615 | 0 | $0 | 9 | $69,366 | 2 | $36,085 |
| FILES CLOSED FOR INCOMPLETENESS | 8 | $103,459 | 2 | $67,345 | 17 | $94,798 | 5 | $31,856 | 0 | $0 | 2 | $74,000 | 3 | $41,147 |
Detailed mortgage data for all 30 tracts in Wichita Falls, TX
| Private Mortgage Insurance Companies Aggregated Statistics For Year 2009 (Based on 11 full and 9 partial tracts) | ||||||
| A) Conventional Home Purchase Loans | B) Refinancings | C) Non-occupant Loans on < 5 Family Dwellings (A & B) | ||||
|---|---|---|---|---|---|---|
| Number | Average Value | Number | Average Value | Number | Average Value | |
| LOANS ORIGINATED | 52 | $130,041 | 36 | $160,215 | 2 | $29,500 |
| APPLICATIONS APPROVED, NOT ACCEPTED | 5 | $159,308 | 3 | $113,333 | 0 | $0 |
| APPLICATIONS DENIED | 4 | $132,232 | 2 | $142,680 | 0 | $0 |
| APPLICATIONS WITHDRAWN | 2 | $150,195 | 2 | $82,835 | 0 | $0 |
| FILES CLOSED FOR INCOMPLETENESS | 0 | $0 | 0 | $0 | 0 | $0 |
2002 - 2018 National Fire Incident Reporting System (NFIRS) incidents
- Fire incident types reported to NFIRS in Wichita Falls, TX
- 4,92054.9%Outside Fires
- 2,88732.2%Structure Fires
- 1,02411.4%Mobile Property/Vehicle Fires
- 1381.5%Other
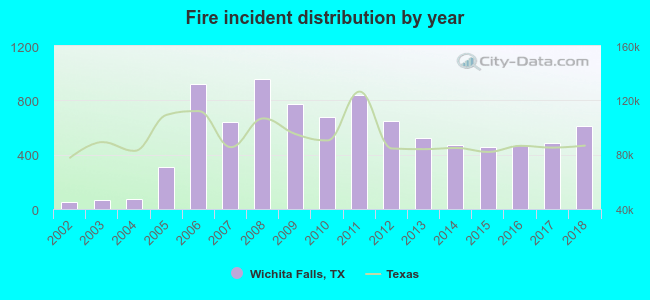 Based on the data from the years 2002 - 2018 the average number of fire incidents per year is 528. The highest number of fire incidents - 954 took place in 2008, and the least - 53 in 2002. The data has a rising trend.
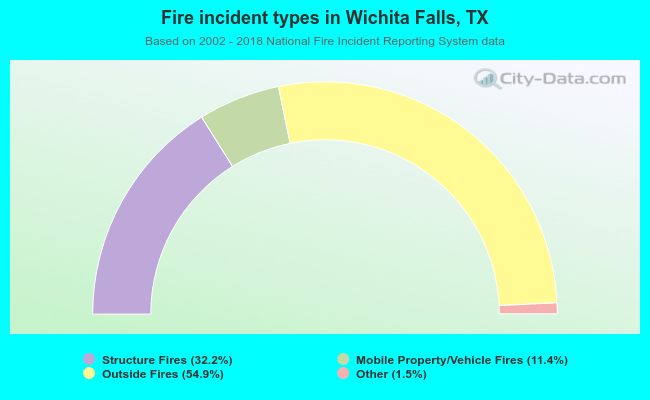 When looking into fire subcategories, the most incidents belonged to: Outside Fires (54.9%), and Structure Fires (32.2%).
Fire-safe hotels and motels in Wichita Falls, Texas:
- Hotel At Wichita Falls, 100 Central Fwy, Wichita Falls, Texas 76306 , Phone: (940) 761-6000, Fax: (940) 766-1730
- Best Western Towne Crest Inn, 1601 8TH St, Wichita Falls, Texas 76301 , Phone: (940) 322-1182, Fax: (940) 322-3457
- Americas Best Value Inn, 1812 Maurine St, Wichita Falls, Texas 76304 , Phone: (940) 322-8817, Fax: (940) 322-5944
- Red Roof Inn, 1032 Central Fwy, Wichita Falls, Texas 76306 , Phone: (940) 766-6881, Fax: (940) 723-2957
- Howard Johnson Plaza, 401 Broad St, Wichita Falls, Texas 76301 , Phone: (940) 766-6000, Fax: (940) 766-5942
- Travelodge, 1015 Wolcott Ln, Wichita Falls, Texas 76305 , Phone: (940) 761-3400, Fax: (940) 761-1979
- Comfort Inn, 1317 Kenley Ave, Wichita Falls, Texas 76306 , Phone: (940) 766-3300, Fax: (940) 723-8226
- Mainstay Suites, 1917 Elmwood Ave N, Wichita Falls, Texas 76308 , Phone: (940) 692-7900, Fax: (940) 692-3530
- 16 other hotels and motels
| Most common first names in Wichita Falls, TX among deceased individuals | ||
| Name | Count | Lived (average) |
|---|---|---|
| Mary | 666 | 78.4 years |
| James | 616 | 72.2 years |
| John | 575 | 75.0 years |
| William | 520 | 75.3 years |
| Robert | 429 | 71.0 years |
| Charles | 296 | 72.8 years |
| George | 253 | 75.3 years |
| Ruth | 222 | 79.1 years |
| Dorothy | 215 | 76.9 years |
| Willie | 205 | 75.8 years |
| Most common last names in Wichita Falls, TX among deceased individuals | ||
| Last name | Count | Lived (average) |
|---|---|---|
| Smith | 350 | 74.7 years |
| Williams | 271 | 74.4 years |
| Brown | 238 | 75.4 years |
| Jones | 236 | 75.0 years |
| Davis | 232 | 74.8 years |
| Johnson | 212 | 75.4 years |
| Wilson | 155 | 76.1 years |
| Taylor | 151 | 73.7 years |
| Moore | 138 | 75.2 years |
| White | 125 | 76.1 years |
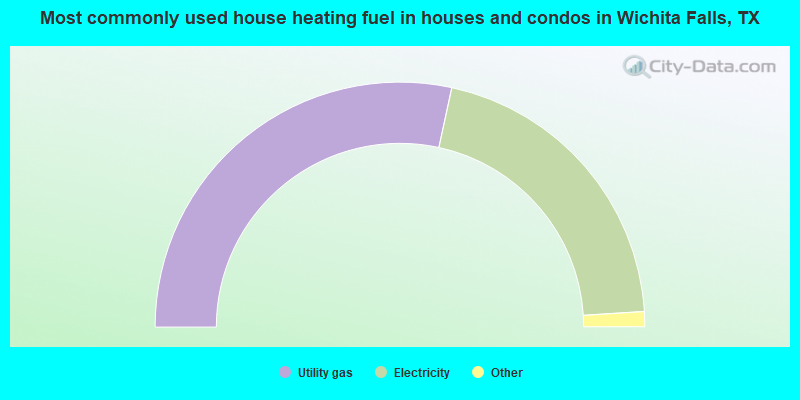
- 56.8%Utility gas
- 41.2%Electricity
- 1.3%Bottled, tank, or LP gas
- 0.3%No fuel used
- 0.1%Other fuel
- 0.1%Wood
- 0.1%Fuel oil, kerosene, etc.
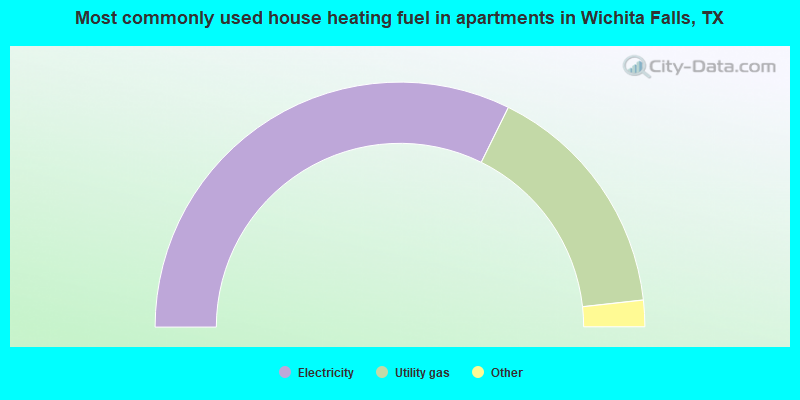
- 64.6%Electricity
- 31.9%Utility gas
- 2.4%Bottled, tank, or LP gas
- 0.7%No fuel used
- 0.2%Other fuel
- 0.1%Solar energy
Wichita Falls compared to Texas state average:
- Median house value below state average.
- Unemployed percentage below state average.
- Hispanic race population percentage below state average.
- Foreign-born population percentage significantly below state average.
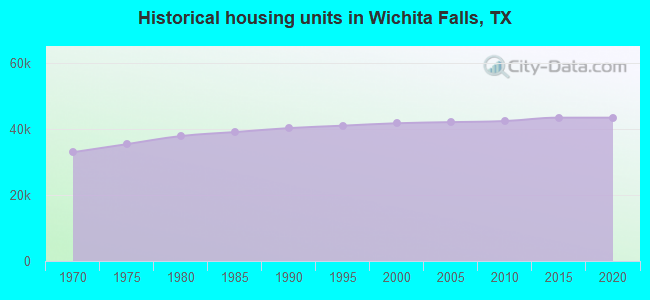
- House age above state average.
- Institutionalized population percentage above state average.
Wichita Falls on our top lists:
- #2 on the list of "Top 101 cities with largest percentage of females in occupations: health technologists and technicians (population 50,000+)"
- #3 on the list of "Top 100 cities with shortest commuting times (pop. 50,000+)"
- #11 on the list of "Top 101 cities with largest percentage of workers with very short commute times (9 minutes or less) (population 50,000+)"
- #14 on the list of "Top 100 cities with the largest percentage of males (pop. 50,000+)"
- #27 on the list of "Top 101 cities with largest percentage of males in occupations: community and social service occupations (population 50,000+)"
- #32 on the list of "Top 101 cities with largest percentage of males in industries: mining, quarrying, and oil and gas extraction (population 50,000+)"
- #36 on the list of "Top 100 cities with lowest ratio of median house value to median household income (pop. 50,000+)"
- #49 on the list of "Top 101 cities with the hottest summers (population 50,000+)"
- #50 on the list of "Top 101 cities with the highest average wind speeds (population 50,000+)"
- #50 on the list of "Top 101 cities with the highest daily high temperatures (population 50,000+)"
- #52 on the list of "Top 101 cities with largest percentage of females in occupations: legal occupations (population 50,000+)"
- #56 on the list of "Top 101 cities with the largest house values disparities (population 50,000+)"
- #59 on the list of "Top 101 cities with largest percentage of males in industries: real estate and rental and leasing (population 50,000+)"
- #60 on the list of "Top 101 cities with largest percentage of males in industries: public administration (population 50,000+)"
- #67 on the list of "Top 101 cities with largest percentage of males in occupations: health diagnosing and treating practitioners and other technical occupations (population 50,000+)"
- #68 on the list of "Top 101 cities with the largest percentage of people in military transient quarters for temporary residents (population 1,000+)"
- #69 on the list of "Top 101 cities with largest percentage of males in occupations: legal occupations (population 50,000+)"
- #69 on the list of "Top 101 cities with largest percentage of females in industries: mining, quarrying, and oil and gas extraction (population 50,000+)"
- #75 on the list of "Top 101 cities with largest percentage of males in occupations: law enforcement workers including supervisors (population 50,000+)"
- #82 on the list of "Top 101 cities with the largest percentage of people in hospices or homes for chronically ill (population 1,000+)"
- #2 (76311) on the list of "Top 101 zip codes with the smallest percentage of taxpayers using paid preparers for 2012 taxes (pop 1,000+)"
- #47 (76311) on the list of "Top 101 zip codes with the largest percentage of returns reporting salary or wage in 2012 (pop 5,000+)"
- #87 (76311) on the list of "Top 101 zip codes with the lowest 2012 average taxable interest for individuals (pop 5,000+)"
- #101 (76311) on the list of "Top 101 zip codes with the smallest percentage of taxpayers using charity contributions deductions in 2012 (pop 5,000+)"
- #12 on the list of "Top 101 counties with the lowest percentage of residents that exercised in the past month"
- #12 on the list of "Top 101 counties with the largest number of people moving out compared to moving in (pop. 50,000+)"
- #37 on the list of "Top 101 counties with the lowest total withdrawal of fresh water for public supply (pop. 50,000+)"
- #41 on the list of "Top 101 counties with the highest percentage of residents relocating to foreign countries in 2011"
- #54 on the list of "Top 101 counties with the worst general health status score of residents (1-5), 3 years of data"

|
|
Total of 106 patent applications in 2008-2024.