Estimated zip code population in 2022: 125,380 Zip code population in 2010: 94,382 Zip code population in 2000: 38,714
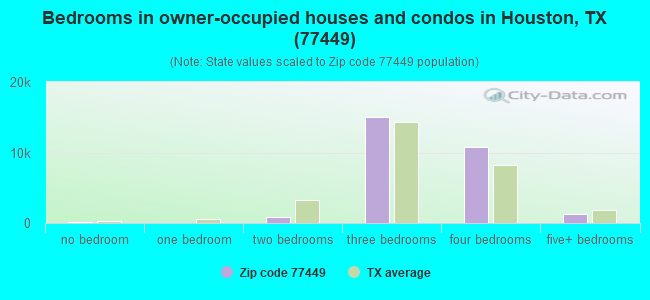
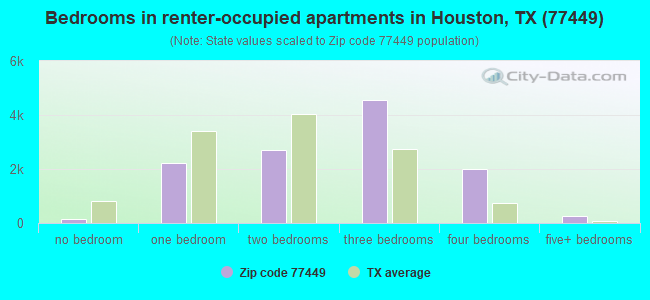
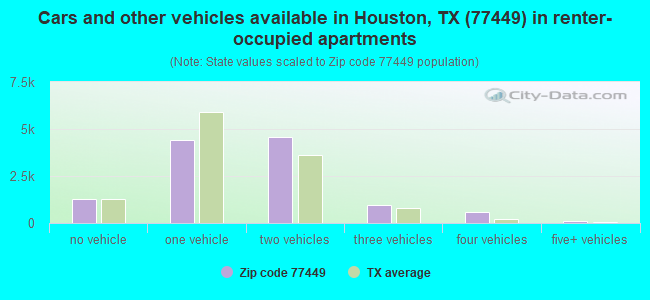
Houses and condos: 41,031 Renter-occupied apartments: 11,952
% of renters here:
30%
State:
38%
March 2022 cost of living index in zip code 77449: 96.8 (near average, U.S. average is 100)
Land area: 29.9 sq. mi. Water area: 0.2 sq. mi.
Population density: 4,199 people per square mile
(average).
OSM Map
General Map
Google Map
MSN Map
OSM Map
General Map
Google Map
MSN Map
OSM Map
General Map
Google Map
MSN Map
OSM Map
General Map
Google Map
MSN Map
Please wait while loading the map...
Real estate property taxes paid for housing units in 2022:
This zip code:
1.8% ($4,377)
Texas:
1.5% ($4,050)
Median real estate property taxes paid for housing units with mortgages in 2022: $4,681 (1.8%) Median real estate property taxes paid for housing units with no mortgage in 2022: $3,810 (1.7%)
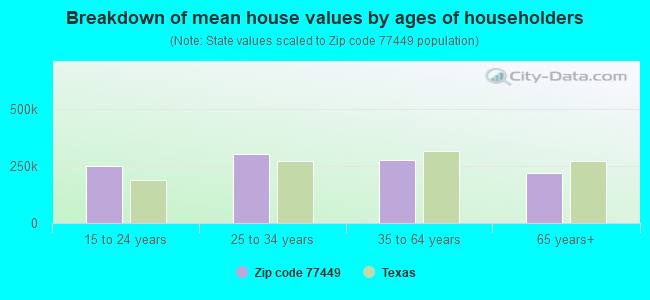
Estimated median house/condo value in 2022: $247,050
77449:
$247,050
Texas:
$275,400
According to our research of Texas and other state lists, there were 123 registered sex offenders living in 77449 zip code as of April 27, 2024. The ratio of all residents to sex offenders in zip code 77449 is 926 to 1. The ratio of registered sex offenders to all residents in this zip code is lower than the state average.
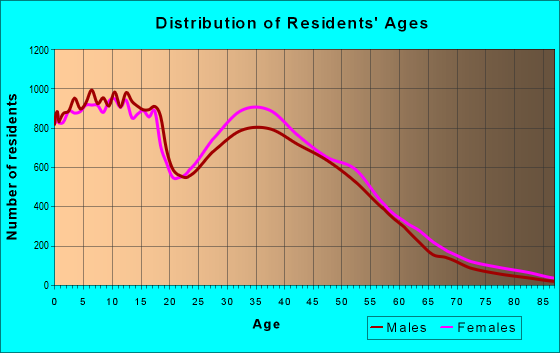
Median resident age:
This zip code:
33.9 years
Texas median age:
35.6 years
Average household size:
This zip code:
3.1 people
Texas:
2.6 people
Averages for the 2020 tax year for zip code 77449, filed in 2021:
Average Adjusted Gross Income (AGI) in 2020: $45,829 (Individual Income Tax Returns)
Here:
$45,829
State:
$77,054
Salary/wage: $45,698 (reported on 84.7% of returns)
Here:
$45,698
State:
$62,766
(% of AGI for various income ranges: 1215.6% for AGIs below $25k, 3675.5% for AGIs $25k-50k, 6795.6% for AGIs $50k-75k, 9997.1% for AGIs $75k-100k, 17162.3% for AGIs $100k-200k, 57429.0% for AGIs over 200k)
Taxable interest for individuals: $583 (reported on 10.3% of returns)
This zip code:
$583
Texas:
$2,665
(% of AGI for various income ranges: 3.6% for AGIs below $25k, 3.3% for AGIs $25k-50k, 7.4% for AGIs $50k-75k, 13.7% for AGIs $75k-100k, 30.9% for AGIs $100k-200k, 190.5% for AGIs over 200k)
Ordinary dividends: $1,947 (reported on 5.9% of returns)
Here:
$1,947
State:
$10,044
(% of AGI for various income ranges: 4.3% for AGIs below $25k, 4.7% for AGIs $25k-50k, 12.4% for AGIs $50k-75k, 25.7% for AGIs $75k-100k, 69.6% for AGIs $100k-200k, 651.5% for AGIs over 200k)
Net capital gain/loss in AGI: +$5,020 (reported on 6.5% of returns)
Here:
+$5,020
State:
+$39,590
(% of AGI for various income ranges: 1.5% for AGIs below $25k, 7.8% for AGIs $25k-50k, 19.9% for AGIs $50k-75k, 40.3% for AGIs $75k-100k, 185.3% for AGIs $100k-200k, 4703.5% for AGIs over 200k)
Profit/loss from business: +$5,591 (reported on 28.3% of returns)
Here:
+$5,591
State:
+$10,888
(% of AGI for various income ranges: 183.2% for AGIs below $25k, 180.2% for AGIs $25k-50k, 183.7% for AGIs $50k-75k, 209.5% for AGIs $75k-100k, 300.5% for AGIs $100k-200k, 2265.0% for AGIs over 200k)
Taxable individual retirement arrangement distribution: $16,979 (reported on 2.8% of returns)
77449:
$16,979
Texas:
$24,740
(% of AGI for various income ranges: 15.2% for AGIs below $25k, 23.7% for AGIs $25k-50k, 61.4% for AGIs $50k-75k, 112.5% for AGIs $75k-100k, 285.9% for AGIs $100k-200k, 2185.5% for AGIs over 200k)
Self-employed (Keogh) retirement plans: $10,500 (reported on 0.0% of returns)
77449:
$10,500
Texas:
$29,298
(% of AGI for various income ranges: 4.0% for AGIs $50k-75k)
Total itemized deductions: $28,203 (reported on 5.4% of returns)
Here:
$28,203
State:
$40,428
(% of AGI for various income ranges: 25.3% for AGIs below $25k, 133.8% for AGIs $25k-50k, 326.2% for AGIs $50k-75k, 474.3% for AGIs $75k-100k, 614.6% for AGIs $100k-200k, 2274.5% for AGIs over 200k)
Charity contributions: $9,493 (reported on 4.1% of returns)
Here:
$9,493
State:
$18,201
(% of AGI for various income ranges: 3.2% for AGIs below $25k, 26.3% for AGIs $25k-50k, 69.4% for AGIs $50k-75k, 123.2% for AGIs $75k-100k, 209.9% for AGIs $100k-200k, 1183.5% for AGIs over 200k)
Taxes paid: $6,556 (reported on 5.0% of returns)
77449:
$6,556
State:
$7,821
(% of AGI for various income ranges: 5.3% for AGIs below $25k, 29.6% for AGIs $25k-50k, 71.4% for AGIs $50k-75k, 104.5% for AGIs $75k-100k, 134.7% for AGIs $100k-200k, 364.0% for AGIs over 200k)
Earned income credit: $2,579 (reported on 25.0% of returns)
Here:
$2,579
State:
$2,584
(% of AGI for various income ranges: 134.3% for AGIs below $25k, 99.9% for AGIs $25k-50k, 2.0% for AGIs $50k-75k)
Percentage of individuals using paid preparers for their 2020 taxes: 92.3%
Here:
92%
State:
92%
(% for various income ranges: 90.8% for AGIs below $25k, 93.3% for AGIs $25k-50k, 93.4% for AGIs $50k-75k, 93.1% for AGIs $75k-100k, 92.5% for AGIs $100k-200k, 90.9% for AGIs over 200k)
Averages for the 2012 tax year for zip code 77449, filed in 2013:
Average Adjusted Gross Income (AGI) in 2012: $45,071 (Individual Income Tax Returns)
Here:
$45,071
State:
$65,384
Salary/wage: $44,807 (reported on 89.1% of returns)
Here:
$44,807
State:
$52,524
(% of AGI for various income ranges: 79.6% for AGIs below $25k, 90.1% for AGIs $25k-50k, 91.7% for AGIs $50k-75k, 91.8% for AGIs $75k-100k, 89.8% for AGIs $100k-200k, 73.4% for AGIs over 200k)
Taxable interest for individuals: $443 (reported on 14.0% of returns)
This zip code:
$443
Texas:
$2,372
(% of AGI for various income ranges: 0.2% for AGIs below $25k, 0.1% for AGIs $25k-50k, 0.1% for AGIs $50k-75k, 0.1% for AGIs $75k-100k, 0.1% for AGIs $100k-200k, 0.2% for AGIs over 200k)
Ordinary dividends: $2,073 (reported on 6.5% of returns)
Here:
$2,073
State:
$9,721
(% of AGI for various income ranges: 0.4% for AGIs below $25k, 0.2% for AGIs $25k-50k, 0.2% for AGIs $50k-75k, 0.2% for AGIs $75k-100k, 0.3% for AGIs $100k-200k, 1.3% for AGIs over 200k)
Net capital gain/loss in AGI: +$2,324 (reported on 4.9% of returns)
Here:
+$2,324
State:
+$35,319
(% of AGI for various income ranges: 0.2% for AGIs $75k-100k, 0.3% for AGIs $100k-200k, 1.7% for AGIs over 200k)
Profit/loss from business: +$9,429 (reported on 21.2% of returns)
Here:
+$9,429
State:
+$13,732
(% of AGI for various income ranges: 15.0% for AGIs below $25k, 4.8% for AGIs $25k-50k, 2.5% for AGIs $50k-75k, 2.2% for AGIs $75k-100k, 2.0% for AGIs $100k-200k, 5.8% for AGIs over 200k)
Taxable individual retirement arrangement distribution: $14,024 (reported on 3.7% of returns)
77449:
$14,024
Texas:
$19,511
(% of AGI for various income ranges: 1.0% for AGIs below $25k, 0.8% for AGIs $25k-50k, 0.9% for AGIs $50k-75k, 1.1% for AGIs $75k-100k, 1.6% for AGIs $100k-200k, 2.1% for AGIs over 200k)
Self-employment retirement plans: $18,880 (reported on 0.1% of returns)
77449:
$18,880
Texas:
$23,938
Total itemized deductions: $17,261 (24% of AGI, reported on 26.4% of returns)
Here:
$17,261
State:
$24,724
Here:
23.8% of AGI
State:
15.9% of AGI
(% of AGI for various income ranges: 6.6% for AGIs below $25k, 10.8% for AGIs $25k-50k, 12.3% for AGIs $50k-75k, 10.7% for AGIs $75k-100k, 9.3% for AGIs $100k-200k, 7.4% for AGIs over 200k)
Charity contributions: $3,746 (reported on 19.0% of returns)
Here:
$3,746
State:
$6,808
(% of AGI for various income ranges: 0.6% for AGIs below $25k, 1.2% for AGIs $25k-50k, 1.6% for AGIs $50k-75k, 1.7% for AGIs $75k-100k, 1.9% for AGIs $100k-200k, 2.9% for AGIs over 200k)
Taxes paid: $4,528 (reported on 25.7% of returns)
77449:
$4,528
State:
$6,921
(% of AGI for various income ranges: 1.8% for AGIs below $25k, 2.6% for AGIs $25k-50k, 3.0% for AGIs $50k-75k, 2.7% for AGIs $75k-100k, 2.6% for AGIs $100k-200k, 1.8% for AGIs over 200k)
Earned income credit: $2,571 (reported on 24.8% of returns)
Here:
$2,571
State:
$2,570
(% of AGI for various income ranges: 9.3% for AGIs below $25k, 1.7% for AGIs $25k-50k)
Percentage of individuals using paid preparers for their 2012 taxes: 50.6%
Here:
51%
State:
51%
(% for various income ranges: 52.7% for AGIs below $25k, 52.9% for AGIs $25k-50k, 48.3% for AGIs $50k-75k, 44.6% for AGIs $75k-100k, 42.7% for AGIs $100k-200k, 58.3% for AGIs over 200k)
Averages for the 2004 tax year for zip code 77449, filed in 2005:
Average Adjusted Gross Income (AGI) in 2004: $43,683 (Individual Income Tax Returns)
Here:
$43,683
State:
$47,881
Salary/wage: $42,209 (reported on 92.0% of returns)
Here:
$42,209
State:
$41,947
(% of AGI for various income ranges: 99.2% for AGIs below $10k, 85.5% for AGIs $10k-25k, 93.6% for AGIs $25k-50k, 93.7% for AGIs $50k-75k, 93.6% for AGIs $75k-100k, 75.4% for AGIs over 100k)
Taxable interest for individuals: $561 (reported on 24.5% of returns)
This zip code:
$561
Texas:
$2,255
(% of AGI for various income ranges: 1.5% for AGIs below $10k, 0.5% for AGIs $10k-25k, 0.3% for AGIs $25k-50k, 0.2% for AGIs $50k-75k, 0.2% for AGIs $75k-100k, 0.3% for AGIs over 100k)
Taxable dividends: $956 (reported on 10.2% of returns)
Here:
$956
State:
$4,261
(% of AGI for various income ranges: 1.0% for AGIs below $10k, 0.3% for AGIs $10k-25k, 0.1% for AGIs $25k-50k, 0.2% for AGIs $50k-75k, 0.1% for AGIs $75k-100k, 0.4% for AGIs over 100k)
Net capital gain/loss: +$1,956 (reported on 8.6% of returns)
Here:
+$1,956
State:
+$16,110
(% of AGI for various income ranges: -0.7% for AGIs below $10k, -0.0% for AGIs $10k-25k, 0.1% for AGIs $25k-50k, 0.1% for AGIs $50k-75k, 0.2% for AGIs $75k-100k, 1.4% for AGIs over 100k)
Profit/loss from business: +$7,092 (reported on 18.9% of returns)
Here:
+$7,092
State:
+$11,013
(% of AGI for various income ranges: 7.4% for AGIs below $10k, 10.3% for AGIs $10k-25k, 2.9% for AGIs $25k-50k, 2.0% for AGIs $50k-75k, 1.8% for AGIs $75k-100k, 2.4% for AGIs over 100k)
IRA payment deduction: $2,809 (reported on 1.5% of returns)
77449:
$2,809
Texas:
$3,120
(% of AGI for various income ranges: 0.2% for AGIs below $10k, 0.1% for AGIs $10k-25k, 0.1% for AGIs $25k-50k, 0.1% for AGIs $50k-75k, 0.1% for AGIs $75k-100k, 0.1% for AGIs over 100k)
Self-employed pension: $9,651 (reported on 0.2% of returns)
Here:
$9,651
Texas:
$16,401
(% of AGI for various income ranges: 0.1% for AGIs $10k-25k, 0.0% for AGIs $50k-75k, 0.1% for AGIs $75k-100k, 0.1% for AGIs over 100k)
Total itemized deductions: $15,129 (22% of AGI, reported on 37.4% of returns)
Here:
$15,129
State:
$19,631
Here:
22.1% of AGI
State:
18.9% of AGI
(% of AGI for various income ranges: 10.4% for AGIs below $10k, 11.1% for AGIs $10k-25k, 14.4% for AGIs $25k-50k, 14.8% for AGIs $50k-75k, 13.9% for AGIs $75k-100k, 9.7% for AGIs over 100k)
Charity contributions deductions: $2,673 (4% of AGI, reported on 29.2% of returns)
Here:
$2,673
State:
$4,753
Here:
3.6% of AGI
State:
4.2% of AGI
(% of AGI for various income ranges: 0.4% for AGIs below $10k, 0.9% for AGIs $10k-25k, 1.7% for AGIs $25k-50k, 1.8% for AGIs $50k-75k, 2.0% for AGIs $75k-100k, 2.2% for AGIs over 100k)
Total tax: $5,866 (reported on 72.8% of returns)
77449:
$5,866
State:
$9,058
(% of AGI for various income ranges: 3.6% for AGIs below $10k, 4.0% for AGIs $10k-25k, 5.4% for AGIs $25k-50k, 7.8% for AGIs $50k-75k, 10.0% for AGIs $75k-100k, 19.0% for AGIs over 100k)
Earned income credit: $1,969 (reported on 19.1% of returns)
Here:
$1,969
State:
$2,024
Percentage of individuals using paid preparers for their 2004 taxes: 49.7%
Here:
50%
State:
57%
(% for various income ranges: 42.8% for AGIs below $10k, 59.9% for AGIs $10k-25k, 52.3% for AGIs $25k-50k, 45.9% for AGIs $50k-75k, 39.7% for AGIs $75k-100k, 45.0% for AGIs over 100k)
Likely homosexual households (counted as self-reported same-sex unmarried-partner households)
Lesbian couples: 0.3% of all households
Gay men: 0.0% of all households
Household received Food Stamps/SNAP in the past 12 months: 5,391 Household did not receive Food Stamps/SNAP in the past 12 months: 34,837
Women who had a birth in the past 12 months: 1,800 (1,130 now married, 662 unmarried) Women who did not have a birth in the past 12 months: 31,121 (14,078 now married, 17,030 unmarried)
Housing units in zip code 77449 with a mortgage: 18,239 (998 second mortgage, 593 both second mortgage and home equity loan) Houses without a mortgage: 182
Median monthly owner costs for units with a mortgage: $1,762 Median monthly owner costs for units without a mortgage: $697
Residents with income below the poverty level in 2022:
This zip code:
10.7%
Whole state:
14.0%
Residents with income below 50% of the poverty level in 2022:
This zip code:
6.1%
Whole state:
7.4%
Median number of rooms in houses and condos:
Here:
6.4
State:
6.3
Median number of rooms in apartments:
Here:
4.8
State:
4.0
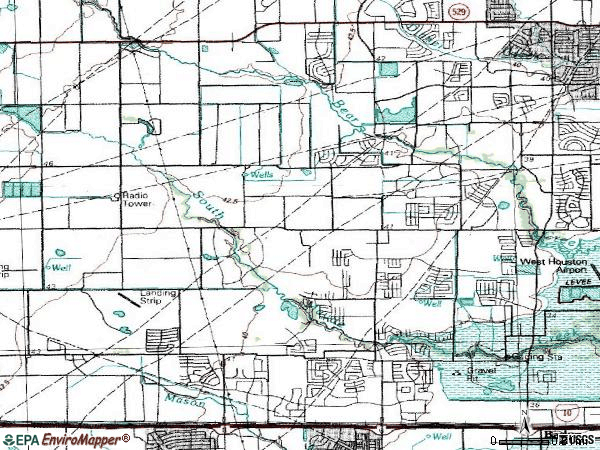
Notable locations in this zip code not listed on our city pages
Notable locations in zip code 77449: West Interstate 10 Fire Department Station 4 (A), West Interstate 10 Fire Department Station 5 (B), West I-10 Volunteer Fire Department (C). Display/hide their locations on the map
Churches in zip code 77449 include: Bridgewater Baptist Church (A), Church of the Nazarene (B), Saint Edith Stein Catholic Church (C), Westside Church of the Nazarene (D), Katy Church of the Nazarene (E), Saint Matthias Church (F), Westfield Free Will Baptist Church (G), Tri-County Baptist Church (H), Church of Christ (I). Display/hide their locations on the map
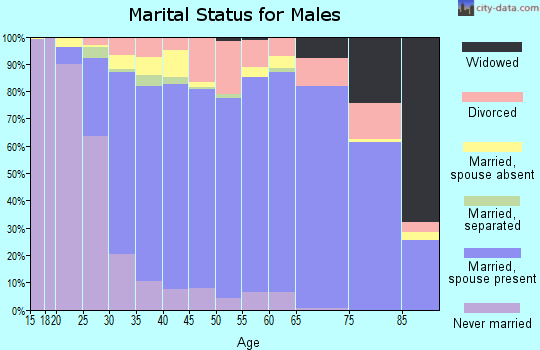
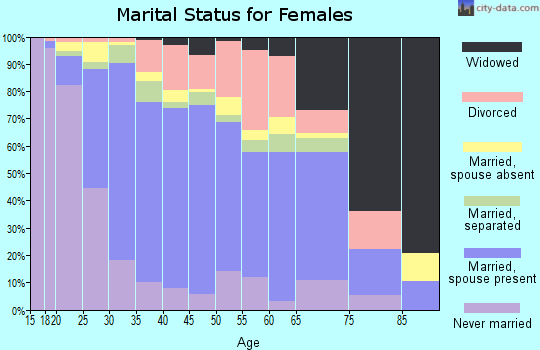
22,681 married couples with children.
10,125 single-parent households (3,366 men, 6,759 women).
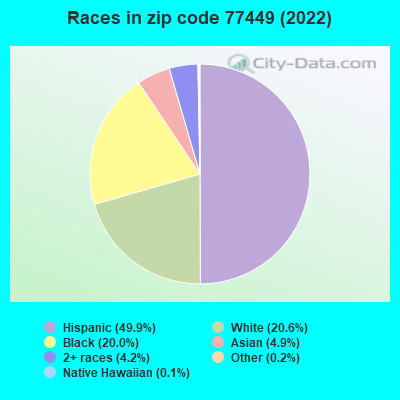
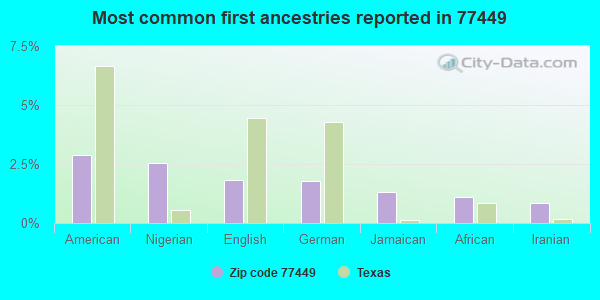
48.7% of residents of 77449 zip code speak English at home.
41.1% of residents speak Spanish at home (58% very well, 23% well, 12% not well, 6% not at all).
3.4% of residents speak other Indo-European language at home (59% very well, 39% well, 1% not well, 1% not at all).
3.5% of residents speak Asian or Pacific Island language at home (65% very well, 21% well, 8% not well, 5% not at all).
3.0% of residents speak other language at home (71% very well, 28% well, 1% not well).
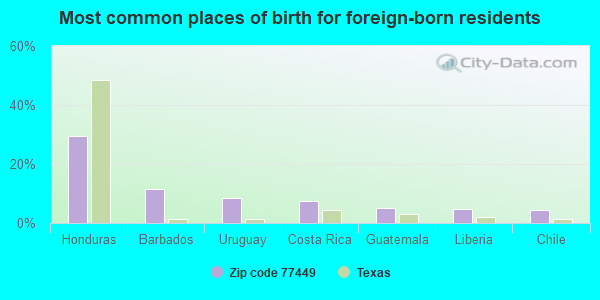
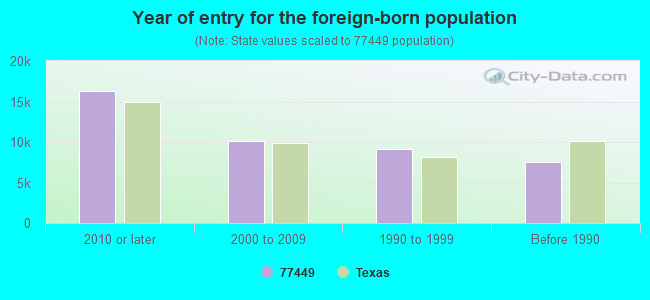
Foreign born population: 40,622 (32.4%) (53.7% of them are naturalized citizens)
(Resource Conservation and Recovery Act (tracking hazardous waste))
AMERICAN TELEPHONE AND TELEGRAPH COMPANY (2 MI N NW L434200 in KATY, TX)
(Resource Conservation and Recovery Act (tracking hazardous waste)) Alternative names: AMERICAN TEL & TEL CO LONG LINES
1.25 DRY CLEAN SUPER CENTER (1301 N FRY RD in KATY, TX)
Conditionally Exempt Small Quantity Generators, less than 100 kg/month of hazardous waste (Resource Conservation and Recovery Act (tracking hazardous waste)) Alternative names: ONE TWENTY FIVE DRY CLEAN SUPER CENTER
Housing units lacking complete plumbing facilities: 0.7% Housing units lacking complete kitchen facilities: 1.5%
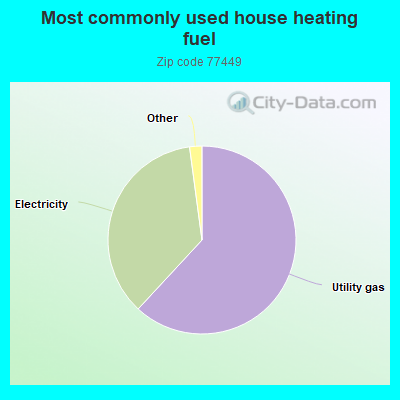
61.9%Utility gas
36.0%Electricity
0.8%Bottled, tank, or LP gas
0.7%No fuel used
Population in 1990: 22,664. Population change in the 1990s: +16,050 (+70.8%).
Place of birth for U.S.-born residents:
This state: 56,734
Northeast: 4,452
Midwest: 7,035
South: 9,298
West: 5,505
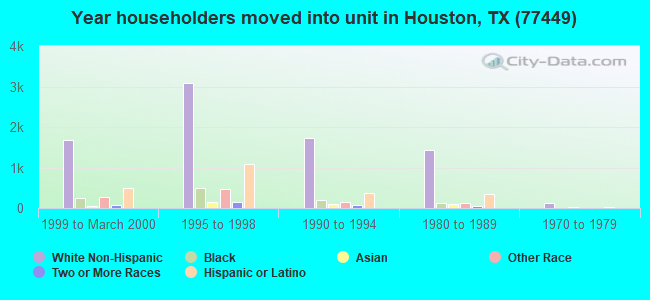
45% of the 77449 zip code residents lived in the same house 5 years ago. Out of people who lived in different houses, 70% lived in this county. Out of people who lived in different counties, 50% lived in Texas.
90% of the 77449 zip code residents lived in the same house 1 year ago. Out of people who lived in different houses, 61% moved from this county. Out of people who lived in different houses, 17% moved from different county within same state. Out of people who lived in different houses, 12% moved from different state. Out of people who lived in different houses, 10% moved from abroad.
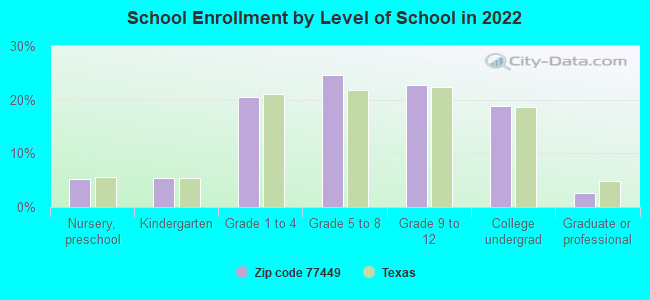
Private vs. public school enrollment:
Students in private schools in grades 1 to 8 (elementary and middle school): 868
Here:
5.1%
Texas:
8.8%
Students in private schools in grades 9 to 12 (high school): 340
Here:
4.0%
Texas:
8.0%
Students in private undergraduate colleges: 773
Here:
10.8%
Texas:
16.2%
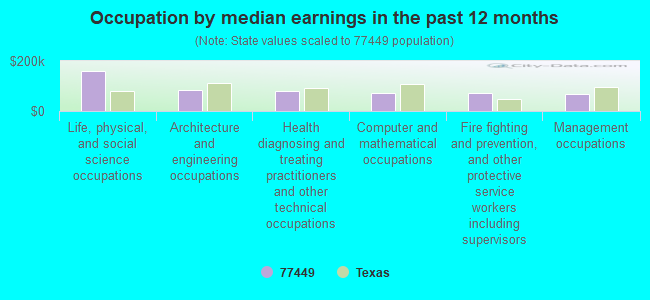
Occupation by median earnings in the past 12 months ($)
160,962Life, physical, and social science occupations
85,481Architecture and engineering occupations
79,171Health diagnosing and treating practitioners and other technical occupations
72,272Computer and mathematical occupations
70,167Fire fighting and prevention, and other protective service workers including supervisors
69,476Management occupations
Companies with federal contracts located in this zip code:
SUBSEA TECHNOLOGIES INC (21925 FRANZ ROAD, SUITE 40 in KATY, TX; small business) : $65,630 in 5 contractsfrom 2003 to 2006
Contracts for Underwater Sound Equipment, ADPE System Configuration, Lease or Rental of Equipment -- Instruments and Laboratory Equipment by Navy, NASA, National Oceanic and Atmospheric Administration/Under Secretary for Oceans and Atmosphere Signed by year:2000: $0; 2001: $0; 2002: $0; 2003: $31,790; 2004: $0; 2005: $23,190; 2006: $10,650.
Biggest contracts:
$31,790 with Navy for Underwater Sound Equipment. Signed on 2003-08-13. Completion date: 2003-09-24.
$16,890 with NASA for ADPE System Configuration. Signed on 2005-01-05. Completion date: 2005-01-28.
$10,650 with Navy for Underwater Sound Equipment. Signed on 2006-06-27. Completion date: 2006-07-26.
$4,950 with National Oceanic and Atmospheric Administration/Under Secretary for Oceans and Atmosphere for Lease or Rental of Equipment -- Instruments and Laboratory Equipment. Signed on 2005-03-31. Completion date: 2005-06-24.
CHRIS RAINEY (19127 GETTYSBURG VALLEY D in KATY, TX; small business) : $35,520 in 3 contractsfrom 2004 to 2005
$14,000 with Air Force for Technical Representation Services -- Ammunition and Explosives. Taking place in NV. Signed on 2004-11-03. Completion date: 2004-11-14.
$12,000 with Air Force for Recreational Services. Taking place in NV. Signed on 2005-11-07. Completion date: 2005-11-10.
$9,520 with Air Force for Recreational Services. Taking place in AR. Signed on 2005-09-15. Completion date: 2005-10-09.
PRIME TROPHIES & AD SPECLTIES (6435 OLD HICKORY ST in KATY, TX; small business)
$8,410 with Army for Miscellaneous Items. Signed on 2002-09-24. Completion date: 2002-10-18.
Top industries in this zip code by the number of employees in 2005:
Management of Companies and Enterprises: Corporate, Subsidiary, and Regional Managing Offices (over 1000 employees: 1 establishment, 1-4 employees: 2 establishments)
2002 - 2018 National Fire Incident Reporting System (NFIRS) incidents
According to the data from the years 2002 - 2018 the average number of fires per year is 127. The highest number of fires - 196 took place in 2011, and the least - 30 in 2002. The data has a growing trend.
When looking into fire subcategories, the most reports belonged to: Outside Fires (41.2%), and Structure Fires (36.2%).
Fire incident types reported to NFIRS in Zip Code 77449
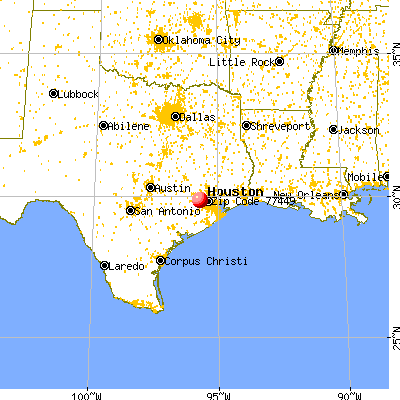


 Nearest zip codes: 77084, 77094, 77450, 77433, 77493, 77095.
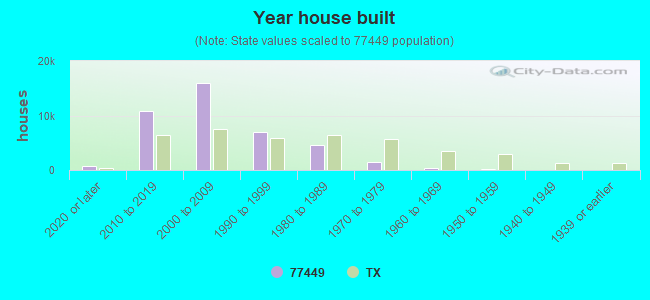


 According to the data from the years 2002 - 2018 the average number of fires per year is 127. The highest number of fires - 196 took place in 2011, and the least - 30 in 2002. The data has a growing trend.
 When looking into fire subcategories, the most reports belonged to: Outside Fires (41.2%), and Structure Fires (36.2%).