Estimated zip code population in 2022: 74,604
Zip code population in 2010: 71,889
Zip code population in 2000: 48,174
Houses and condos: 27,154
Renter-occupied apartments: 7,976
% of renters here:
30%State:
38%
March 2022 cost of living index in zip code 77450: 97.5
(near average, U.S. average is 100)
Land area: 20.4
sq. mi.
Water area: 0.4
sq. mi.
Population density: 3,658 people per square mile (average).
OSM Map
General Map
Google Map
MSN Map
OSM Map
General Map
Google Map
MSN Map
OSM Map
General Map
Google Map
MSN Map
OSM Map
General Map
Google Map
MSN Map
Please wait while loading the map...
Real estate property taxes paid for housing units in 2022:
This zip code:
1.8% ($6,462)Texas:
1.5% ($4,050)
Median real estate property taxes paid for housing units with mortgages in 2022: $6,774 (1.8%)
Median real estate property taxes paid for housing units with no mortgage in 2022: $6,166 (1.7%)
Profiles of local businesses
Business Search - 14 Million verified businesses
Males: 37,301 Females: 37,302
For population 25 years and over in 77450:
High school or higher: 96.5%Bachelor's degree or higher: 55.7%Graduate or professional degree: 20.7%Unemployed: 4.0%Mean travel time to work (commute): 30.9 minutes
For population 15 years and over in 77450:
Never married: 27.6%Now married: 61.3%Separated: 1.4%Widowed: 3.2%Divorced: 6.6%
Zip code 77450 compared to state average:
Black race population percentage below state average. Hispanic race population percentage below state average. Foreign-born population percentage above state average. Length of stay since moving in significantly above state average. Number of rooms per house above state average. House age below state average. Percentage of population with a bachelor's degree or higher above state average. 40,594 54.4% White 16,233 21.8% Hispanic or Latino 8,864 11.9% Asian 4,893 6.6% Black 3,205 4.3% Two or more races 588 0.8% Some other race 213 0.3% American Indian 11 0.01% Native Hawaiian and Other
Data:
Median household income ($)
Median household income (% change since 2000)
Household income diversity
Ratio of average income to average house value (%)
Ratio of average income to average rent
Median household income ($) - White
Median household income ($) - Black or African American
Median household income ($) - Asian
Median household income ($) - Hispanic or Latino
Median household income ($) - American Indian and Alaska Native
Median household income ($) - Multirace
Median household income ($) - Other Race
Median household income for houses/condos with a mortgage ($)
Median household income for apartments without a mortgage ($)
Races - White alone (%)
Races - White alone (% change since 2000)
Races - Black alone (%)
Races - Black alone (% change since 2000)
Races - American Indian alone (%)
Races - American Indian alone (% change since 2000)
Races - Asian alone (%)
Races - Asian alone (% change since 2000)
Races - Hispanic (%)
Races - Hispanic (% change since 2000)
Races - Native Hawaiian and Other Pacific Islander alone (%)
Races - Native Hawaiian and Other Pacific Islander alone (% change since 2000)
Races - Two or more races (%)
Races - Two or more races (% change since 2000)
Races - Other race alone (%)
Races - Other race alone (% change since 2000)
Racial diversity
Unemployment (%)
Unemployment (% change since 2000)
Unemployment (%) - White
Unemployment (%) - Black or African American
Unemployment (%) - Asian
Unemployment (%) - Hispanic or Latino
Unemployment (%) - American Indian and Alaska Native
Unemployment (%) - Multirace
Unemployment (%) - Other Race
Population density (people per square mile)
Population - Males (%)
Population - Females (%)
Population - Males (%) - White
Population - Males (%) - Black or African American
Population - Males (%) - Asian
Population - Males (%) - Hispanic or Latino
Population - Males (%) - American Indian and Alaska Native
Population - Males (%) - Multirace
Population - Males (%) - Other Race
Population - Females (%) - White
Population - Females (%) - Black or African American
Population - Females (%) - Asian
Population - Females (%) - Hispanic or Latino
Population - Females (%) - American Indian and Alaska Native
Population - Females (%) - Multirace
Population - Females (%) - Other Race
Coronavirus confirmed cases (Apr 27, 2024)
Deaths caused by coronavirus (Apr 27, 2024)
Coronavirus confirmed cases (per 100k population) (Apr 27, 2024)
Deaths caused by coronavirus (per 100k population) (Apr 27, 2024)
Daily increase in number of cases (Apr 27, 2024)
Weekly increase in number of cases (Apr 27, 2024)
Cases doubled (in days) (Apr 27, 2024)
Hospitalized patients (Apr 18, 2022)
Negative test results (Apr 18, 2022)
Total test results (Apr 18, 2022)
COVID Vaccine doses distributed (per 100k population) (Sep 19, 2023)
COVID Vaccine doses administered (per 100k population) (Sep 19, 2023)
COVID Vaccine doses distributed (Sep 19, 2023)
COVID Vaccine doses administered (Sep 19, 2023)
Likely homosexual households (%)
Likely homosexual households (% change since 2000)
Likely homosexual households - Lesbian couples (%)
Likely homosexual households - Lesbian couples (% change since 2000)
Likely homosexual households - Gay men (%)
Likely homosexual households - Gay men (% change since 2000)
Cost of living index
Median gross rent ($)
Median contract rent ($)
Median monthly housing costs ($)
Median house or condo value ($)
Median house or condo value ($ change since 2000)
Mean house or condo value by units in structure - 1, detached ($)
Mean house or condo value by units in structure - 1, attached ($)
Mean house or condo value by units in structure - 2 ($)
Mean house or condo value by units in structure by units in structure - 3 or 4 ($)
Mean house or condo value by units in structure - 5 or more ($)
Mean house or condo value by units in structure - Boat, RV, van, etc. ($)
Mean house or condo value by units in structure - Mobile home ($)
Median house or condo value ($) - White
Median house or condo value ($) - Black or African American
Median house or condo value ($) - Asian
Median house or condo value ($) - Hispanic or Latino
Median house or condo value ($) - American Indian and Alaska Native
Median house or condo value ($) - Multirace
Median house or condo value ($) - Other Race
Median resident age
Resident age diversity
Median resident age - Males
Median resident age - Females
Median resident age - White
Median resident age - Black or African American
Median resident age - Asian
Median resident age - Hispanic or Latino
Median resident age - American Indian and Alaska Native
Median resident age - Multirace
Median resident age - Other Race
Median resident age - Males - White
Median resident age - Males - Black or African American
Median resident age - Males - Asian
Median resident age - Males - Hispanic or Latino
Median resident age - Males - American Indian and Alaska Native
Median resident age - Males - Multirace
Median resident age - Males - Other Race
Median resident age - Females - White
Median resident age - Females - Black or African American
Median resident age - Females - Asian
Median resident age - Females - Hispanic or Latino
Median resident age - Females - American Indian and Alaska Native
Median resident age - Females - Multirace
Median resident age - Females - Other Race
Commute - mean travel time to work (minutes)
Travel time to work - Less than 5 minutes (%)
Travel time to work - Less than 5 minutes (% change since 2000)
Travel time to work - 5 to 9 minutes (%)
Travel time to work - 5 to 9 minutes (% change since 2000)
Travel time to work - 10 to 19 minutes (%)
Travel time to work - 10 to 19 minutes (% change since 2000)
Travel time to work - 20 to 29 minutes (%)
Travel time to work - 20 to 29 minutes (% change since 2000)
Travel time to work - 30 to 39 minutes (%)
Travel time to work - 30 to 39 minutes (% change since 2000)
Travel time to work - 40 to 59 minutes (%)
Travel time to work - 40 to 59 minutes (% change since 2000)
Travel time to work - 60 to 89 minutes (%)
Travel time to work - 60 to 89 minutes (% change since 2000)
Travel time to work - 90 or more minutes (%)
Travel time to work - 90 or more minutes (% change since 2000)
Marital status - Never married (%)
Marital status - Now married (%)
Marital status - Separated (%)
Marital status - Widowed (%)
Marital status - Divorced (%)
Median family income ($)
Median family income (% change since 2000)
Median non-family income ($)
Median non-family income (% change since 2000)
Median per capita income ($)
Median per capita income (% change since 2000)
Median family income ($) - White
Median family income ($) - Black or African American
Median family income ($) - Asian
Median family income ($) - Hispanic or Latino
Median family income ($) - American Indian and Alaska Native
Median family income ($) - Multirace
Median family income ($) - Other Race
Median year house/condo built
Median year apartment built
Year house built - Built 2005 or later (%)
Year house built - Built 2000 to 2004 (%)
Year house built - Built 1990 to 1999 (%)
Year house built - Built 1980 to 1989 (%)
Year house built - Built 1970 to 1979 (%)
Year house built - Built 1960 to 1969 (%)
Year house built - Built 1950 to 1959 (%)
Year house built - Built 1940 to 1949 (%)
Year house built - Built 1939 or earlier (%)
Average household size
Household density (households per square mile)
Average household size - White
Average household size - Black or African American
Average household size - Asian
Average household size - Hispanic or Latino
Average household size - American Indian and Alaska Native
Average household size - Multirace
Average household size - Other Race
Occupied housing units (%)
Vacant housing units (%)
Owner occupied housing units (%)
Renter occupied housing units (%)
Vacancy status - For rent (%)
Vacancy status - For sale only (%)
Vacancy status - Rented or sold, not occupied (%)
Vacancy status - For seasonal, recreational, or occasional use (%)
Vacancy status - For migrant workers (%)
Vacancy status - Other vacant (%)
Residents with income below the poverty level (%)
Residents with income below 50% of the poverty level (%)
Children below poverty level (%)
Poor families by family type - Married-couple family (%)
Poor families by family type - Male, no wife present (%)
Poor families by family type - Female, no husband present (%)
Poverty status for native-born residents (%)
Poverty status for foreign-born residents (%)
Poverty among high school graduates not in families (%)
Poverty among people who did not graduate high school not in families (%)
Residents with income below the poverty level (%) - White
Residents with income below the poverty level (%) - Black or African American
Residents with income below the poverty level (%) - Asian
Residents with income below the poverty level (%) - Hispanic or Latino
Residents with income below the poverty level (%) - American Indian and Alaska Native
Residents with income below the poverty level (%) - Multirace
Residents with income below the poverty level (%) - Other Race
Air pollution - Air Quality Index (AQI)
Air pollution - CO
Air pollution - NO2
Air pollution - SO2
Air pollution - Ozone
Air pollution - PM10
Air pollution - PM25
Air pollution - Pb
Crime - Murders per 100,000 population
Crime - Rapes per 100,000 population
Crime - Robberies per 100,000 population
Crime - Assaults per 100,000 population
Crime - Burglaries per 100,000 population
Crime - Thefts per 100,000 population
Crime - Auto thefts per 100,000 population
Crime - Arson per 100,000 population
Crime - City-data.com crime index
Crime - Violent crime index
Crime - Property crime index
Crime - Murders per 100,000 population (5 year average)
Crime - Rapes per 100,000 population (5 year average)
Crime - Robberies per 100,000 population (5 year average)
Crime - Assaults per 100,000 population (5 year average)
Crime - Burglaries per 100,000 population (5 year average)
Crime - Thefts per 100,000 population (5 year average)
Crime - Auto thefts per 100,000 population (5 year average)
Crime - Arson per 100,000 population (5 year average)
Crime - City-data.com crime index (5 year average)
Crime - Violent crime index (5 year average)
Crime - Property crime index (5 year average)
1996 Presidential Elections Results (%) - Democratic Party (Clinton)
1996 Presidential Elections Results (%) - Republican Party (Dole)
1996 Presidential Elections Results (%) - Other
2000 Presidential Elections Results (%) - Democratic Party (Gore)
2000 Presidential Elections Results (%) - Republican Party (Bush)
2000 Presidential Elections Results (%) - Other
2004 Presidential Elections Results (%) - Democratic Party (Kerry)
2004 Presidential Elections Results (%) - Republican Party (Bush)
2004 Presidential Elections Results (%) - Other
2008 Presidential Elections Results (%) - Democratic Party (Obama)
2008 Presidential Elections Results (%) - Republican Party (McCain)
2008 Presidential Elections Results (%) - Other
2012 Presidential Elections Results (%) - Democratic Party (Obama)
2012 Presidential Elections Results (%) - Republican Party (Romney)
2012 Presidential Elections Results (%) - Other
2016 Presidential Elections Results (%) - Democratic Party (Clinton)
2016 Presidential Elections Results (%) - Republican Party (Trump)
2016 Presidential Elections Results (%) - Other
2020 Presidential Elections Results (%) - Democratic Party (Biden)
2020 Presidential Elections Results (%) - Republican Party (Trump)
2020 Presidential Elections Results (%) - Other
Ancestries Reported - Arab (%)
Ancestries Reported - Czech (%)
Ancestries Reported - Danish (%)
Ancestries Reported - Dutch (%)
Ancestries Reported - English (%)
Ancestries Reported - French (%)
Ancestries Reported - French Canadian (%)
Ancestries Reported - German (%)
Ancestries Reported - Greek (%)
Ancestries Reported - Hungarian (%)
Ancestries Reported - Irish (%)
Ancestries Reported - Italian (%)
Ancestries Reported - Lithuanian (%)
Ancestries Reported - Norwegian (%)
Ancestries Reported - Polish (%)
Ancestries Reported - Portuguese (%)
Ancestries Reported - Russian (%)
Ancestries Reported - Scotch-Irish (%)
Ancestries Reported - Scottish (%)
Ancestries Reported - Slovak (%)
Ancestries Reported - Subsaharan African (%)
Ancestries Reported - Swedish (%)
Ancestries Reported - Swiss (%)
Ancestries Reported - Ukrainian (%)
Ancestries Reported - United States (%)
Ancestries Reported - Welsh (%)
Ancestries Reported - West Indian (%)
Ancestries Reported - Other (%)
Educational Attainment - No schooling completed (%)
Educational Attainment - Less than high school (%)
Educational Attainment - High school or equivalent (%)
Educational Attainment - Less than 1 year of college (%)
Educational Attainment - 1 or more years of college (%)
Educational Attainment - Associate degree (%)
Educational Attainment - Bachelor's degree (%)
Educational Attainment - Master's degree (%)
Educational Attainment - Professional school degree (%)
Educational Attainment - Doctorate degree (%)
School Enrollment - Nursery, preschool (%)
School Enrollment - Kindergarten (%)
School Enrollment - Grade 1 to 4 (%)
School Enrollment - Grade 5 to 8 (%)
School Enrollment - Grade 9 to 12 (%)
School Enrollment - College undergrad (%)
School Enrollment - Graduate or professional (%)
School Enrollment - Not enrolled in school (%)
School enrollment - Public schools (%)
School enrollment - Private schools (%)
School enrollment - Not enrolled (%)
Median number of rooms in houses and condos
Median number of rooms in apartments
Housing units lacking complete plumbing facilities (%)
Housing units lacking complete kitchen facilities (%)
Density of houses
Urban houses (%)
Rural houses (%)
Households with people 60 years and over (%)
Households with people 65 years and over (%)
Households with people 75 years and over (%)
Households with one or more nonrelatives (%)
Households with no nonrelatives (%)
Population in households (%)
Family households (%)
Nonfamily households (%)
Population in families (%)
Family households with own children (%)
Median number of bedrooms in owner occupied houses
Mean number of bedrooms in owner occupied houses
Median number of bedrooms in renter occupied houses
Mean number of bedrooms in renter occupied houses
Median number of vehichles in owner occupied houses
Mean number of vehichles in owner occupied houses
Median number of vehichles in renter occupied houses
Mean number of vehichles in renter occupied houses
Mortgage status - with mortgage (%)
Mortgage status - with second mortgage (%)
Mortgage status - with home equity loan (%)
Mortgage status - with both second mortgage and home equity loan (%)
Mortgage status - without a mortgage (%)
Average family size
Average family size - White
Average family size - Black or African American
Average family size - Asian
Average family size - Hispanic or Latino
Average family size - American Indian and Alaska Native
Average family size - Multirace
Average family size - Other Race
Geographical mobility - Same house 1 year ago (%)
Geographical mobility - Moved within same county (%)
Geographical mobility - Moved from different county within same state (%)
Geographical mobility - Moved from different state (%)
Geographical mobility - Moved from abroad (%)
Place of birth - Born in state of residence (%)
Place of birth - Born in other state (%)
Place of birth - Native, outside of US (%)
Place of birth - Foreign born (%)
Housing units in structures - 1, detached (%)
Housing units in structures - 1, attached (%)
Housing units in structures - 2 (%)
Housing units in structures - 3 or 4 (%)
Housing units in structures - 5 to 9 (%)
Housing units in structures - 10 to 19 (%)
Housing units in structures - 20 to 49 (%)
Housing units in structures - 50 or more (%)
Housing units in structures - Mobile home (%)
Housing units in structures - Boat, RV, van, etc. (%)
House/condo owner moved in on average (years ago)
Renter moved in on average (years ago)
Year householder moved into unit - Moved in 1999 to March 2000 (%)
Year householder moved into unit - Moved in 1995 to 1998 (%)
Year householder moved into unit - Moved in 1990 to 1994 (%)
Year householder moved into unit - Moved in 1980 to 1989 (%)
Year householder moved into unit - Moved in 1970 to 1979 (%)
Year householder moved into unit - Moved in 1969 or earlier (%)
Means of transportation to work - Drove car alone (%)
Means of transportation to work - Carpooled (%)
Means of transportation to work - Public transportation (%)
Means of transportation to work - Bus or trolley bus (%)
Means of transportation to work - Streetcar or trolley car (%)
Means of transportation to work - Subway or elevated (%)
Means of transportation to work - Railroad (%)
Means of transportation to work - Ferryboat (%)
Means of transportation to work - Taxicab (%)
Means of transportation to work - Motorcycle (%)
Means of transportation to work - Bicycle (%)
Means of transportation to work - Walked (%)
Means of transportation to work - Other means (%)
Working at home (%)
Industry diversity
Most Common Industries - Agriculture, forestry, fishing and hunting, and mining (%)
Most Common Industries - Agriculture, forestry, fishing and hunting (%)
Most Common Industries - Mining, quarrying, and oil and gas extraction (%)
Most Common Industries - Construction (%)
Most Common Industries - Manufacturing (%)
Most Common Industries - Wholesale trade (%)
Most Common Industries - Retail trade (%)
Most Common Industries - Transportation and warehousing, and utilities (%)
Most Common Industries - Transportation and warehousing (%)
Most Common Industries - Utilities (%)
Most Common Industries - Information (%)
Most Common Industries - Finance and insurance, and real estate and rental and leasing (%)
Most Common Industries - Finance and insurance (%)
Most Common Industries - Real estate and rental and leasing (%)
Most Common Industries - Professional, scientific, and management, and administrative and waste management services (%)
Most Common Industries - Professional, scientific, and technical services (%)
Most Common Industries - Management of companies and enterprises (%)
Most Common Industries - Administrative and support and waste management services (%)
Most Common Industries - Educational services, and health care and social assistance (%)
Most Common Industries - Educational services (%)
Most Common Industries - Health care and social assistance (%)
Most Common Industries - Arts, entertainment, and recreation, and accommodation and food services (%)
Most Common Industries - Arts, entertainment, and recreation (%)
Most Common Industries - Accommodation and food services (%)
Most Common Industries - Other services, except public administration (%)
Most Common Industries - Public administration (%)
Occupation diversity
Most Common Occupations - Management, business, science, and arts occupations (%)
Most Common Occupations - Management, business, and financial occupations (%)
Most Common Occupations - Management occupations (%)
Most Common Occupations - Business and financial operations occupations (%)
Most Common Occupations - Computer, engineering, and science occupations (%)
Most Common Occupations - Computer and mathematical occupations (%)
Most Common Occupations - Architecture and engineering occupations (%)
Most Common Occupations - Life, physical, and social science occupations (%)
Most Common Occupations - Education, legal, community service, arts, and media occupations (%)
Most Common Occupations - Community and social service occupations (%)
Most Common Occupations - Legal occupations (%)
Most Common Occupations - Education, training, and library occupations (%)
Most Common Occupations - Arts, design, entertainment, sports, and media occupations (%)
Most Common Occupations - Healthcare practitioners and technical occupations (%)
Most Common Occupations - Health diagnosing and treating practitioners and other technical occupations (%)
Most Common Occupations - Health technologists and technicians (%)
Most Common Occupations - Service occupations (%)
Most Common Occupations - Healthcare support occupations (%)
Most Common Occupations - Protective service occupations (%)
Most Common Occupations - Fire fighting and prevention, and other protective service workers including supervisors (%)
Most Common Occupations - Law enforcement workers including supervisors (%)
Most Common Occupations - Food preparation and serving related occupations (%)
Most Common Occupations - Building and grounds cleaning and maintenance occupations (%)
Most Common Occupations - Personal care and service occupations (%)
Most Common Occupations - Sales and office occupations (%)
Most Common Occupations - Sales and related occupations (%)
Most Common Occupations - Office and administrative support occupations (%)
Most Common Occupations - Natural resources, construction, and maintenance occupations (%)
Most Common Occupations - Farming, fishing, and forestry occupations (%)
Most Common Occupations - Construction and extraction occupations (%)
Most Common Occupations - Installation, maintenance, and repair occupations (%)
Most Common Occupations - Production, transportation, and material moving occupations (%)
Most Common Occupations - Production occupations (%)
Most Common Occupations - Transportation occupations (%)
Most Common Occupations - Material moving occupations (%)
People in Group quarters - Institutionalized population (%)
People in Group quarters - Correctional institutions (%)
People in Group quarters - Federal prisons and detention centers (%)
People in Group quarters - Halfway houses (%)
People in Group quarters - Local jails and other confinement facilities (including police lockups) (%)
People in Group quarters - Military disciplinary barracks (%)
People in Group quarters - State prisons (%)
People in Group quarters - Other types of correctional institutions (%)
People in Group quarters - Nursing homes (%)
People in Group quarters - Hospitals/wards, hospices, and schools for the handicapped (%)
People in Group quarters - Hospitals/wards and hospices for chronically ill (%)
People in Group quarters - Hospices or homes for chronically ill (%)
People in Group quarters - Military hospitals or wards for chronically ill (%)
People in Group quarters - Other hospitals or wards for chronically ill (%)
People in Group quarters - Hospitals or wards for drug/alcohol abuse (%)
People in Group quarters - Mental (Psychiatric) hospitals or wards (%)
People in Group quarters - Schools, hospitals, or wards for the mentally retarded (%)
People in Group quarters - Schools, hospitals, or wards for the physically handicapped (%)
People in Group quarters - Institutions for the deaf (%)
People in Group quarters - Institutions for the blind (%)
People in Group quarters - Orthopedic wards and institutions for the physically handicapped (%)
People in Group quarters - Wards in general hospitals for patients who have no usual home elsewhere (%)
People in Group quarters - Wards in military hospitals for patients who have no usual home elsewhere (%)
People in Group quarters - Juvenile institutions (%)
People in Group quarters - Long-term care (%)
People in Group quarters - Homes for abused, dependent, and neglected children (%)
People in Group quarters - Residential treatment centers for emotionally disturbed children (%)
People in Group quarters - Training schools for juvenile delinquents (%)
People in Group quarters - Short-term care, detention or diagnostic centers for delinquent children (%)
People in Group quarters - Type of juvenile institution unknown (%)
People in Group quarters - Noninstitutionalized population (%)
People in Group quarters - College dormitories (includes college quarters off campus) (%)
People in Group quarters - Military quarters (%)
People in Group quarters - On base (%)
People in Group quarters - Barracks, unaccompanied personnel housing (UPH), (Enlisted/Officer), ;and similar group living quarters for military personnel (%)
People in Group quarters - Transient quarters for temporary residents (%)
People in Group quarters - Military ships (%)
People in Group quarters - Group homes (%)
People in Group quarters - Homes or halfway houses for drug/alcohol abuse (%)
People in Group quarters - Homes for the mentally ill (%)
People in Group quarters - Homes for the mentally retarded (%)
People in Group quarters - Homes for the physically handicapped (%)
People in Group quarters - Other group homes (%)
People in Group quarters - Religious group quarters (%)
People in Group quarters - Dormitories (%)
People in Group quarters - Agriculture workers' dormitories on farms (%)
People in Group quarters - Job Corps and vocational training facilities (%)
People in Group quarters - Other workers' dormitories (%)
People in Group quarters - Crews of maritime vessels (%)
People in Group quarters - Other nonhousehold living situations (%)
People in Group quarters - Other noninstitutional group quarters (%)
Residents speaking English at home (%)
Residents speaking English at home - Born in the United States (%)
Residents speaking English at home - Native, born elsewhere (%)
Residents speaking English at home - Foreign born (%)
Residents speaking Spanish at home (%)
Residents speaking Spanish at home - Born in the United States (%)
Residents speaking Spanish at home - Native, born elsewhere (%)
Residents speaking Spanish at home - Foreign born (%)
Residents speaking other language at home (%)
Residents speaking other language at home - Born in the United States (%)
Residents speaking other language at home - Native, born elsewhere (%)
Residents speaking other language at home - Foreign born (%)
Class of Workers - Employee of private company (%)
Class of Workers - Self-employed in own incorporated business (%)
Class of Workers - Private not-for-profit wage and salary workers (%)
Class of Workers - Local government workers (%)
Class of Workers - State government workers (%)
Class of Workers - Federal government workers (%)
Class of Workers - Self-employed workers in own not incorporated business and Unpaid family workers (%)
House heating fuel used in houses and condos - Utility gas (%)
House heating fuel used in houses and condos - Bottled, tank, or LP gas (%)
House heating fuel used in houses and condos - Electricity (%)
House heating fuel used in houses and condos - Fuel oil, kerosene, etc. (%)
House heating fuel used in houses and condos - Coal or coke (%)
House heating fuel used in houses and condos - Wood (%)
House heating fuel used in houses and condos - Solar energy (%)
House heating fuel used in houses and condos - Other fuel (%)
House heating fuel used in houses and condos - No fuel used (%)
House heating fuel used in apartments - Utility gas (%)
House heating fuel used in apartments - Bottled, tank, or LP gas (%)
House heating fuel used in apartments - Electricity (%)
House heating fuel used in apartments - Fuel oil, kerosene, etc. (%)
House heating fuel used in apartments - Coal or coke (%)
House heating fuel used in apartments - Wood (%)
House heating fuel used in apartments - Solar energy (%)
House heating fuel used in apartments - Other fuel (%)
House heating fuel used in apartments - No fuel used (%)
Armed forces status - In Armed Forces (%)
Armed forces status - Civilian (%)
Armed forces status - Civilian - Veteran (%)
Armed forces status - Civilian - Nonveteran (%)
Fatal accidents locations in years 2005-2021
Fatal accidents locations in 2005
Fatal accidents locations in 2006
Fatal accidents locations in 2007
Fatal accidents locations in 2008
Fatal accidents locations in 2009
Fatal accidents locations in 2010
Fatal accidents locations in 2011
Fatal accidents locations in 2012
Fatal accidents locations in 2013
Fatal accidents locations in 2014
Fatal accidents locations in 2015
Fatal accidents locations in 2016
Fatal accidents locations in 2017
Fatal accidents locations in 2018
Fatal accidents locations in 2019
Fatal accidents locations in 2020
Fatal accidents locations in 2021
Alcohol use - People drinking some alcohol every month (%)
Alcohol use - People not drinking at all (%)
Alcohol use - Average days/month drinking alcohol
Alcohol use - Average drinks/week
Alcohol use - Average days/year people drink much
Audiometry - Average condition of hearing (%)
Audiometry - People that can hear a whisper from across a quiet room (%)
Audiometry - People that can hear normal voice from across a quiet room (%)
Audiometry - Ears ringing, roaring, buzzing (%)
Audiometry - Had a job exposure to loud noise (%)
Audiometry - Had off-work exposure to loud noise (%)
Blood Pressure & Cholesterol - Has high blood pressure (%)
Blood Pressure & Cholesterol - Checking blood pressure at home (%)
Blood Pressure & Cholesterol - Frequently checking blood cholesterol (%)
Blood Pressure & Cholesterol - Has high cholesterol level (%)
Consumer Behavior - Money monthly spent on food at supermarket/grocery store
Consumer Behavior - Money monthly spent on food at other stores
Consumer Behavior - Money monthly spent on eating out
Consumer Behavior - Money monthly spent on carryout/delivered foods
Consumer Behavior - Income spent on food at supermarket/grocery store (%)
Consumer Behavior - Income spent on food at other stores (%)
Consumer Behavior - Income spent on eating out (%)
Consumer Behavior - Income spent on carryout/delivered foods (%)
Current Health Status - General health condition (%)
Current Health Status - Blood donors (%)
Current Health Status - Has blood ever tested for HIV virus (%)
Current Health Status - Left-handed people (%)
Dermatology - People using sunscreen (%)
Diabetes - Diabetics (%)
Diabetes - Had a blood test for high blood sugar (%)
Diabetes - People taking insulin (%)
Diet Behavior & Nutrition - Diet health (%)
Diet Behavior & Nutrition - Milk product consumption (# of products/month)
Diet Behavior & Nutrition - Meals not home prepared (#/week)
Diet Behavior & Nutrition - Meals from fast food or pizza place (#/week)
Diet Behavior & Nutrition - Ready-to-eat foods (#/month)
Diet Behavior & Nutrition - Frozen meals/pizza (#/month)
Drug Use - People that ever used marijuana or hashish (%)
Drug Use - Ever used hard drugs (%)
Drug Use - Ever used any form of cocaine (%)
Drug Use - Ever used heroin (%)
Drug Use - Ever used methamphetamine (%)
Health Insurance - People covered by health insurance (%)
Kidney Conditions-Urology - Avg. # of times urinating at night
Medical Conditions - People with asthma (%)
Medical Conditions - People with anemia (%)
Medical Conditions - People with psoriasis (%)
Medical Conditions - People with overweight (%)
Medical Conditions - Elderly people having difficulties in thinking or remembering (%)
Medical Conditions - People who ever received blood transfusion (%)
Medical Conditions - People having trouble seeing even with glass/contacts (%)
Medical Conditions - People with arthritis (%)
Medical Conditions - People with gout (%)
Medical Conditions - People with congestive heart failure (%)
Medical Conditions - People with coronary heart disease (%)
Medical Conditions - People with angina pectoris (%)
Medical Conditions - People who ever had heart attack (%)
Medical Conditions - People who ever had stroke (%)
Medical Conditions - People with emphysema (%)
Medical Conditions - People with thyroid problem (%)
Medical Conditions - People with chronic bronchitis (%)
Medical Conditions - People with any liver condition (%)
Medical Conditions - People who ever had cancer or malignancy (%)
Mental Health - People who have little interest in doing things (%)
Mental Health - People feeling down, depressed, or hopeless (%)
Mental Health - People who have trouble sleeping or sleeping too much (%)
Mental Health - People feeling tired or having little energy (%)
Mental Health - People with poor appetite or overeating (%)
Mental Health - People feeling bad about themself (%)
Mental Health - People who have trouble concentrating on things (%)
Mental Health - People moving or speaking slowly or too fast (%)
Mental Health - People having thoughts they would be better off dead (%)
Oral Health - Average years since last visit a dentist
Oral Health - People embarrassed because of mouth (%)
Oral Health - People with gum disease (%)
Oral Health - General health of teeth and gums (%)
Oral Health - Average days a week using dental floss/device
Oral Health - Average days a week using mouthwash for dental problem
Oral Health - Average number of teeth
Pesticide Use - Households using pesticides to control insects (%)
Pesticide Use - Households using pesticides to kill weeds (%)
Physical Activity - People doing vigorous-intensity work activities (%)
Physical Activity - People doing moderate-intensity work activities (%)
Physical Activity - People walking or bicycling (%)
Physical Activity - People doing vigorous-intensity recreational activities (%)
Physical Activity - People doing moderate-intensity recreational activities (%)
Physical Activity - Average hours a day doing sedentary activities
Physical Activity - Average hours a day watching TV or videos
Physical Activity - Average hours a day using computer
Physical Functioning - People having limitations keeping them from working (%)
Physical Functioning - People limited in amount of work they can do (%)
Physical Functioning - People that need special equipment to walk (%)
Physical Functioning - People experiencing confusion/memory problems (%)
Physical Functioning - People requiring special healthcare equipment (%)
Prescription Medications - Average number of prescription medicines taking
Preventive Aspirin Use - Adults 40+ taking low-dose aspirin (%)
Reproductive Health - Vaginal deliveries (%)
Reproductive Health - Cesarean deliveries (%)
Reproductive Health - Deliveries resulted in a live birth (%)
Reproductive Health - Pregnancies resulted in a delivery (%)
Reproductive Health - Women breastfeeding newborns (%)
Reproductive Health - Women that had a hysterectomy (%)
Reproductive Health - Women that had both ovaries removed (%)
Reproductive Health - Women that have ever taken birth control pills (%)
Reproductive Health - Women taking birth control pills (%)
Reproductive Health - Women that have ever used Depo-Provera or injectables (%)
Reproductive Health - Women that have ever used female hormones (%)
Sexual Behavior - People 18+ that ever had sex (vaginal, anal, or oral) (%)
Sexual Behavior - Males 18+ that ever had vaginal sex with a woman (%)
Sexual Behavior - Males 18+ that ever performed oral sex on a woman (%)
Sexual Behavior - Males 18+ that ever had anal sex with a woman (%)
Sexual Behavior - Males 18+ that ever had any sex with a man (%)
Sexual Behavior - Females 18+ that ever had vaginal sex with a man (%)
Sexual Behavior - Females 18+ that ever performed oral sex on a man (%)
Sexual Behavior - Females 18+ that ever had anal sex with a man (%)
Sexual Behavior - Females 18+ that ever had any kind of sex with a woman (%)
Sexual Behavior - Average age people first had sex
Sexual Behavior - Average number of female sex partners in lifetime (males 18+)
Sexual Behavior - Average number of female vaginal sex partners in lifetime (males 18+)
Sexual Behavior - Average age people first performed oral sex on a woman (18+)
Sexual Behavior - Average number of woman performed oral sex on in lifetime (18+)
Sexual Behavior - Average number of male sex partners in lifetime (males 18+)
Sexual Behavior - Average number of male anal sex partners in lifetime (males 18+)
Sexual Behavior - Average age people first performed oral sex on a man (18+)
Sexual Behavior - Average number of male oral sex partners in lifetime (18+)
Sexual Behavior - People using protection when performing oral sex (%)
Sexual Behavior - Average number of times people have vaginal or anal sex a year
Sexual Behavior - People having sex without condom (%)
Sexual Behavior - Average number of male sex partners in lifetime (females 18+)
Sexual Behavior - Average number of male vaginal sex partners in lifetime (females 18+)
Sexual Behavior - Average number of female sex partners in lifetime (females 18+)
Sexual Behavior - Circumcised males 18+ (%)
Sleep Disorders - Average hours sleeping at night
Sleep Disorders - People that has trouble sleeping (%)
Smoking-Cigarette Use - People smoking cigarettes (%)
Taste & Smell - People 40+ having problems with smell (%)
Taste & Smell - People 40+ having problems with taste (%)
Taste & Smell - People 40+ that ever had wisdom teeth removed (%)
Taste & Smell - People 40+ that ever had tonsils teeth removed (%)
Taste & Smell - People 40+ that ever had a loss of consciousness because of a head injury (%)
Taste & Smell - People 40+ that ever had a broken nose or other serious injury to face or skull (%)
Taste & Smell - People 40+ that ever had two or more sinus infections (%)
Weight - Average height (inches)
Weight - Average weight (pounds)
Weight - Average BMI
Weight - People that are obese (%)
Weight - People that ever were obese (%)
Weight - People trying to lose weight (%)
Urban population: 74,515
Rural population: 88
Estimated median house/condo value in 2022: $368,434
77450:
$368,434Texas:
$275,400
According to our research of Texas and other state lists, there were 45 registered sex offenders living in 77450 zip code as of April 27, 2024 . The ratio of all residents to sex offenders in zip code 77450 is 1,673 to 1.The ratio of registered sex offenders to all residents in this zip code is much lower than the state average.
Median resident age: This zip code:
37.9 yearsTexas median age:
35.6 years
Average household size: This zip code:
2.8 peopleTexas:
2.6 people
Averages for the 2020 tax year for zip code 77450, filed in 2021:
Average Adjusted Gross Income (AGI) in 2020: $100,310 (Individual Income Tax Returns) Here:
$100,310State:
$77,054
Salary/wage: $89,607 (reported on 82.5% of returns )Here:
$89,607State:
$62,766
(% of AGI for various income ranges: 1098.5% for AGIs below $25k , 3534.8% for AGIs $25k-50k , 6398.1% for AGIs $50k-75k , 9540.1% for AGIs $75k-100k , 18126.3% for AGIs $100k-200k , 78318.9% for AGIs over 200k ) Taxable interest for individuals: $2,205 (reported on 31.9% of returns )This zip code:
$2,205Texas:
$2,665
(% of AGI for various income ranges: 15.0% for AGIs below $25k , 23.9% for AGIs $25k-50k , 39.7% for AGIs $50k-75k , 76.6% for AGIs $75k-100k , 125.0% for AGIs $100k-200k , 953.5% for AGIs over 200k ) Ordinary dividends: $7,967 (reported on 26.4% of returns )(% of AGI for various income ranges: 29.3% for AGIs below $25k , 46.1% for AGIs $25k-50k , 86.8% for AGIs $50k-75k , 159.5% for AGIs $75k-100k , 384.9% for AGIs $100k-200k , 3154.7% for AGIs over 200k ) Net capital gain/loss in AGI: +$19,478 (reported on 24.9% of returns )Here:
+$19,478State:
+$39,590
(% of AGI for various income ranges: 16.5% for AGIs below $25k , 36.5% for AGIs $25k-50k , 90.1% for AGIs $50k-75k , 166.3% for AGIs $75k-100k , 508.8% for AGIs $100k-200k , 9335.3% for AGIs over 200k ) Profit/loss from business: +$13,803 (reported on 23.5% of returns )Here:
+$13,803State:
+$10,888
(% of AGI for various income ranges: 170.0% for AGIs below $25k , 270.0% for AGIs $25k-50k , 316.6% for AGIs $50k-75k , 437.0% for AGIs $75k-100k , 705.0% for AGIs $100k-200k , 2579.0% for AGIs over 200k ) Taxable individual retirement arrangement distribution: $40,310 (reported on 9.1% of returns )77450:
$40,310Texas:
$24,740
(% of AGI for various income ranges: 40.8% for AGIs below $25k , 124.3% for AGIs $25k-50k , 235.7% for AGIs $50k-75k , 500.4% for AGIs $75k-100k , 1086.9% for AGIs $100k-200k , 3757.8% for AGIs over 200k ) Self-employed (Keogh) retirement plans: $27,405 (reported on 0.7% of returns )77450:
$27,405Texas:
$29,298
(% of AGI for various income ranges: 16.5% for AGIs $50k-75k , 29.3% for AGIs $100k-200k , 306.0% for AGIs over 200k ) Total itemized deductions: $38,452 (reported on 9.0% of returns )Here:
$38,452State:
$40,428
(% of AGI for various income ranges: 39.7% for AGIs below $25k , 125.4% for AGIs $25k-50k , 283.8% for AGIs $50k-75k , 472.6% for AGIs $75k-100k , 755.2% for AGIs $100k-200k , 4077.3% for AGIs over 200k ) Charity contributions: $16,698 (reported on 7.5% of returns )Here:
$16,698State:
$18,201
(% of AGI for various income ranges: 2.2% for AGIs below $25k , 18.6% for AGIs $25k-50k , 53.7% for AGIs $50k-75k , 96.2% for AGIs $75k-100k , 230.7% for AGIs $100k-200k , 1965.9% for AGIs over 200k ) Taxes paid: $8,292 (reported on 8.7% of returns )(% of AGI for various income ranges: 7.0% for AGIs below $25k , 27.8% for AGIs $25k-50k , 64.1% for AGIs $50k-75k , 111.2% for AGIs $75k-100k , 188.6% for AGIs $100k-200k , 752.1% for AGIs over 200k ) Earned income credit: $2,261 (reported on 13.2% of returns )(% of AGI for various income ranges: 87.7% for AGIs below $25k , 76.3% for AGIs $25k-50k , 1.3% for AGIs $50k-75k ) Percentage of individuals using paid preparers for their 2020 taxes: 91.1%(% for various income ranges: 90.6% for AGIs below $25k , 92.3% for AGIs $25k-50k , 90.9% for AGIs $50k-75k , 91.2% for AGIs $75k-100k , 90.4% for AGIs $100k-200k , 91.4% for AGIs over 200k )
Averages for the 2012 tax year for zip code 77450, filed in 2013:
Average Adjusted Gross Income (AGI) in 2012: $105,625 (Individual Income Tax Returns) Here:
$105,625State:
$65,384
Salary/wage: $93,008 (reported on 88.5% of returns )Here:
$93,008State:
$52,524
(% of AGI for various income ranges: 80.6% for AGIs below $25k , 84.5% for AGIs $25k-50k , 83.1% for AGIs $50k-75k , 82.9% for AGIs $75k-100k , 85.7% for AGIs $100k-200k , 71.1% for AGIs over 200k ) Taxable interest for individuals: $1,563 (reported on 37.9% of returns )This zip code:
$1,563Texas:
$2,372
(% of AGI for various income ranges: 1.0% for AGIs below $25k , 0.5% for AGIs $25k-50k , 0.5% for AGIs $50k-75k , 0.5% for AGIs $75k-100k , 0.4% for AGIs $100k-200k , 0.7% for AGIs over 200k ) Ordinary dividends: $6,612 (reported on 27.3% of returns )(% of AGI for various income ranges: 2.1% for AGIs below $25k , 0.8% for AGIs $25k-50k , 0.9% for AGIs $50k-75k , 0.9% for AGIs $75k-100k , 1.0% for AGIs $100k-200k , 2.4% for AGIs over 200k ) Net capital gain/loss in AGI: +$23,247 (reported on 22.7% of returns )Here:
+$23,247State:
+$35,319
(% of AGI for various income ranges: 0.1% for AGIs below $25k , 0.3% for AGIs $25k-50k , 0.4% for AGIs $50k-75k , 0.5% for AGIs $75k-100k , 0.9% for AGIs $100k-200k , 9.6% for AGIs over 200k ) Profit/loss from business: +$23,098 (reported on 18.8% of returns )Here:
+$23,098State:
+$13,732
(% of AGI for various income ranges: 11.5% for AGIs below $25k , 5.7% for AGIs $25k-50k , 4.2% for AGIs $50k-75k , 4.2% for AGIs $75k-100k , 3.4% for AGIs $100k-200k , 3.9% for AGIs over 200k ) Taxable individual retirement arrangement distribution: $25,234 (reported on 8.2% of returns )77450:
$25,234Texas:
$19,511
(% of AGI for various income ranges: 2.6% for AGIs below $25k , 1.9% for AGIs $25k-50k , 2.4% for AGIs $50k-75k , 2.6% for AGIs $75k-100k , 2.6% for AGIs $100k-200k , 1.4% for AGIs over 200k ) Self-employment retirement plans: $24,330 (reported on 1.0% of returns )77450:
$24,330Texas:
$23,938
(% of AGI for various income ranges: 0.1% for AGIs $25k-50k , 0.1% for AGIs $75k-100k , 0.2% for AGIs $100k-200k , 0.3% for AGIs over 200k ) Total itemized deductions: $25,070 (13% of AGI, reported on 39.8% of returns )Here:
$25,070State:
$24,724
Here:
13.4% of AGIState:
15.9% of AGI
(% of AGI for various income ranges: 9.4% for AGIs below $25k , 10.8% for AGIs $25k-50k , 11.6% for AGIs $50k-75k , 10.9% for AGIs $75k-100k , 10.9% for AGIs $100k-200k , 8.0% for AGIs over 200k ) Charity contributions: $6,659 (reported on 32.9% of returns )(% of AGI for various income ranges: 0.6% for AGIs below $25k , 1.2% for AGIs $25k-50k , 1.5% for AGIs $50k-75k , 1.6% for AGIs $75k-100k , 2.0% for AGIs $100k-200k , 2.5% for AGIs over 200k ) Taxes paid: $8,353 (reported on 39.4% of returns )(% of AGI for various income ranges: 2.2% for AGIs below $25k , 2.9% for AGIs $25k-50k , 3.3% for AGIs $50k-75k , 3.6% for AGIs $75k-100k , 4.0% for AGIs $100k-200k , 2.6% for AGIs over 200k ) Earned income credit: $2,188 (reported on 10.7% of returns )(% of AGI for various income ranges: 5.2% for AGIs below $25k , 1.1% for AGIs $25k-50k ) Percentage of individuals using paid preparers for their 2012 taxes: 41.3%(% for various income ranges: 38.0% for AGIs below $25k , 41.9% for AGIs $25k-50k , 40.0% for AGIs $50k-75k , 40.8% for AGIs $75k-100k , 39.9% for AGIs $100k-200k , 52.3% for AGIs over 200k )
Averages for the 2004 tax year for zip code 77450, filed in 2005:
Average Adjusted Gross Income (AGI) in 2004: $76,509 (Individual Income Tax Returns) Here:
$76,509State:
$47,881
Salary/wage: $72,360 (reported on 88.9% of returns )Here:
$72,360State:
$41,947
(% of AGI for various income ranges: 191.9% for AGIs below $10k , 80.0% for AGIs $10k-25k , 86.2% for AGIs $25k-50k , 87.2% for AGIs $50k-75k , 89.2% for AGIs $75k-100k , 81.7% for AGIs over 100k ) Taxable interest for individuals: $1,409 (reported on 50.3% of returns )This zip code:
$1,409Texas:
$2,255
(% of AGI for various income ranges: 9.9% for AGIs below $10k , 2.3% for AGIs $10k-25k , 1.1% for AGIs $25k-50k , 0.8% for AGIs $50k-75k , 0.7% for AGIs $75k-100k , 0.8% for AGIs over 100k ) Taxable dividends: $2,658 (reported on 32.1% of returns )(% of AGI for various income ranges: 8.1% for AGIs below $10k , 1.3% for AGIs $10k-25k , 0.8% for AGIs $25k-50k , 0.7% for AGIs $50k-75k , 0.7% for AGIs $75k-100k , 1.2% for AGIs over 100k ) Net capital gain/loss: +$10,680 (reported on 27.8% of returns )Here:
+$10,680State:
+$16,110
(% of AGI for various income ranges: -3.5% for AGIs below $10k , 0.8% for AGIs $10k-25k , 0.4% for AGIs $25k-50k , 0.4% for AGIs $50k-75k , 0.5% for AGIs $75k-100k , 5.8% for AGIs over 100k ) Profit/loss from business: +$16,053 (reported on 18.3% of returns )Here:
+$16,053State:
+$11,013
(% of AGI for various income ranges: 0.4% for AGIs below $10k , 9.3% for AGIs $10k-25k , 4.7% for AGIs $25k-50k , 3.8% for AGIs $50k-75k , 3.0% for AGIs $75k-100k , 3.7% for AGIs over 100k ) IRA payment deduction: $3,314 (reported on 3.4% of returns )(% of AGI for various income ranges: 0.9% for AGIs below $10k , 0.2% for AGIs $10k-25k , 0.3% for AGIs $25k-50k , 0.2% for AGIs $50k-75k , 0.2% for AGIs $75k-100k , 0.1% for AGIs over 100k ) Self-employed pension: $15,478 (reported on 1.3% of returns )Here:
$15,478Texas:
$16,401
(% of AGI for various income ranges: 0.1% for AGIs $25k-50k , 0.1% for AGIs $50k-75k , 0.2% for AGIs $75k-100k , 0.3% for AGIs over 100k ) Total itemized deductions: $20,135 (17% of AGI, reported on 48.8% of returns )Here:
$20,135State:
$19,631
Here:
17.1% of AGIState:
18.9% of AGI
(% of AGI for various income ranges: 21.6% for AGIs below $10k , 15.8% for AGIs $10k-25k , 15.5% for AGIs $25k-50k , 16.5% for AGIs $50k-75k , 16.1% for AGIs $75k-100k , 11.1% for AGIs over 100k ) Charity contributions deductions: $3,882 (3% of AGI, reported on 41.9% of returns )Here:
3.1% of AGIState:
4.2% of AGI
(% of AGI for various income ranges: 0.9% for AGIs below $10k , 1.1% for AGIs $10k-25k , 1.5% for AGIs $25k-50k , 2.0% for AGIs $50k-75k , 2.2% for AGIs $75k-100k , 2.3% for AGIs over 100k ) Total tax: $14,508 (reported on 79.7% of returns )77450:
$14,508State:
$9,058
(% of AGI for various income ranges: 5.9% for AGIs below $10k , 4.9% for AGIs $10k-25k , 6.8% for AGIs $25k-50k , 8.5% for AGIs $50k-75k , 10.0% for AGIs $75k-100k , 18.9% for AGIs over 100k ) Earned income credit: $1,771 (reported on 7.7% of returns )Percentage of individuals using paid preparers for their 2004 taxes: 41.8%(% for various income ranges: 33.5% for AGIs below $10k , 49.3% for AGIs $10k-25k , 45.8% for AGIs $25k-50k , 42.1% for AGIs $50k-75k , 39.5% for AGIs $75k-100k , 42.3% for AGIs over 100k )
Estimated median household income in 2022: This zip code:
$102,183Texas:
$72,284
Nearest zip codes: 77094 ,
77407 ,
77494 ,
77449 ,
77082 ,
77083 .
Houston Zip Code Map
Percentage of family households: This zip code:
58.2%Texas:
50.5%
Percentage of households with unmarried partners: This zip code:
3.0%Texas:
48.7%
Likely homosexual households (counted as self-reported same-sex unmarried-partner households)
Lesbian couples: 0.1% of all households Gay men: 0.1% of all households
Household received Food Stamps/SNAP in the past 12 months: 878Household did not receive Food Stamps/SNAP in the past 12 months: 25,361
Women who had a birth in the past 12 months: 580 (578 now married , 11 unmarried) Women who did not have a birth in the past 12 months: 17,964 (9,611 now married , 8,299 unmarried)
Housing units in zip code 77450 with a mortgage: 10,824 (815
second mortgage , 74
home equity loan , 469
both second mortgage and home equity loan )
Houses without a mortgage: 421
Median monthly owner costs for units with a mortgage: $2,342
Median monthly owner costs for units without a mortgage: $972
Residents with income below the poverty level in 2022:
This zip code:
7.3%Whole state:
14.0%
Residents with income below 50% of the poverty level in 2022:
This zip code:
4.8%Whole state:
7.4%
Median number of rooms in houses and condos: Median number of rooms in apartments: Notable locations in this zip code not listed on our city pages
Click to draw/clear zip code borders Notable locations in zip code 77450: (A) , James E Taylor High School Basketball Gym (B) , West Interstate 10 Fire Department Station 3 (C) , West Interstate 10 Fire Department Station 1 (D) , West Interstate 10 Fire Department Station 2 (E) . Display/hide their locations on the map
Shopping Centers: (1) , Kingsland Village Shopping Center (2) , Mason Creek Village Shopping Center (3) , Mason Park Center Shopping Center (4) , Mason Village Shopping Center (5) , One Mason Plaza Shopping Center (6) . Display/hide their locations on the map
Churches in zip code 77450 include: (A) , Cornerstone Evangelical Presbyterian Church (B) , Epiphany of the Lord Catholic Community Church (C) , Family Life Assembly of God Church (D) , Kingsland Baptist Church (E) , Grace Fellowship United Methdist Church (F) , Saint Peters United Methodist Church (G) , Mason Creek Community Church (H) , New Vision Baptist Church (I) . Display/hide their locations on the map
Streams, rivers, and creeks: (A) , Little Prong (B) . Display/hide their locations on the map
Parks in zip code 77450 include: (1) , James E Taylor High School Baseball Field (2) . Display/hide their locations on the map
Year house built (houses)
27 2020 or later2,293 2010 to 20197,546 2000 to 20096,328 1990 to 19994,615 1980 to 19894,687 1970 to 1979177 1960 to 196958 1950 to 1959103 1940 to 194994 1939 or earlier
Zip code 77450 household income distribution in 2022 503 Less than $10,000334 $10,000 to $14,999514 $15,000 to $19,999395 $20,000 to $24,999584 $25,000 to $29,999895 $30,000 to $34,999847 $35,000 to $39,999819 $40,000 to $44,999723 $45,000 to $49,9991,541 $50,000 to $59,9992,256 $60,000 to $74,9993,452 $75,000 to $99,9993,132 $100,000 to $124,9992,651 $125,000 to $149,9992,701 $150,000 to $199,9994,897 $200,000 or moreEstimate of home value of owner-occupied houses/condos in 2022 in zip code 77450 188 Less than $10,00018 $15,000 to $19,99916 $20,000 to $24,99963 $40,000 to $49,999101 $80,000 to $89,9999 $90,000 to $99,999182 $100,000 to $124,99995 $125,000 to $149,999334 $150,000 to $174,999654 $175,000 to $199,9993,009 $200,000 to $249,9993,088 $250,000 to $299,9995,067 $300,000 to $399,9992,954 $400,000 to $499,9993,358 $500,000 to $749,999324 $750,000 to $999,999172 $1,000,000 to $1,499,99961 $1,500,000 to $1,999,999178 $2,000,000 or moreRent paid by renters in 2022 in zip code 77450 12 $650 to $69916 $700 to $74982 $800 to $899370 $900 to $9991,837 $1,000 to $1,2492,006 $1,250 to $1,4992,897 $1,500 to $1,999548 $2,000 to $2,499189 $2,500 to $2,99993 $3,000 to $3,499239 $3,500 or more81 No cash rent
Median gross rent in 2022: $1,692.
Median price asked for vacant for-sale houses and condos in 2022: $287,988.
Estimated median house (or condo) value in 2022 for: White Non-Hispanic householders: $372,060Black or African American householders: $377,638American Indian or Alaska Native householders: $422,263Asian householders: $409,433Native Hawaiian and other Pacific Islander householders: $976,169Some other race householders: $327,156Two or more races householders: $369,828Hispanic or Latino householders: $294,524Estimated median house or condo value in 2022: $368,434
77450:
$368,434Texas:
$275,400
Lower value quartile - upper value quartile: $279,632 - $501,131
Mean price in 2022: Detached houses: $426,038Here:
$426,038State:
$369,058
Townhouses or other attached units: $286,816Here:
$286,816State:
$327,631
In 5-or-more-unit structures: $88,168Here:
$88,168State:
$413,944
Mobile homes: $332,933Here:
$332,933State:
$124,413
Housing units in structures:
One, detached: 20,456One, attached: 98Two: 993 or 4: 2895 to 9: 1,05210 to 19: 1,39420 to 49: 1,30350 or more: 2,452Mobile homes: 100Unemployment : 4.0%
Means of transportation to work in zip code 77450 72.1% 26,577 Drove a car alone7.8% 2,869 Carpooled0.7% 264 Bus or trolley bus0.0% 15 Taxi0.5% 171 Bicycle1.0% 355 Walked0.6% 236 Other means17.8% 6,556 Worked at homeTravel time to work (commute) in zip code 77450 547 Less than 5 minutes1,838 5 to 9 minutes2,699 10 to 14 minutes4,036 15 to 19 minutes3,447 20 to 24 minutes1,846 25 to 29 minutes5,175 30 to 34 minutes989 35 to 39 minutes1,948 40 to 44 minutes4,410 45 to 59 minutes3,193 60 to 89 minutes491 90 or more minutes
Percentage of zip code residents living and working in this county: 69.4%
Household type by relationship:
Households: 74,604
Male householders: 14,719 (1,988 living alone ), Female householders: 11,608 (2,563 living alone )16,550 spouses (16,417 opposite-sex spouses ), 1,319 unmarried partners , (1,257 opposite-sex unmarried partners ), 25,342 children (24,048 natural , 554 adopted , 737 stepchildren ), 1,104 grandchildren , 466 brothers or sisters , 1,623 parents , 0 foster children , 990 other relatives , 847 non-relatives In group quarters: 59 (-1 institutionalized population )
Size of family households: 7,087 2-persons , 5,765 3-persons , 4,757 4-persons , 2,196 5-persons , 572 6-persons , 202 7-or-more-persons
Size of nonfamily households: 4,551 1-person , 978 2-persons , 48 3-persons , 24 4-persons , 26 7-or-more-persons
16,032 married couples with children. single-parent households (575 men , 2,435 women ).
66.6% of residents of 77450 zip code speak English at home. of residents speak Spanish at home (67% very well, 19% well, 10% not well, 4% not at all ).of residents speak other Indo-European language at home (64% very well, 28% well, 6% not well, 1% not at all ).of residents speak Asian or Pacific Island language at home (59% very well, 24% well, 13% not well, 4% not at all ).of residents speak other language at home (86% very well, 9% well, 3% not well, 3% not at all ).
Foreign born population: 20,008 (26.8%)
(47.4%
of them are naturalized citizens )
This zip code:
26.8%Whole state:
17.2%
14% Uruguay 7% Honduras 7% Bhutan 6% Chile 5% Sweden 4% Japan 4% Liberia 9% German 6% English 6% American 3% Irish 2% Nigerian 2% Italian 2% European
Year of entry for the foreign-born population
12,428 2010 or later 4,214 2000 to 2009 2,955 1990 to 1999 3,415 Before 1990
There are
427 Other Medical Specialists in Zip Code 77450.
Housing units lacking complete plumbing facilities: 0.4%
Housing units lacking complete kitchen facilities: 1.1%
59.5% Utility gas 39.1% Electricity 0.9% Bottled, tank, or LP gas
Population in 1990: 28,533. Population change in the 1990s: +19,641 (+68.8%).
Place of birth for U.S.-born residents:
This state: 32,900Northeast: 3,368Midwest: 4,558South: 7,681West: 4,457
45% of the 77450 zip code residents lived in the same house 5 years ago.
Out of people who lived in different houses, 45% lived in this county.
Out of people who lived in different counties, 50% lived in Texas.
86% of the 77450 zip code residents lived in the same house 1 year ago.
Out of people who lived in different houses, 40% moved from this county.
Out of people who lived in different houses, 24% moved from different county within same state.
Out of people who lived in different houses, 20% moved from different state.
Out of people who lived in different houses, 19% moved from abroad.
Private vs. public school enrollment:
Students in private schools in grades 1 to 8 (elementary and middle school): 534
Students in private schools in grades 9 to 12 (high school): 279
Students in private undergraduate colleges: 695
Occupation by median earnings in the past 12 months ($)
114,415 Computer and mathematical occupations 104,889 Management occupations 102,436 Architecture and engineering occupations 91,408 Life, physical, and social science occupations 87,317 Health diagnosing and treating practitioners and other technical occupations 77,916 Legal occupations
Companies with federal contracts located in this zip code:
AMJAY CORPORATION (1614 HANNINGTON DRIVE in KATY, TX; small business) in 98 contracts from 1999 to 2006
Contracts for Miscellaneous Chemical Specialties, Chemicals, Pest Control Agents and Disinfectants, Engine Electrical System Components, Aircraft Prime Moving by Defense Logistics Agency, Army, Navy, Forest Service, and others Signed by year: 2000: $167,287; 2001: $526,128; 2002: $92,569; 2003: $588,964; 2004: $411,573; 2005: $489,698; 2006: $682,755.
Biggest contracts: with Defense Logistics Agency for Miscellaneous Chemical Specialties. Signed on 2001-04-04. Completion date: 2001-06-03.
with Army for Chemicals. Signed on 2006-04-18. Completion date: 2006-05-22.
, same as above. Signed on 2006-03-06. Completion date: 2006-04-10.
, same as above. Signed on 2003-06-10. Completion date: 2003-09-01.
INTERSOFT INTERNATIONAL INC (2503 SARA RIDGE LN in KATY, TX; small business)
$100,560 with Army for ADP Support Equipment. Signed on 2005-08-29. Completion date: 2005-09-30.
Thomas O. Miesner (725 Cheltenham Drive in Katy, TX; small business)
$57,500 with Offices, Boards and Divisions (includes Attorney General, Deputy Attorney General, etc.) for Expert Witness. Signed on 2005-01-12. Completion date: 2007-01-11.
NGUYEN, TUAN (739 RED ROCK CANYON in KATY, TX; small business)
$12,205 with Army for Maintenance, Repair or Alteration of Real Property -- Other Administrative Facilities and Service Buildings. Signed on 2005-09-23. Completion date: 2005-10-08.
Top industries in this zip code by the number of employees in 2005:
Accommodation and Food Services: Limited-Service Restaurants (100-249 employees: 1 establishment, 50-99 employees: 5 establishments, 20-49 employees: 14 establishments, 10-19 employees: 5 establishments, 5-9 employees: 2 establishments, 1-4 employees: 5 establishments)Accommodation and Food Services: Full-Service Restaurants (50-99: 5, 20-49: 10, 10-19: 8, 5-9: 4, 1-4: 6)Health Care and Social Assistance: General Medical and Surgical Hospitals (500-999: 1)Health Care and Social Assistance: Child Day Care Services (50-99: 1, 20-49: 6, 10-19: 7, 5-9: 1, 1-4: 5)Health Care and Social Assistance: Offices of Physicians (except Mental Health Specialists) (20-49: 3, 10-19: 10, 5-9: 11, 1-4: 27)Health Care and Social Assistance: Offices of Dentists (20-49: 3, 10-19: 10, 5-9: 15, 1-4: 13)Other Services (except Public Administration): Religious Organizations (50-99: 1, 20-49: 4, 10-19: 2, 5-9: 1, 1-4: 7)
People in group quarters in 2010:
7 people in residential treatment centers for adults
6 people in group homes intended for adults
Fatal accident statistics in 2013:
Fatal accident count: 1Vehicles involved in fatal accidents: 1Fatal accidents caused by drunken drivers: 1Fatalities: 1Persons involved in fatal accidents: 2Pedestrians involved in fatal accidents: 0
Fatal accident statistics in 2012:
Fatal accident count: 4Vehicles involved in fatal accidents: 6Fatal accidents caused by drunken drivers: 0Fatalities: 4Persons involved in fatal accidents: 14Pedestrians involved in fatal accidents: 1
Home Mortgage Disclosure Act Aggregated Statistics For Year 2009(Based on 10 full and 6 partial tracts) A) FHA, FSA/RHS & VA B) Conventional C) Refinancings D) Home Improvement Loans F) Non-occupant Loans on G) Loans On Manufactured Number Average Value Number Average Value Number Average Value Number Average Value Number Average Value Number Average Value
LOANS ORIGINATED 467 $163,921 1,059 $196,414 2,539 $186,133 138 $76,462 110 $133,744 2 $154,820 APPLICATIONS APPROVED, NOT ACCEPTED 28 $170,752 79 $189,635 251 $184,840 25 $49,649 15 $167,591 1 $149,660 APPLICATIONS DENIED 64 $150,980 127 $177,919 729 $170,139 121 $52,242 50 $115,954 0 $0 APPLICATIONS WITHDRAWN 62 $170,579 162 $210,828 537 $177,892 41 $57,007 18 $119,443 0 $0 FILES CLOSED FOR INCOMPLETENESS 15 $122,530 15 $253,475 151 $165,860 10 $26,690 6 $117,947 0 $0
Aggregated Statistics For Year 2008(Based on 10 full and 6 partial tracts) A) FHA, FSA/RHS & VA B) Conventional C) Refinancings D) Home Improvement Loans E) Loans on Dwellings For 5+ Families F) Non-occupant Loans on G) Loans On Manufactured Number Average Value Number Average Value Number Average Value Number Average Value Number Average Value Number Average Value Number Average Value
LOANS ORIGINATED 313 $168,703 1,678 $185,859 952 $165,951 229 $46,075 4 $17,817,822 214 $140,572 5 $44,286 APPLICATIONS APPROVED, NOT ACCEPTED 16 $160,276 188 $194,687 155 $159,191 62 $45,779 0 $0 19 $210,025 6 $84,822 APPLICATIONS DENIED 42 $151,085 192 $159,032 537 $151,671 237 $48,114 0 $0 70 $109,076 1 $31,010 APPLICATIONS WITHDRAWN 56 $150,802 237 $193,751 312 $157,499 39 $64,293 2 $21,287,750 31 $119,457 0 $0 FILES CLOSED FOR INCOMPLETENESS 13 $148,360 45 $162,881 63 $168,777 5 $210,732 0 $0 12 $146,003 0 $0
Aggregated Statistics For Year 2007(Based on 10 full and 6 partial tracts) A) FHA, FSA/RHS & VA B) Conventional C) Refinancings D) Home Improvement Loans E) Loans on Dwellings For 5+ Families F) Non-occupant Loans on G) Loans On Manufactured Number Average Value Number Average Value Number Average Value Number Average Value Number Average Value Number Average Value Number Average Value
LOANS ORIGINATED 104 $147,234 3,059 $156,941 968 $147,232 386 $48,686 4 $20,653,050 258 $121,431 1 $67,000 APPLICATIONS APPROVED, NOT ACCEPTED 10 $146,648 419 $166,201 183 $162,916 120 $50,209 0 $0 37 $95,566 3 $72,843 APPLICATIONS DENIED 21 $146,418 429 $149,031 882 $150,031 288 $42,505 0 $0 74 $126,577 6 $48,858 APPLICATIONS WITHDRAWN 12 $168,718 265 $170,610 448 $147,163 43 $77,549 0 $0 34 $92,299 0 $0 FILES CLOSED FOR INCOMPLETENESS 1 $117,000 83 $159,350 166 $168,863 10 $58,516 0 $0 12 $101,748 0 $0
Aggregated Statistics For Year 2006(Based on 10 full and 6 partial tracts) A) FHA, FSA/RHS & VA B) Conventional C) Refinancings D) Home Improvement Loans E) Loans on Dwellings For 5+ Families F) Non-occupant Loans on G) Loans On Manufactured Number Average Value Number Average Value Number Average Value Number Average Value Number Average Value Number Average Value Number Average Value
LOANS ORIGINATED 118 $148,616 4,351 $131,205 1,046 $141,475 354 $45,125 2 $13,004,880 417 $104,830 14 $40,471 APPLICATIONS APPROVED, NOT ACCEPTED 10 $146,557 717 $125,087 228 $129,207 113 $45,881 0 $0 88 $103,176 4 $32,800 APPLICATIONS DENIED 17 $145,556 812 $129,517 962 $141,036 345 $41,122 0 $0 147 $100,847 27 $39,611 APPLICATIONS WITHDRAWN 38 $153,057 476 $143,660 687 $152,202 55 $60,442 0 $0 72 $103,250 2 $134,695 FILES CLOSED FOR INCOMPLETENESS 4 $108,485 135 $138,271 242 $165,230 8 $28,680 0 $0 16 $114,781 0 $0
Aggregated Statistics For Year 2005(Based on 10 full and 6 partial tracts) A) FHA, FSA/RHS & VA B) Conventional C) Refinancings D) Home Improvement Loans E) Loans on Dwellings For 5+ Families F) Non-occupant Loans on G) Loans On Manufactured Number Average Value Number Average Value Number Average Value Number Average Value Number Average Value Number Average Value Number Average Value
LOANS ORIGINATED 133 $139,129 4,039 $124,306 1,473 $128,407 297 $55,747 3 $15,595,553 362 $98,349 2 $51,090 APPLICATIONS APPROVED, NOT ACCEPTED 12 $153,942 596 $120,216 224 $138,238 62 $41,660 0 $0 38 $115,259 2 $70,445 APPLICATIONS DENIED 16 $126,146 786 $138,640 1,290 $132,528 289 $44,947 0 $0 137 $122,506 7 $37,670 APPLICATIONS WITHDRAWN 26 $137,890 471 $137,374 688 $156,538 180 $248,546 0 $0 81 $121,581 2 $71,000 FILES CLOSED FOR INCOMPLETENESS 2 $127,725 122 $147,527 561 $148,920 8 $142,445 0 $0 26 $110,300 0 $0
Aggregated Statistics For Year 2004(Based on 10 full and 6 partial tracts) A) FHA, FSA/RHS & VA B) Conventional C) Refinancings D) Home Improvement Loans E) Loans on Dwellings For 5+ Families F) Non-occupant Loans on G) Loans On Manufactured Number Average Value Number Average Value Number Average Value Number Average Value Number Average Value Number Average Value Number Average Value
LOANS ORIGINATED 154 $134,574 3,543 $129,006 2,709 $131,840 314 $46,196 2 $22,200,000 367 $100,530 3 $19,967 APPLICATIONS APPROVED, NOT ACCEPTED 23 $114,080 655 $119,031 478 $134,585 65 $52,738 0 $0 62 $99,242 3 $38,140 APPLICATIONS DENIED 39 $121,301 651 $134,758 1,328 $132,646 303 $42,568 2 $8,121,000 84 $105,738 14 $56,983 APPLICATIONS WITHDRAWN 81 $122,466 565 $124,960 823 $134,525 51 $37,937 2 $117,955 89 $89,653 1 $52,000 FILES CLOSED FOR INCOMPLETENESS 3 $83,810 128 $135,448 708 $150,792 13 $57,621 0 $0 17 $103,719 0 $0
Aggregated Statistics For Year 2003(Based on 10 full and 6 partial tracts) A) FHA, FSA/RHS & VA B) Conventional C) Refinancings D) Home Improvement Loans E) Loans on Dwellings For 5+ Families F) Non-occupant Loans on Number Average Value Number Average Value Number Average Value Number Average Value Number Average Value Number Average Value
LOANS ORIGINATED 200 $133,116 3,512 $140,758 7,282 $133,937 351 $37,989 1 $15,745,000 313 $98,208 APPLICATIONS APPROVED, NOT ACCEPTED 7 $124,707 400 $135,231 888 $124,203 112 $38,014 0 $0 42 $93,042 APPLICATIONS DENIED 61 $133,683 471 $132,126 2,309 $127,793 290 $30,769 1 $630,000 85 $111,531 APPLICATIONS WITHDRAWN 83 $135,295 500 $155,042 1,146 $128,407 32 $54,160 0 $0 47 $107,506 FILES CLOSED FOR INCOMPLETENESS 4 $112,175 113 $160,767 262 $141,786 5 $74,282 0 $0 14 $101,481
Aggregated Statistics For Year 1999(Based on 3 partial tracts) A) FHA, FSA/RHS & VA B) Conventional C) Refinancings D) Home Improvement Loans E) Loans on Dwellings For 5+ Families F) Non-occupant Loans on Number Average Value Number Average Value Number Average Value Number Average Value Number Average Value Number Average Value
LOANS ORIGINATED 133 $97,959 884 $126,675 254 $96,461 102 $24,578 1 $13,160,000 30 $74,492 APPLICATIONS APPROVED, NOT ACCEPTED 6 $115,252 96 $112,166 54 $91,395 21 $18,540 0 $0 7 $59,806 APPLICATIONS DENIED 7 $116,359 112 $113,440 80 $105,566 65 $22,291 0 $0 9 $60,454 APPLICATIONS WITHDRAWN 10 $114,855 87 $135,952 70 $91,776 11 $21,042 0 $0 6 $47,977 FILES CLOSED FOR INCOMPLETENESS 1 $84,480 26 $130,464 27 $116,263 4 $18,535 0 $0 2 $83,720
Private Mortgage Insurance Companies Aggregated Statistics For Year 2009(Based on 10 full and 6 partial tracts) A) Conventional B) Refinancings C) Non-occupant Loans on Number Average Value Number Average Value Number Average Value
LOANS ORIGINATED 193 $209,772 91 $211,010 0 $0 APPLICATIONS APPROVED, NOT ACCEPTED 43 $222,844 38 $216,293 1 $82,310 APPLICATIONS DENIED 32 $203,808 13 $211,972 4 $168,635 APPLICATIONS WITHDRAWN 10 $195,497 4 $163,830 0 $0 FILES CLOSED FOR INCOMPLETENESS 0 $0 0 $0 0 $0
Aggregated Statistics For Year 2008(Based on 10 full and 6 partial tracts) A) Conventional B) Refinancings C) Non-occupant Loans on Number Average Value Number Average Value Number Average Value
LOANS ORIGINATED 514 $197,816 67 $169,235 43 $137,698 APPLICATIONS APPROVED, NOT ACCEPTED 82 $188,735 45 $155,752 6 $148,597 APPLICATIONS DENIED 22 $183,388 12 $140,494 21 $152,026 APPLICATIONS WITHDRAWN 13 $153,155 10 $230,282 1 $139,180 FILES CLOSED FOR INCOMPLETENESS 10 $195,853 5 $152,452 5 $197,152
Aggregated Statistics For Year 2007(Based on 10 full and 6 partial tracts) A) Conventional B) Refinancings C) Non-occupant Loans on Number Average Value Number Average Value Number Average Value
LOANS ORIGINATED 593 $176,840 83 $151,345 37 $124,792 APPLICATIONS APPROVED, NOT ACCEPTED 63 $182,041 30 $206,225 4 $115,395 APPLICATIONS DENIED 12 $134,850 0 $0 5 $131,106 APPLICATIONS WITHDRAWN 26 $180,411 8 $152,890 1 $111,190 FILES CLOSED FOR INCOMPLETENESS 0 $0 0 $0 0 $0
Aggregated Statistics For Year 2006(Based on 10 full and 6 partial tracts) A) Conventional B) Refinancings C) Non-occupant Loans on Number Average Value Number Average Value Number Average Value
LOANS ORIGINATED 364 $163,540 42 $158,806 30 $118,615 APPLICATIONS APPROVED, NOT ACCEPTED 57 $173,171 24 $195,961 3 $117,527 APPLICATIONS DENIED 4 $110,445 2 $161,015 1 $155,650 APPLICATIONS WITHDRAWN 16 $179,555 7 $208,306 2 $274,675 FILES CLOSED FOR INCOMPLETENESS 4 $157,875 0 $0 0 $0
Aggregated Statistics For Year 2005(Based on 10 full and 6 partial tracts) A) Conventional B) Refinancings C) Non-occupant Loans on Number Average Value Number Average Value Number Average Value
LOANS ORIGINATED 430 $152,684 97 $146,582 39 $119,718 APPLICATIONS APPROVED, NOT ACCEPTED 82 $136,872 27 $152,801 14 $105,358 APPLICATIONS DENIED 11 $132,137 1 $113,460 3 $92,790 APPLICATIONS WITHDRAWN 14 $174,106 12 $196,346 1 $621,760 FILES CLOSED FOR INCOMPLETENESS 2 $108,460 1 $55,000 0 $0
Aggregated Statistics For Year 2004(Based on 10 full and 6 partial tracts) A) Conventional B) Refinancings C) Non-occupant Loans on Number Average Value Number Average Value Number Average Value
LOANS ORIGINATED 556 $153,656 165 $157,662 59 $115,464 APPLICATIONS APPROVED, NOT ACCEPTED 148 $146,367 73 $168,156 17 $100,594 APPLICATIONS DENIED 11 $135,447 0 $0 3 $111,310 APPLICATIONS WITHDRAWN 36 $151,511 18 $154,650 5 $134,492 FILES CLOSED FOR INCOMPLETENESS 4 $132,732 3 $216,233 0 $0
Aggregated Statistics For Year 2003(Based on 10 full and 6 partial tracts) A) Conventional B) Refinancings C) Non-occupant Loans on Number Average Value Number Average Value Number Average Value
LOANS ORIGINATED 700 $158,863 454 $157,596 41 $121,371 APPLICATIONS APPROVED, NOT ACCEPTED 153 $146,717 138 $156,472 16 $103,821 APPLICATIONS DENIED 20 $182,090 3 $208,103 3 $120,257 APPLICATIONS WITHDRAWN 52 $159,831 34 $147,573 7 $138,596 FILES CLOSED FOR INCOMPLETENESS 6 $123,787 1 $223,140 0 $0
Aggregated Statistics For Year 1999(Based on 3 partial tracts) A) Conventional B) Refinancings C) Non-occupant Loans on Number Average Value Number Average Value Number Average Value
LOANS ORIGINATED 263 $134,353 50 $119,674 3 $87,270 APPLICATIONS APPROVED, NOT ACCEPTED 29 $144,278 8 $126,395 1 $43,700 APPLICATIONS DENIED 18 $131,356 3 $148,813 0 $0 APPLICATIONS WITHDRAWN 8 $133,942 2 $127,935 0 $0 FILES CLOSED FOR INCOMPLETENESS 9 $128,922 1 $233,230 0 $0
2002 - 2018 National Fire Incident Reporting System (NFIRS) incidents See full 2006 National Fire Incident Reporting System statistics for zip code 77450, Texas
Most common first names in zip code 77450 among deceased individuals Name Count Lived (average)
Mary 76 79.2 years John 66 69.8 years William 62 74.6 years James 52 71.8 years Robert 43 72.2 years Charles 41 72.4 years Dorothy 31 78.5 years George 26 75.3 years Thomas 25 69.9 years Helen 23 80.3 years
Most common last names in zip code 77450 among deceased individuals Last name Count Lived (average)
Johnson 22 75.9 years Smith 21 77.7 years Williams 17 78.0 years Wilson 15 75.8 years Jones 15 79.0 years Thompson 14 70.9 years Moore 13 75.6 years Davis 12 71.4 years Anderson 10 80.0 years Lee 10 76.7 years
Businesses in zip code 77450
Name Count Name Count
24 Hour Fitness 1 La Quinta 1 99 Cents Only Stores 1 Lane Furniture 2 AT&T 2 Little Caesars Pizza 1 Academy Sports + Outdoors 1 McDonald's 3 Ace Hardware 1 Motel 6 1 Advance Auto Parts 1 Nike 3 AutoZone 1 Office Depot 1 Avenue 1 Outback 1 Baskin-Robbins 1 Outback Steakhouse 1 Blockbuster 2 Panda Express 2 Burger King 1 Penske 1 CVS 3 Pizza Hut 2 Chevrolet 1 Plato's Closet 1 Chick-Fil-A 1 Popeyes 1 Cinnabon 1 RadioShack 1 Comfort Inn 1 SONIC Drive-In 2 Cricket Wireless 1 Safeway 2 Curves 1 Sears 1 DHL 2 Sprint Nextel 1 Discount Tire 1 Starbucks 3 Domino's Pizza 1 Super 8 1 FedEx 4 T-Mobile 3 Firestone Complete Auto Care 1 Taco Bell 1 GNC 3 The Room Place 1 H&R Block 1 Toyota 1 Hilton 1 U-Haul 2 Home Depot 1 UPS 6 Honda 1 Vons 2 Jack In The Box 1 Walgreens 3 KFC 1 Wendy's 2 Kroger 2
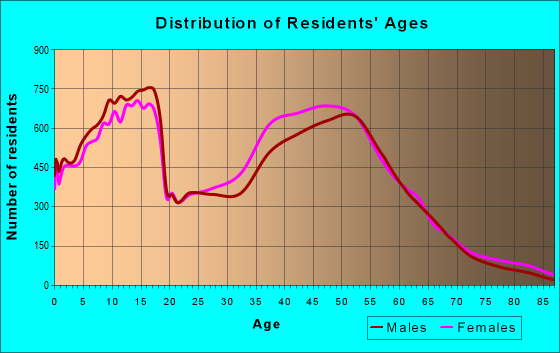
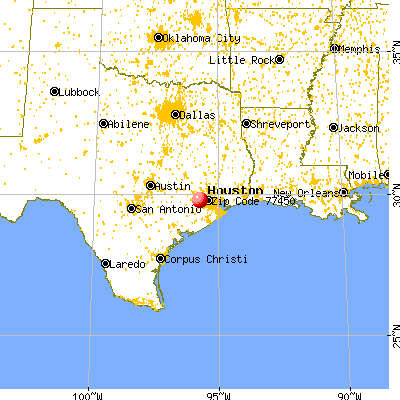


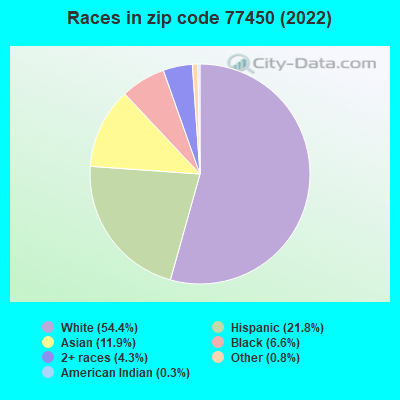


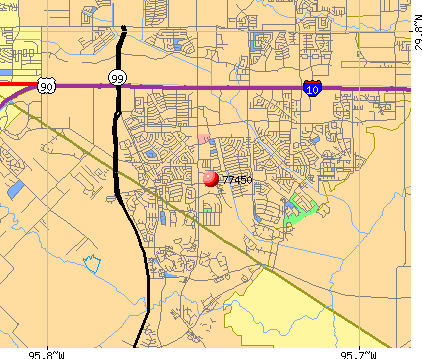 Nearest zip codes: 77094, 77407, 77494, 77449, 77082, 77083.
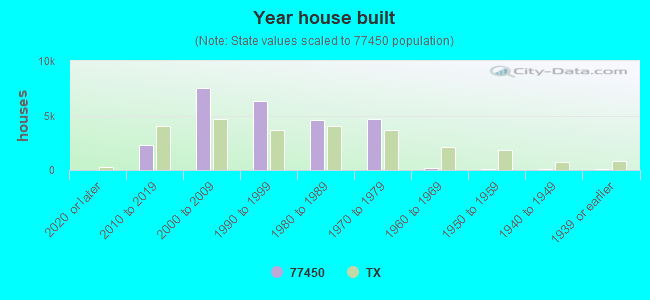

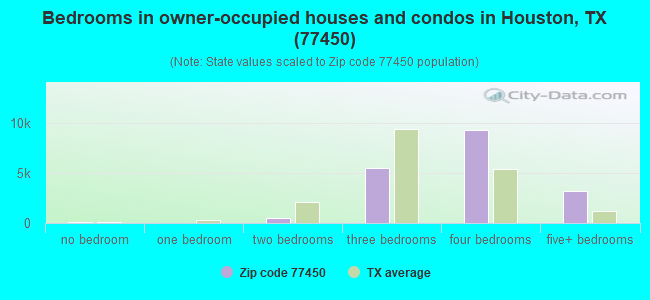
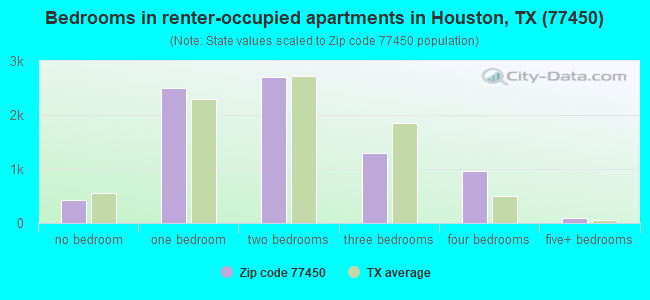
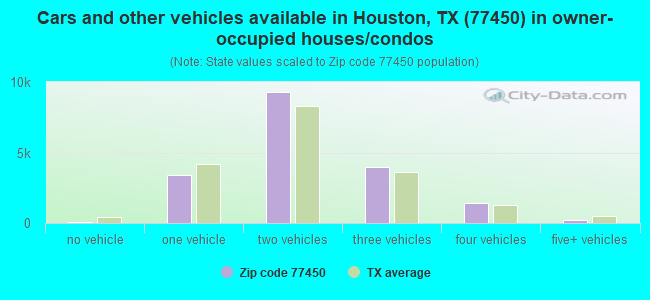
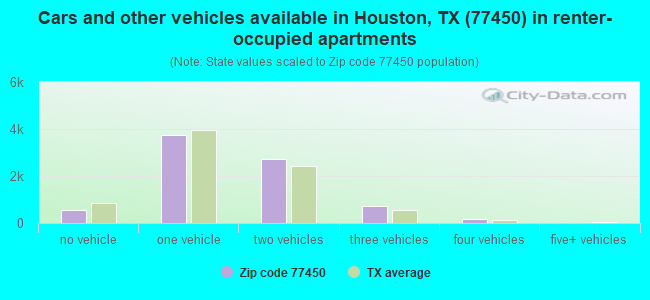


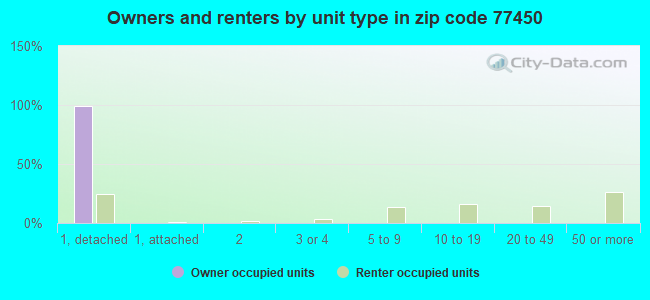
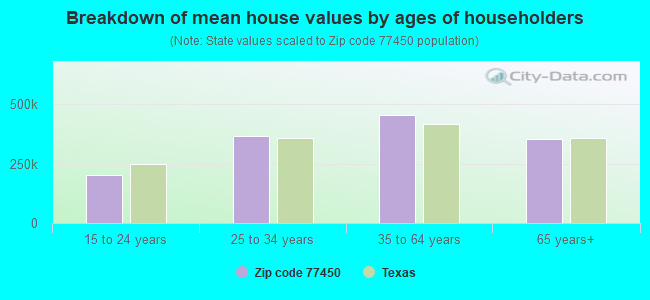


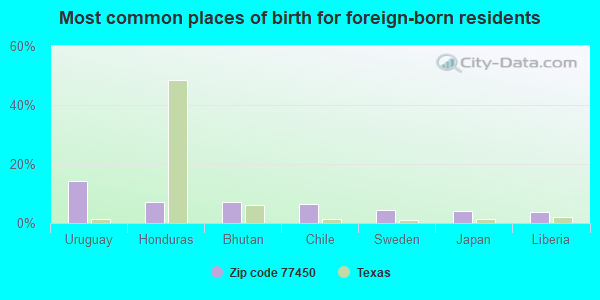
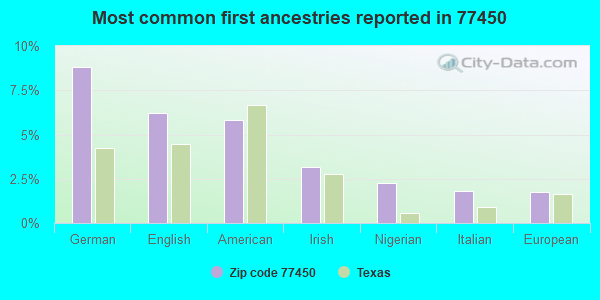
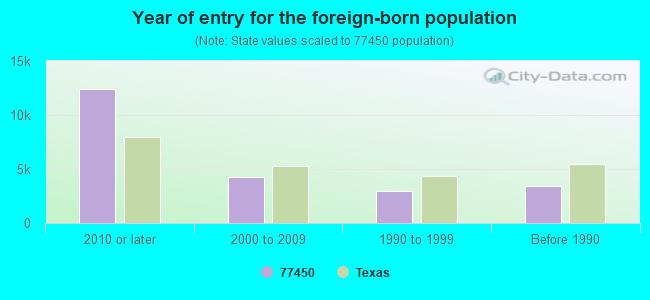
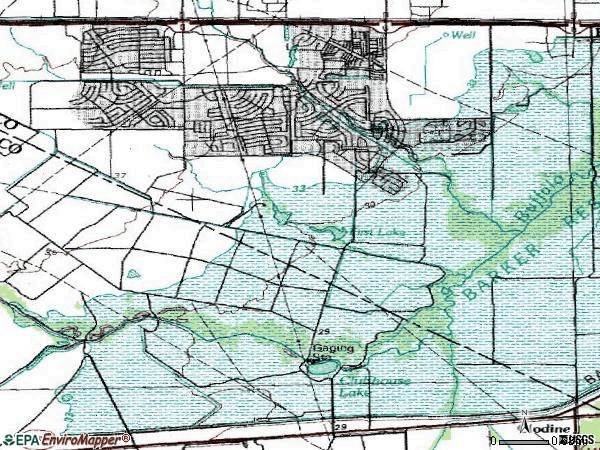
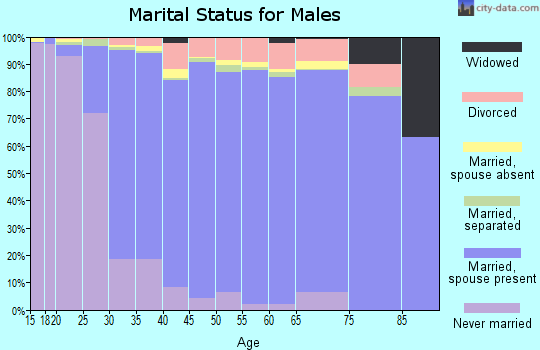
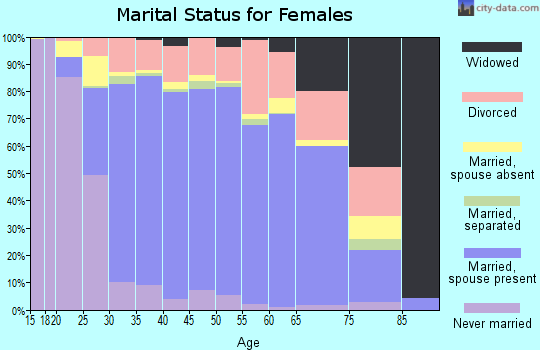
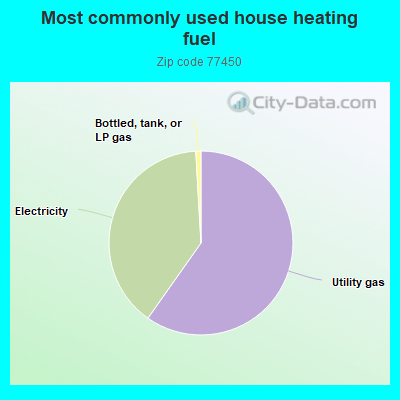
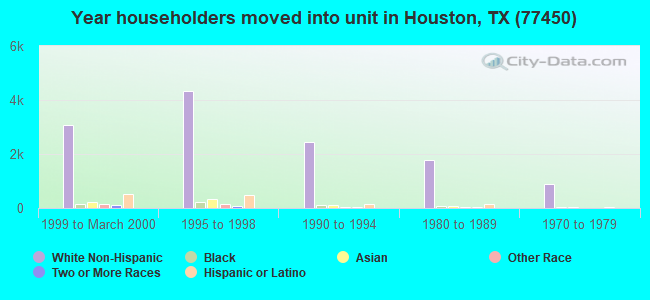
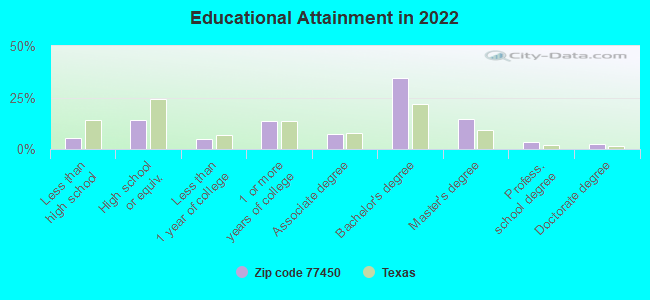
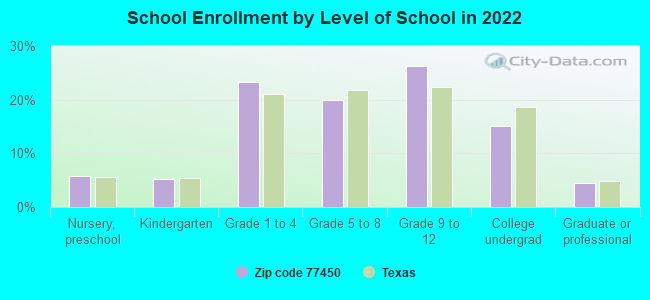
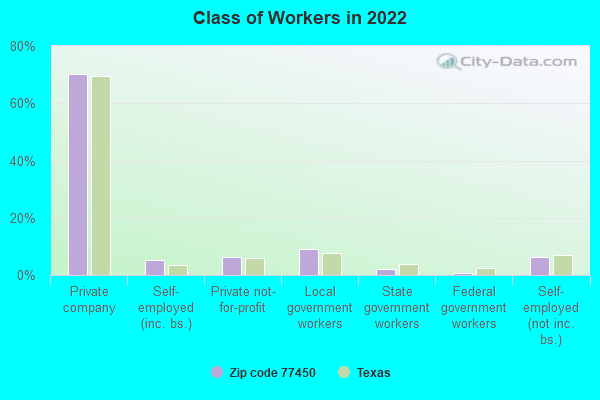
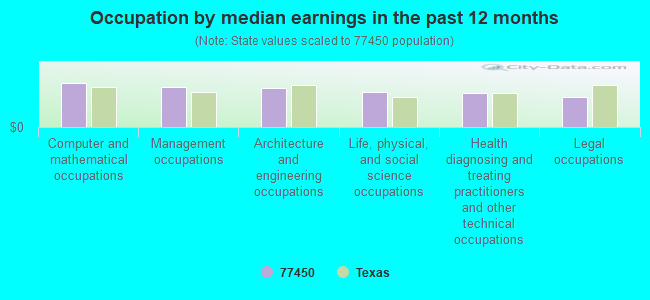
 : $2,986,813 in 98 contracts from 1999 to 2006
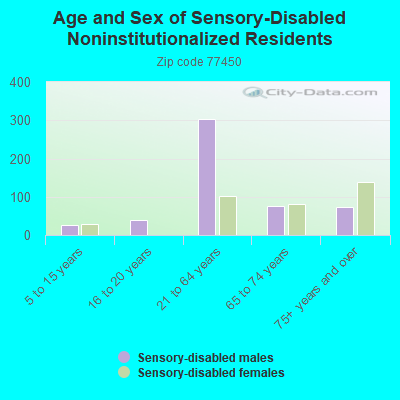
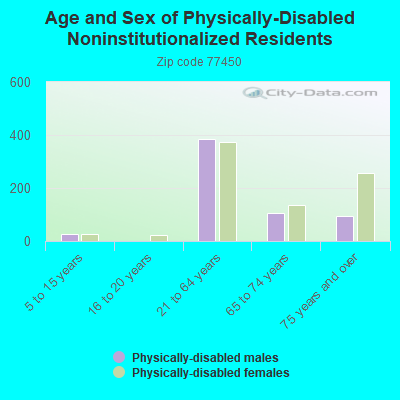
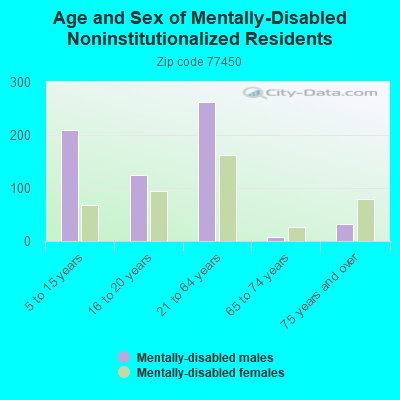
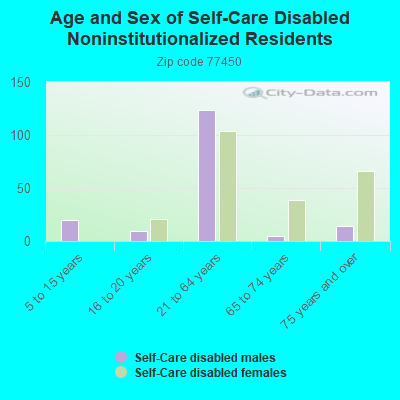
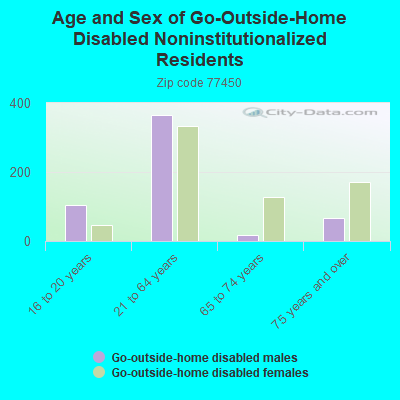
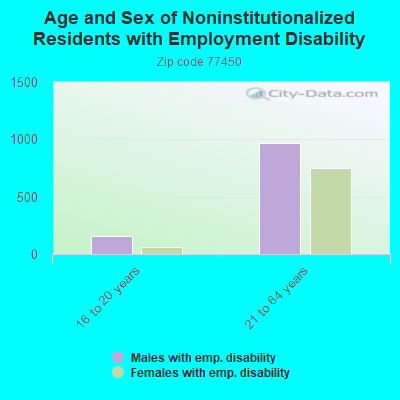
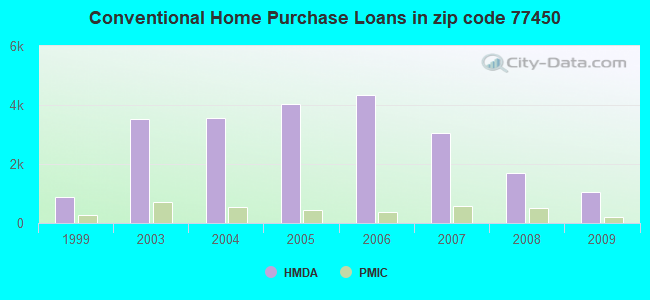
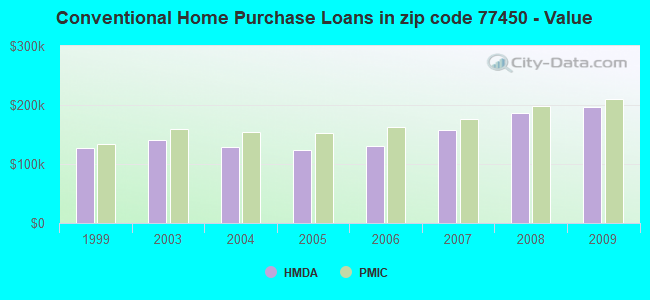
 According to the data from the years 2002 - 2018 the average number of fires per year is 128. The highest number of fires - 235 took place in 2011, and the least - 44 in 2015. The data has a dropping trend.
 When looking into fire subcategories, the most reports belonged to: Outside Fires (42.4%), and Structure Fires (38.2%).