Estimated zip code population in 2022: 38,570 Zip code population in 2010: 35,977 Zip code population in 2000: 39,392
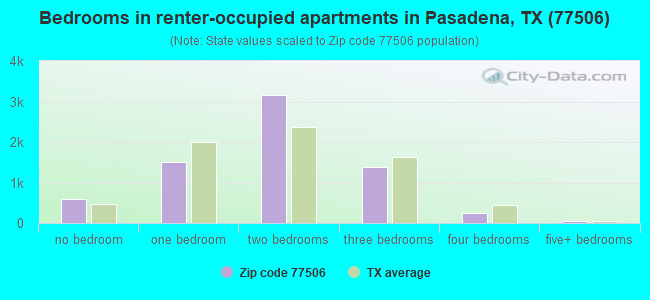
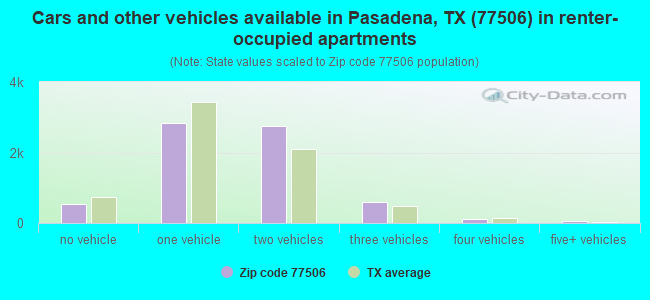
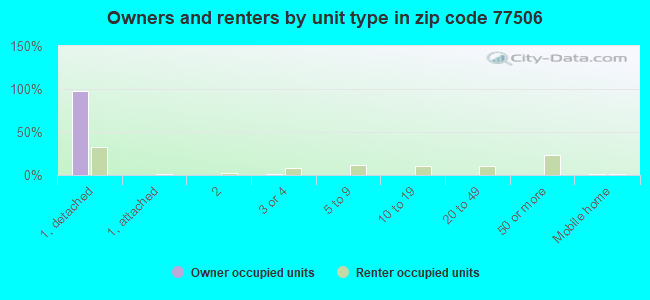
Houses and condos: 12,771 Renter-occupied apartments: 6,951
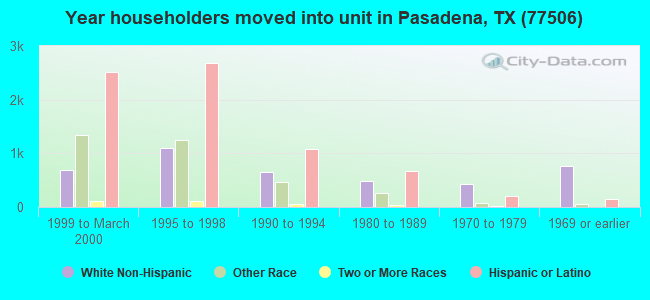
% of renters here:
62%
State:
38%
March 2022 cost of living index in zip code 77506: 94.3 (less than average, U.S. average is 100)
Land area: 9.2 sq. mi. Water area: 1.5 sq. mi.
Population density: 4,214 people per square mile
(average).
OSM Map
General Map
Google Map
MSN Map
OSM Map
General Map
Google Map
MSN Map
OSM Map
General Map
Google Map
MSN Map
OSM Map
General Map
Google Map
MSN Map
Please wait while loading the map...
Real estate property taxes paid for housing units in 2022:
This zip code:
1.5% ($1,963)
Texas:
1.5% ($4,050)
Median real estate property taxes paid for housing units with mortgages in 2022: $2,483 (1.7%) Median real estate property taxes paid for housing units with no mortgage in 2022: $1,596 (1.3%)
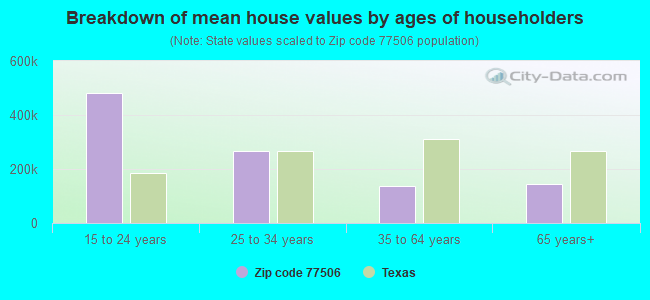
Estimated median house/condo value in 2022: $132,724
77506:
$132,724
Texas:
$275,400
According to our research of Texas and other state lists, there were 29 registered sex offenders living in 77506 zip code as of April 27, 2024. The ratio of all residents to sex offenders in zip code 77506 is 1,309 to 1. The ratio of registered sex offenders to all residents in this zip code is much lower than the state average.
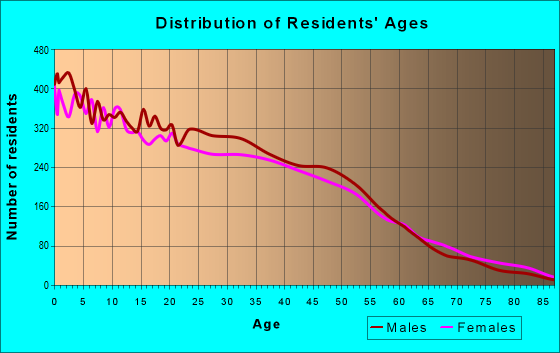
Median resident age:
This zip code:
28.7 years
Texas median age:
35.6 years
Average household size:
This zip code:
3.4 people
Texas:
2.6 people
Averages for the 2020 tax year for zip code 77506, filed in 2021:
Average Adjusted Gross Income (AGI) in 2020: $32,772 (Individual Income Tax Returns)
Here:
$32,772
State:
$77,054
Salary/wage: $32,849 (reported on 81.9% of returns)
Here:
$32,849
State:
$62,766
(% of AGI for various income ranges: 1170.8% for AGIs below $25k, 3611.0% for AGIs $25k-50k, 6693.2% for AGIs $50k-75k, 9712.9% for AGIs $75k-100k, 13030.0% for AGIs $100k-200k)
Taxable interest for individuals: $421 (reported on 6.5% of returns)
This zip code:
$421
Texas:
$2,665
(% of AGI for various income ranges: 1.5% for AGIs below $25k, 2.8% for AGIs $25k-50k, 7.4% for AGIs $50k-75k, 7.7% for AGIs $75k-100k, 20.0% for AGIs $100k-200k)
Ordinary dividends: $2,196 (reported on 1.7% of returns)
Here:
$2,196
State:
$10,044
(% of AGI for various income ranges: 0.6% for AGIs below $25k, 1.5% for AGIs $25k-50k, 3.4% for AGIs $50k-75k, 38.8% for AGIs $75k-100k, 66.8% for AGIs $100k-200k)
Net capital gain/loss in AGI: +$6,522 (reported on 2.0% of returns)
Here:
+$6,522
State:
+$39,590
(% of AGI for various income ranges: 0.4% for AGIs below $25k, 3.0% for AGIs $25k-50k, 30.0% for AGIs $50k-75k, 43.1% for AGIs $75k-100k, 355.0% for AGIs $100k-200k)
Profit/loss from business: +$6,359 (reported on 26.4% of returns)
Here:
+$6,359
State:
+$10,888
(% of AGI for various income ranges: 310.2% for AGIs below $25k, 124.1% for AGIs $25k-50k, 94.4% for AGIs $50k-75k, 114.6% for AGIs $75k-100k, 283.6% for AGIs $100k-200k)
Taxable individual retirement arrangement distribution: $11,741 (reported on 1.6% of returns)
77506:
$11,741
Texas:
$24,740
(% of AGI for various income ranges: 6.8% for AGIs below $25k, 20.9% for AGIs $25k-50k, 34.2% for AGIs $50k-75k, 97.9% for AGIs $75k-100k, 187.1% for AGIs $100k-200k)
Total itemized deductions: $32,126 (reported on 2.8% of returns)
Here:
$32,126
State:
$40,428
(% of AGI for various income ranges: 14.3% for AGIs below $25k, 108.7% for AGIs $25k-50k, 292.1% for AGIs $50k-75k, 397.9% for AGIs $75k-100k, 648.6% for AGIs $100k-200k)
Charity contributions: $10,776 (reported on 1.8% of returns)
Here:
$10,776
State:
$18,201
(% of AGI for various income ranges: 23.4% for AGIs $25k-50k, 64.4% for AGIs $50k-75k, 89.6% for AGIs $75k-100k, 181.4% for AGIs $100k-200k)
Taxes paid: $6,575 (reported on 2.3% of returns)
77506:
$6,575
State:
$7,821
(% of AGI for various income ranges: 2.7% for AGIs below $25k, 19.5% for AGIs $25k-50k, 52.0% for AGIs $50k-75k, 66.9% for AGIs $75k-100k, 72.9% for AGIs $100k-200k)
Earned income credit: $2,937 (reported on 32.6% of returns)
Here:
$2,937
State:
$2,584
(% of AGI for various income ranges: 183.2% for AGIs below $25k, 103.8% for AGIs $25k-50k, 2.4% for AGIs $50k-75k)
Percentage of individuals using paid preparers for their 2020 taxes: 90.1%
Here:
90%
State:
92%
(% for various income ranges: 88.4% for AGIs below $25k, 91.5% for AGIs $25k-50k, 92.2% for AGIs $50k-75k, 92.1% for AGIs $75k-100k, 91.4% for AGIs $100k-200k, 66.7% for AGIs over 200k)
Averages for the 2012 tax year for zip code 77506, filed in 2013:
Average Adjusted Gross Income (AGI) in 2012: $30,666 (Individual Income Tax Returns)
Here:
$30,666
State:
$65,384
Salary/wage: $30,271 (reported on 86.0% of returns)
Here:
$30,271
State:
$52,524
(% of AGI for various income ranges: 74.5% for AGIs below $25k, 92.0% for AGIs $25k-50k, 92.4% for AGIs $50k-75k, 90.8% for AGIs $75k-100k, 58.7% for AGIs $100k-200k)
Taxable interest for individuals: $460 (reported on 7.7% of returns)
This zip code:
$460
Texas:
$2,372
(% of AGI for various income ranges: 0.1% for AGIs below $25k, 0.1% for AGIs $50k-75k, 0.1% for AGIs $75k-100k, 0.2% for AGIs $100k-200k)
Ordinary dividends: $3,770 (reported on 2.1% of returns)
Here:
$3,770
State:
$9,721
(% of AGI for various income ranges: 0.2% for AGIs below $25k, 0.1% for AGIs $25k-50k, 0.2% for AGIs $75k-100k, 1.4% for AGIs $100k-200k)
Net capital gain/loss in AGI: +$1,926 (reported on 1.4% of returns)
Here:
+$1,926
State:
+$35,319
(% of AGI for various income ranges: 0.5% for AGIs $100k-200k)
Profit/loss from business: +$9,918 (reported on 21.0% of returns)
Here:
+$9,918
State:
+$13,732
(% of AGI for various income ranges: 20.9% for AGIs below $25k, 3.1% for AGIs $25k-50k, 0.9% for AGIs $50k-75k, 1.1% for AGIs $75k-100k, 5.7% for AGIs $100k-200k)
Taxable individual retirement arrangement distribution: $13,570 (reported on 2.1% of returns)
77506:
$13,570
Texas:
$19,511
(% of AGI for various income ranges: 0.6% for AGIs below $25k, 0.5% for AGIs $25k-50k, 0.6% for AGIs $50k-75k, 1.5% for AGIs $75k-100k, 3.5% for AGIs $100k-200k)
Total itemized deductions: $18,609 (30% of AGI, reported on 8.8% of returns)
Here:
$18,609
State:
$24,724
Here:
29.9% of AGI
State:
15.9% of AGI
(% of AGI for various income ranges: 1.8% for AGIs below $25k, 5.1% for AGIs $25k-50k, 8.0% for AGIs $50k-75k, 8.5% for AGIs $75k-100k, 5.5% for AGIs $100k-200k)
Charity contributions: $3,119 (reported on 5.3% of returns)
Here:
$3,119
State:
$6,808
(% of AGI for various income ranges: 0.2% for AGIs below $25k, 0.4% for AGIs $25k-50k, 0.7% for AGIs $50k-75k, 1.1% for AGIs $75k-100k, 0.9% for AGIs $100k-200k)
Taxes paid: $3,054 (reported on 8.2% of returns)
77506:
$3,054
State:
$6,921
(% of AGI for various income ranges: 0.4% for AGIs below $25k, 0.7% for AGIs $25k-50k, 1.2% for AGIs $50k-75k, 1.4% for AGIs $75k-100k, 1.2% for AGIs $100k-200k)
Earned income credit: $2,936 (reported on 36.1% of returns)
Here:
$2,936
State:
$2,570
(% of AGI for various income ranges: 11.9% for AGIs below $25k, 1.9% for AGIs $25k-50k)
Percentage of individuals using paid preparers for their 2012 taxes: 68.7%
Here:
69%
State:
51%
(% for various income ranges: 68.1% for AGIs below $25k, 68.7% for AGIs $25k-50k, 71.6% for AGIs $50k-75k, 72.3% for AGIs $75k-100k, 59.1% for AGIs $100k-200k)
Averages for the 2004 tax year for zip code 77506, filed in 2005:
Average Adjusted Gross Income (AGI) in 2004: $24,618 (Individual Income Tax Returns)
Here:
$24,618
State:
$47,881
Salary/wage: $24,557 (reported on 87.0% of returns)
Here:
$24,557
State:
$41,947
(% of AGI for various income ranges: 80.2% for AGIs below $10k, 83.6% for AGIs $10k-25k, 92.9% for AGIs $25k-50k, 87.9% for AGIs $50k-75k, 83.0% for AGIs $75k-100k, 54.1% for AGIs over 100k)
Taxable interest for individuals: $1,097 (reported on 12.2% of returns)
This zip code:
$1,097
Texas:
$2,255
(% of AGI for various income ranges: 0.8% for AGIs below $10k, 0.4% for AGIs $10k-25k, 0.3% for AGIs $25k-50k, 0.9% for AGIs $50k-75k, 0.7% for AGIs $75k-100k, 1.6% for AGIs over 100k)
Taxable dividends: $1,645 (reported on 3.4% of returns)
Here:
$1,645
State:
$4,261
(% of AGI for various income ranges: 0.4% for AGIs below $10k, 0.1% for AGIs $10k-25k, 0.1% for AGIs $25k-50k, 0.3% for AGIs $50k-75k, 0.3% for AGIs $75k-100k, 1.2% for AGIs over 100k)
Net capital gain/loss: +$2,331 (reported on 2.5% of returns)
Here:
+$2,331
State:
+$16,110
(% of AGI for various income ranges: -0.2% for AGIs below $10k, -0.0% for AGIs $10k-25k, 0.1% for AGIs $25k-50k, 0.5% for AGIs $50k-75k, -0.0% for AGIs $75k-100k, 3.4% for AGIs over 100k)
Profit/loss from business: +$7,731 (reported on 16.3% of returns)
Here:
+$7,731
State:
+$11,013
(% of AGI for various income ranges: 23.8% for AGIs below $10k, 11.0% for AGIs $10k-25k, 1.6% for AGIs $25k-50k, 0.9% for AGIs $50k-75k, 2.6% for AGIs $75k-100k, 3.3% for AGIs over 100k)
IRA payment deduction: $2,275 (reported on 0.6% of returns)
77506:
$2,275
Texas:
$3,120
Total itemized deductions: $17,008 (39% of AGI, reported on 6.6% of returns)
Here:
$17,008
State:
$19,631
Here:
38.9% of AGI
State:
18.9% of AGI
(% of AGI for various income ranges: 0.7% for AGIs below $10k, 1.9% for AGIs $10k-25k, 6.3% for AGIs $25k-50k, 5.2% for AGIs $50k-75k, 4.2% for AGIs $75k-100k, 5.0% for AGIs over 100k)
Charity contributions deductions: $2,980 (6% of AGI, reported on 4.7% of returns)
Here:
$2,980
State:
$4,753
Here:
6.5% of AGI
State:
4.2% of AGI
(% of AGI for various income ranges: 0.3% for AGIs $10k-25k, 0.6% for AGIs $25k-50k, 0.9% for AGIs $50k-75k, 1.0% for AGIs $75k-100k, 1.0% for AGIs over 100k)
Total tax: $2,355 (reported on 54.2% of returns)
77506:
$2,355
State:
$9,058
(% of AGI for various income ranges: 4.3% for AGIs below $10k, 3.3% for AGIs $10k-25k, 3.9% for AGIs $25k-50k, 7.7% for AGIs $50k-75k, 11.8% for AGIs $75k-100k, 13.0% for AGIs over 100k)
Earned income credit: $2,201 (reported on 39.2% of returns)
Here:
$2,201
State:
$2,024
Percentage of individuals using paid preparers for their 2004 taxes: 69.4%
Here:
69%
State:
57%
(% for various income ranges: 61.1% for AGIs below $10k, 74.3% for AGIs $10k-25k, 71.1% for AGIs $25k-50k, 63.6% for AGIs $50k-75k, 59.5% for AGIs $75k-100k, 67.5% for AGIs over 100k)
Likely homosexual households (counted as self-reported same-sex unmarried-partner households)
Lesbian couples: 0.2% of all households
Gay men: 0.0% of all households
Household received Food Stamps/SNAP in the past 12 months: 2,859 Household did not receive Food Stamps/SNAP in the past 12 months: 8,397
Women who had a birth in the past 12 months: 878 (579 now married, 297 unmarried) Women who did not have a birth in the past 12 months: 8,571 (4,341 now married, 4,212 unmarried)
Housing units in zip code 77506 with a mortgage: 1,734 (90 second mortgage, 47 both second mortgage and home equity loan) Median monthly owner costs for units with a mortgage: $1,293 Median monthly owner costs for units without a mortgage: $468
Residents with income below the poverty level in 2022:
This zip code:
21.7%
Whole state:
14.0%
Residents with income below 50% of the poverty level in 2022:
This zip code:
12.3%
Whole state:
7.4%
Median number of rooms in houses and condos:
Here:
5.5
State:
6.3
Median number of rooms in apartments:
Here:
3.9
State:
4.0
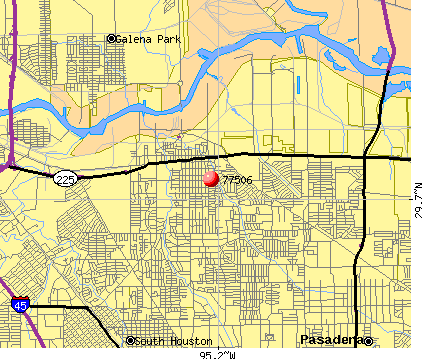
Notable locations in this zip code not listed on our city pages
Notable locations in zip code 77506: Deepwater Power Plant (A), Pasadena Volunteer Fire Department Station 2 (B), Pasadena Fire Chief (C), Pasadena Fire Marshal's Office (D), Pasadena Police Department (E), City of Pasadena Fire Department (F), Pasadena Historical Museum (G). Display/hide their locations on the map
Shopping Centers: Pasadena Shopping Center (1), Southmore Plaza Shopping Center (2), Red Bluff Village Shopping Center (3). Display/hide their locations on the map
Churches in zip code 77506 include: Central Baptist Church of Pasadena (A), Saint Pius Convent (B), Inter-Faith Baptist Convention (C), Segunda Bautista Iglesia (D), Richey Street Baptist Church (E), Saint Peters Episcopal Church (F), Asbury United Methodist Church of Pasadena (G), United Pentecostal Church (H), Thomas Avenue Baptist Church (I). Display/hide their locations on the map
7,384 married couples with children.
3,442 single-parent households (767 men, 2,675 women).
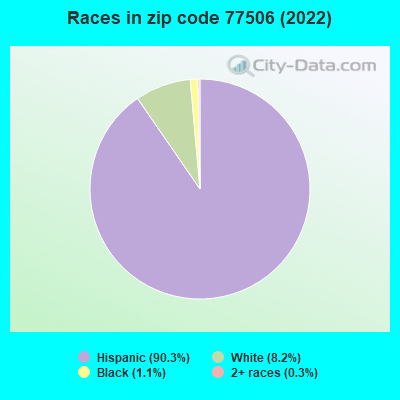
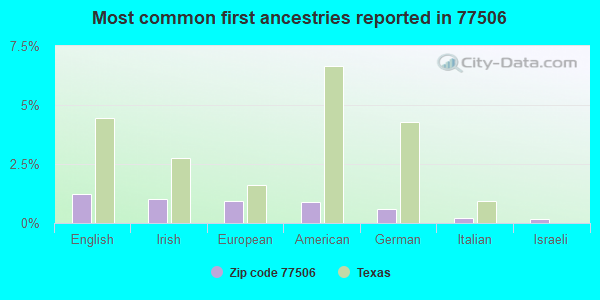
35.9% of residents of 77506 zip code speak English at home.
62.7% of residents speak Spanish at home (45% very well, 20% well, 23% not well, 12% not at all).
0.1% of residents speak Asian or Pacific Island language at home (98% very well, 2% well).
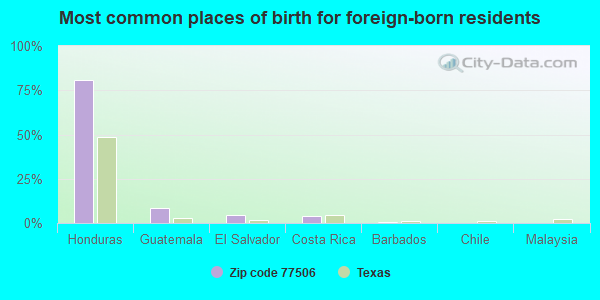
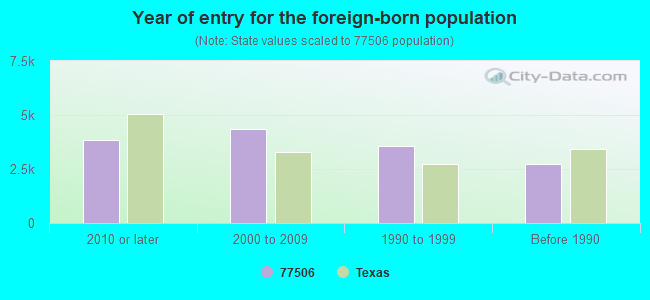
Foreign born population: 14,200 (36.8%) (25.6% of them are naturalized citizens)
Facilities with environmental interests located in this zip code:
AGRIFOS FERTILIZER L P (2001 JACKSON ROAD in PASADENA, TX)
AIR MAJOR (AIRS/AFS) (Integrated Compliance Information System) - ICIS-06-1993-0110, FORMAL ENFORCEMENT ACTION ENFORCEMENT/COMPLIANCE ACTIVITY (Integrated Compliance Information System) - ICIS-06-1983-0043, FORMAL ENFORCEMENT ACTION, ICIS-06-1978-0010, ICIS-06-1982-0030, (Integrated Compliance Information System) - ICIS-06-1983-0043, FORMAL ENFORCEMENT ACTION, ICIS-06-1978-0010, ICIS-06-1982-0030, (Integrated Compliance Information System) - ICIS-06-2001-3308, FORMAL ENFORCEMENT ACTION, ICIS-06-2002-1904, CRITERIA AND HAZARDOUS AIR POLLUTANT INVENTORY (Inventory of air pollution sources) National Pollutant Discharge Elimination System MAJOR (Tracking pollutant discharge elimination systems) - permit - ICIS-06-2002-1904, FORMAL ENFORCEMENT ACTION RAD NESHAPS (Radiation and radioactivity tracking) AIR MAJOR ("Best Available" air pollution technologies tracking) Conditionally Exempt Small Quantity Generators, less than 100 kg/month of hazardous waste (Resource Conservation and Recovery Act (tracking hazardous waste)) - notification TRI REPORTER (Tracking of toxic chemicals releasing facilities) Business SIC classification: INDUSTRIAL INORGANIC CHEMICALS; PHOSPHATIC FERTILIZERS; FERTILIZERS, MIXING ONLY Business NAICS classification: PHOSPHATIC FERTILIZER MANUFACTURING.; PHOSPHATIC FERTILIZER MANUFACTURING. Organizations: AGRIFOS FERTILIZER INC (CONTACT/OPERATOR)
Alternative names: AGRIFIOS- OLIN FACILITY, AGRIFIOS- OLIN FACILITY, AGRIFOS FERTILIZER LP, MOBIL MINING & MINERALS
AES DEEPWATER INCORPORATED (701 LIGHT COMPANY ROAD in PASADENA, TX)
AIR MAJOR (AIRS/AFS) AIR PROGRAM (Clean Air Markets Division Business System) (Integrated Compliance Information System) - ICIS-06-2005-0618, ENFORCEMENT/COMPLIANCE ACTIVITY FORMAL ENFORCEMENT ACTION (Integrated Compliance Information System) - ICIS-06-2005-0618, ENFORCEMENT/COMPLIANCE ACTIVITY CRITERIA AND HAZARDOUS AIR POLLUTANT INVENTORY (Inventory of air pollution sources) National Pollutant Discharge Elimination System NON-MAJOR (Tracking pollutant discharge elimination systems) - permit Conditionally Exempt Small Quantity Generators, less than 100 kg/month of hazardous waste (Resource Conservation and Recovery Act (tracking hazardous waste)) TRI REPORTER (Tracking of toxic chemicals releasing facilities) Business SIC classification: ELECTRIC SERVICES Business NAICS classification: ELECTRIC POWER DISTRIBUTION. Organizations: AES WESTERN POWER LLC (CONTACT/OPERATOR)
, AES CORPORATION (CONTACT/OWNER)
, AES DEEPWATER, INC. (CONTACT/OWNER)
, AES WESTERN POWER LLC (CONTACT/OWNER)
, AES CORPORATION (OWNER/OPERATOR)
, AES DEEPWATER, INC. (OWNER/OPERATOR)
Alternative names: AES DEEPWATER INC.
AIR PRODUCTS INCORPORATED (1423 HIGHWAY 225 in PASADENA, TX)
AIR MAJOR (AIRS/AFS) (Integrated Compliance Information System) - ICIS-06-1995-0389, FORMAL ENFORCEMENT ACTION CRITERIA AND HAZARDOUS AIR POLLUTANT INVENTORY (Inventory of air pollution sources) National Pollutant Discharge Elimination System NON-MAJOR (Tracking pollutant discharge elimination systems) - permit HAZARDOUS WASTE BIENNIAL REPORTER (Resource Conservation and Recovery Act (tracking hazardous waste)) Large Quantity Generators, more that 1000 kg of hazardous waste/month (Resource Conservation and Recovery Act (tracking hazardous waste)) - notification TSD (Resource Conservation and Recovery Act (tracking hazardous waste)) - notification TRI REPORTER (Tracking of toxic chemicals releasing facilities) Business SIC classification: INDUSTRIAL GASES; PLASTICS MATERIALS, SYNTHETIC RESINS, AND NONVULCANIZABLE ELASTOMERS; CYCLIC ORGANIC CRUDES AND INTERMEDIATES, AND ORGANIC DYES AND PIGMENTS; INDUSTRIAL ORGANIC CHEMICALS; NITROGENOUS FERTILIZERS Business NAICS classification: ALL OTHER BASIC ORGANIC CHEMICAL MANUFACTURING. Organizations: AIR PRODUCTS LP (CONTACT/OPERATOR)
, AIR PRODUCTS, L.P. (CONTACT/OWNER)
Alternative names: AIR PRODS. L.P.
A & L SANDBLASTING & PAINTING (2121 PASADENA FREEWAY in PASADENA, TX)
(Integrated Compliance Information System) - ICIS-HQ-1999-1096, FORMAL ENFORCEMENT ACTION Conditionally Exempt Small Quantity Generators, less than 100 kg/month of hazardous waste (Resource Conservation and Recovery Act (tracking hazardous waste)) - notification Business SIC classification: LOCAL TRUCKING WITHOUT STORAGE; TRUCKING, EXCEPT LOCAL Organizations: JULION SCHAPPIRO (CONTACT/OWNER)
ABLE COMPANY (408 E SHAW in PASADENA, TX)
(Resource Conservation and Recovery Act (tracking hazardous waste))
A C COLLINS FORD INC (1831 S RICHEY in PASADENA, TX)
(Resource Conservation and Recovery Act (tracking hazardous waste)) Business NAICS classification: MOTOR VEHICLE BODY MANUFACTURING.
A & L SANDBLASTING & PAINTING (211 N HARRIS in PASADENA, TX)
Conditionally Exempt Small Quantity Generators, less than 100 kg/month of hazardous waste (Resource Conservation and Recovery Act (tracking hazardous waste)) - notification Organizations: ALAN SWINDOLL (CONTACT/OWNER)
Housing units lacking complete plumbing facilities: 1.6% Housing units lacking complete kitchen facilities: 2.0%
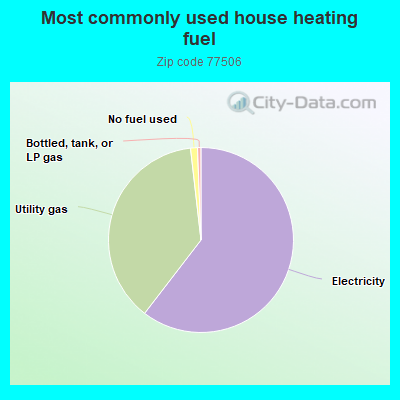
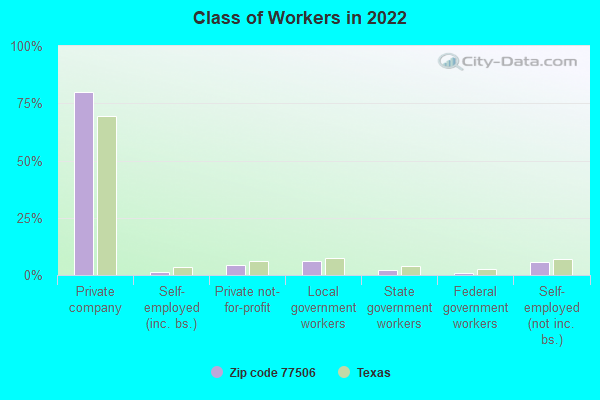
60.5%Electricity
37.8%Utility gas
1.2%No fuel used
0.6%Bottled, tank, or LP gas
Population in 1990: 33,656. Population change in the 1990s: +5,736 (+17.0%).
Place of birth for U.S.-born residents:
This state: 20,565
Northeast: 198
Midwest: 546
South: 1,155
West: 1,335
48% of the 77506 zip code residents lived in the same house 5 years ago. Out of people who lived in different houses, 82% lived in this county. Out of people who lived in different counties, 50% lived in Texas.
87% of the 77506 zip code residents lived in the same house 1 year ago. Out of people who lived in different houses, 71% moved from this county. Out of people who lived in different houses, 14% moved from different county within same state. Out of people who lived in different houses, 4% moved from different state. Out of people who lived in different houses, 7% moved from abroad.
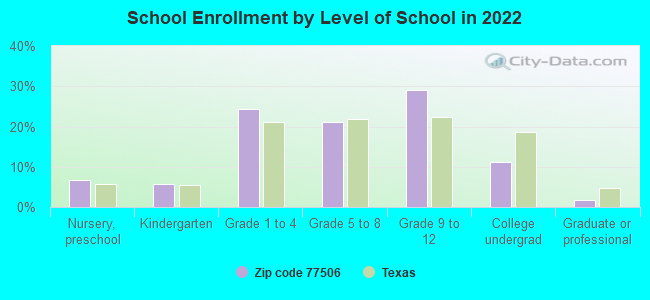
Private vs. public school enrollment:
Students in private schools in grades 1 to 8 (elementary and middle school): 78
Here:
1.5%
Texas:
8.8%
Students in private schools in grades 9 to 12 (high school): 81
Here:
2.4%
Texas:
8.0%
Students in private undergraduate colleges: 58
Here:
4.5%
Texas:
16.2%
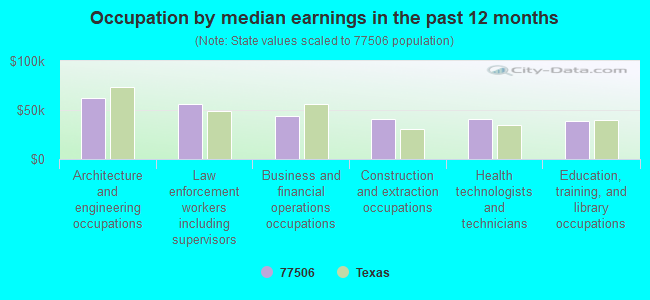
Occupation by median earnings in the past 12 months ($)
62,397Architecture and engineering occupations
56,436Law enforcement workers including supervisors
43,513Business and financial operations occupations
41,167Construction and extraction occupations
40,489Health technologists and technicians
38,791Education, training, and library occupations
Companies with federal contracts located in this zip code (PASADENA, TX):
LA GLORIA OIL & GAS CO INC (111 RED BLUFF RD)
$50,677,500 with Defense Logistics Agency for Liquid Propellants and Fuels, Petroleum Base. Signed on 2001-03-12. Completion date: 2002-04-30.
CAT TECH, INC (1149 ELLSWORTH DR STE 327; small business)
$102,380 with Air Force for Maintenance, Repair and Rebuilding of Equipment -- Furnace, Steam Plant, and Drying Equipment; and Nuclear Reactors. Signed on 2002-04-04. Completion date: 2002-12-30.
KELLY WIRE ROPE, INC (201 N RICHEY ST; small business) : $23,520 in 2 contractsin 2005
$11,760 with Army for Chain and Wire Rope. Signed on 2005-02-04. Completion date: 2005-02-25.
$11,760 with U.S. Army Corps of Engineers - civil program financing only for Chain and Wire Rope. Signed on 2005-02-04. Completion date: 2005-02-25.
PHOENIX DEMOLITION, INC. (1527 S. RICHEY #7; small business)
$20,110 with Navy for Maintenance, Repair or Alteration of Real Property -- Other Airfield Structures. Signed on 2000-07-27. Completion date: 2000-08-26.
Top industries in this zip code by the number of employees in 2005:
Health Care and Social Assistance: Services for the Elderly and Persons with Disabilities (500-999 employees: 1 establishment)
Administrative and Support and Waste Management and Remediation Services: Temporary Help Services (50-99: 3, 20-49: 1)
2002 - 2018 National Fire Incident Reporting System (NFIRS) incidents
Based on the data from the years 2002 - 2018 the average number of fires per year is 48. The highest number of fire incidents - 96 took place in 2005, and the least - 0 in 2010. The data has a decreasing trend.
When looking into fire subcategories, the most reports belonged to: Structure Fires (36.3%), and Outside Fires (27.1%).
Fire incident types reported to NFIRS in Zip Code 77506
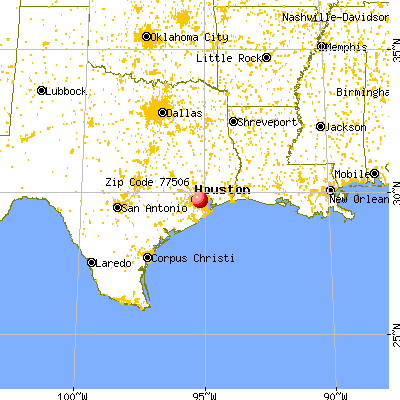


 Nearest zip codes: 77502, 77503, 77547, 77015, 77017, 77587.
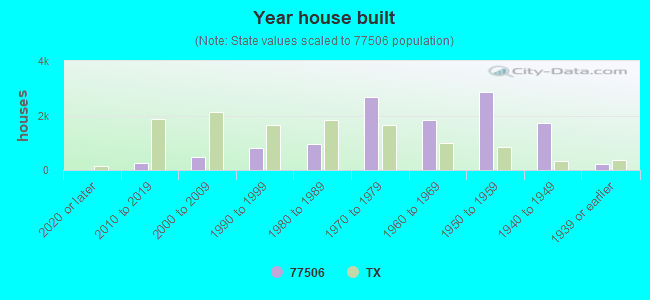


 Based on the data from the years 2002 - 2018 the average number of fires per year is 48. The highest number of fire incidents - 96 took place in 2005, and the least - 0 in 2010. The data has a decreasing trend.
 When looking into fire subcategories, the most reports belonged to: Structure Fires (36.3%), and Outside Fires (27.1%).