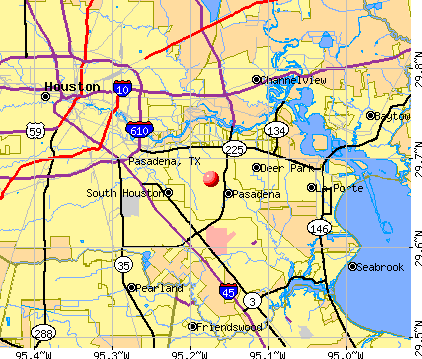
Pasadena, Texas
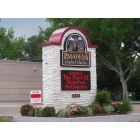
Pasadena: Chamber Of Commerce Marker
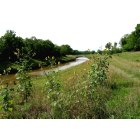
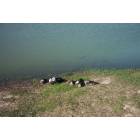
Pasadena: HIstoric Vince's Bayou
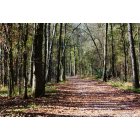
Pasadena: Early morning trail at Armand Bayou Nature Center
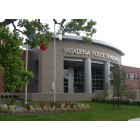
Pasadena: Police Station
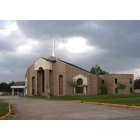
Pasadena: Preston Ave. Church
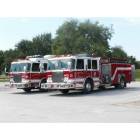
Pasadena: City Of Pasadena Fire Festival at Strawberry Park
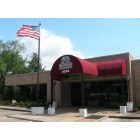
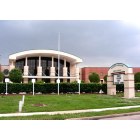
Pasadena: Chamber Of Commerce
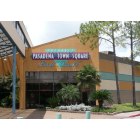
Pasadena: Town Square Mall
Pasadena: Pasadena Memorial High School
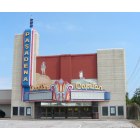
Pasadena: El Capitan Theatre building
Pasadena: Residents of Crenshaw Park
- see
15
more - add
your
Submit your own pictures of this city and show them to the world
- OSM Map
- General Map
- Google Map
- MSN Map
Population change since 2000: +4.2%
 |
| Males: 72,402 | |
| Females: 75,260 |
| Median resident age: | 31.4 years |
| Texas median age: | 35.6 years |
Zip codes: 77502.
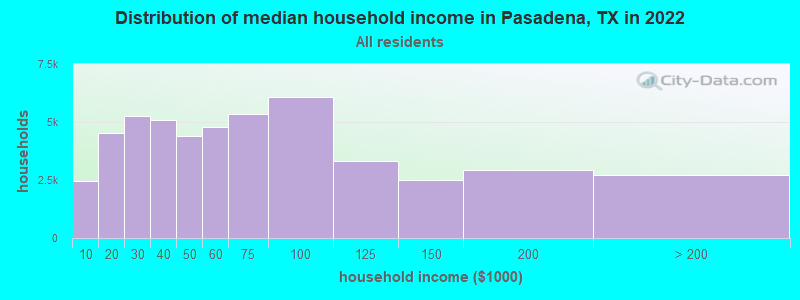
| Pasadena: | $57,078 |
| TX: | $72,284 |
Estimated per capita income in 2022: $25,228 (it was $16,301 in 2000)
Pasadena city income, earnings, and wages data
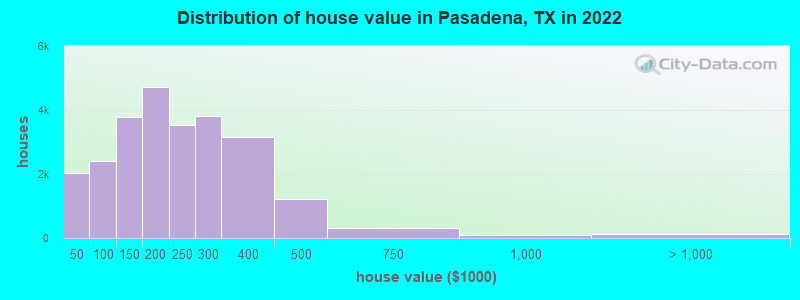
Estimated median house or condo value in 2022: $200,000 (it was $67,600 in 2000)
| Pasadena: | $200,000 |
| TX: | $275,400 |
Mean prices in 2022: all housing units: $209,399; detached houses: $226,562; townhouses or other attached units: $147,022; in 5-or-more-unit structures: $207,073; mobile homes: $45,930
Median gross rent in 2022: $1,154.
(9.8% for White Non-Hispanic residents, 45.1% for Black residents, 20.3% for Hispanic or Latino residents, 33.4% for American Indian residents, 14.2% for other race residents, 16.1% for two or more races residents)
Detailed information about poverty and poor residents in Pasadena, TX


- 99,61167.5%Hispanic
- 33,99923.0%White alone
- 8,6035.8%Black alone
- 2,2761.5%Asian alone
- 2,2531.5%Two or more races
- 7740.5%Other race alone
- 1490.1%American Indian alone
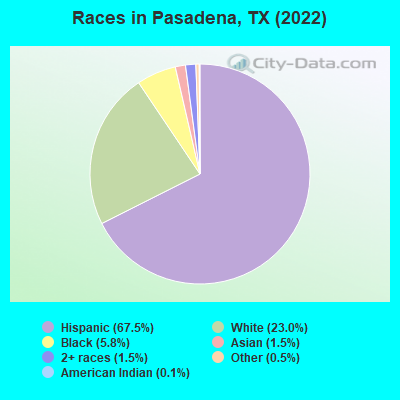
Races in Pasadena detailed stats: ancestries, foreign born residents, place of birth
According to our research of Texas and other state lists, there were 118 registered sex offenders living in Pasadena, Texas as of April 26, 2024.
The ratio of all residents to sex offenders in Pasadena is 1,300 to 1.
The ratio of registered sex offenders to all residents in this city is much lower than the state average.
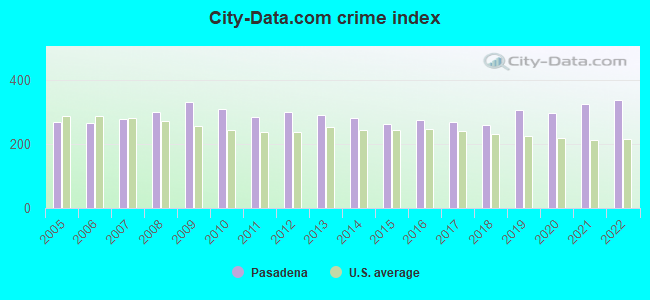
The City-Data.com crime index weighs serious crimes and violent crimes more heavily. Higher means more crime, U.S. average is 246.1. It adjusts for the number of visitors and daily workers commuting into cities.
- means the value is smaller than the state average.- means the value is about the same as the state average.
- means the value is bigger than the state average.
- means the value is much bigger than the state average.
Crime rate in Pasadena detailed stats: murders, rapes, robberies, assaults, burglaries, thefts, arson
Full-time law enforcement employees in 2021, including police officers: 367 (274 officers - 250 male; 24 female).
| Officers per 1,000 residents here: | 1.83 |
| Texas average: | 2.07 |
 Recent articles from our blog. Our writers, many of them Ph.D. graduates or candidates, create easy-to-read articles on a wide variety of topics.


Latest news from Pasadena, TX collected exclusively by city-data.com from local newspapers, TV, and radio stations
Ancestries: American (3.3%), English (2.6%), European (1.7%), German (1.6%), Irish (1.2%).
Current Local Time: CST time zone
Land area: 44.2 square miles.
Population density: 3,344 people per square mile (average).
40,443 residents are foreign born (24.2% Latin America).
| This city: | 26.5% |
| Texas: | 17.1% |
Median real estate property taxes paid for housing units with mortgages in 2022: $3,356 (1.5%)
Median real estate property taxes paid for housing units with no mortgage in 2022: $2,317 (1.2%)
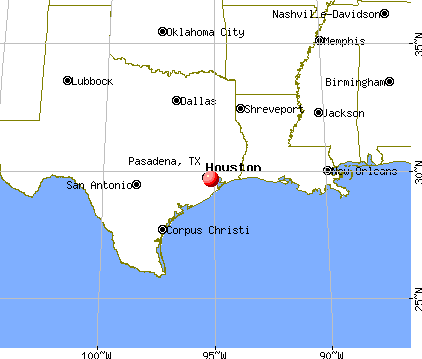
Nearest city with pop. 200,000+: Houston, TX  (13.9 miles , pop. 1,953,631).
Nearest cities:
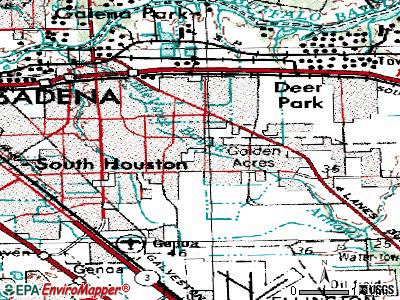
), ), Latitude: 29.68 N, Longitude: 95.17 W
Daytime population change due to commuting: +10,387 (+7.0%)
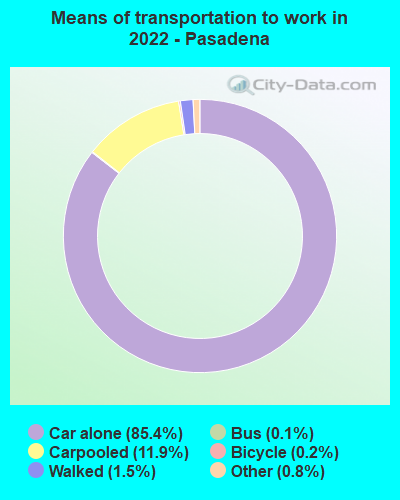
Workers who live and work in this city: 19,544 (32.7%)
Property values in Pasadena, TX
Pasadena tourist attractions:
Pasadena, Texas accommodation & food services, waste management - Economy and Business Data
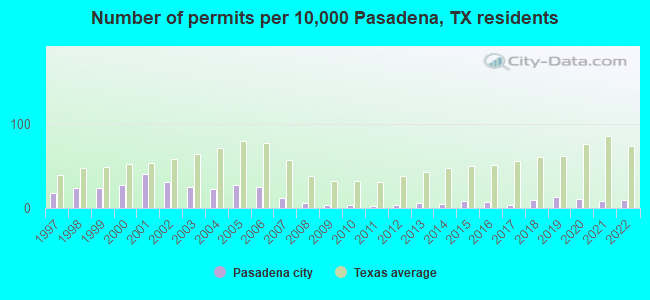
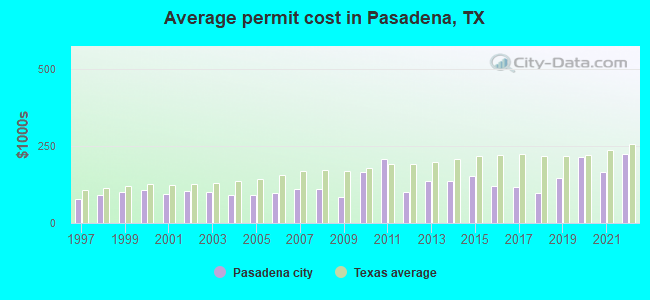
Single-family new house construction building permits:
- 2022: 138 buildings, average cost: $223,500
- 2021: 119 buildings, average cost: $166,200
- 2020: 144 buildings, average cost: $215,100
- 2019: 189 buildings, average cost: $145,100
- 2018: 129 buildings, average cost: $96,700
- 2017: 53 buildings, average cost: $116,800
- 2016: 100 buildings, average cost: $121,000
- 2015: 119 buildings, average cost: $152,600
- 2014: 76 buildings, average cost: $136,800
- 2013: 85 buildings, average cost: $137,300
- 2012: 53 buildings, average cost: $102,200
- 2011: 40 buildings, average cost: $208,700
- 2010: 47 buildings, average cost: $165,700
- 2009: 51 buildings, average cost: $82,900
- 2008: 77 buildings, average cost: $109,500
- 2007: 171 buildings, average cost: $110,400
- 2006: 351 buildings, average cost: $97,600
- 2005: 387 buildings, average cost: $89,700
- 2004: 316 buildings, average cost: $91,300
- 2003: 359 buildings, average cost: $99,500
- 2002: 441 buildings, average cost: $103,000
- 2001: 578 buildings, average cost: $95,600
- 2000: 387 buildings, average cost: $106,700
- 1999: 341 buildings, average cost: $100,400
- 1998: 332 buildings, average cost: $91,400
- 1997: 253 buildings, average cost: $79,200
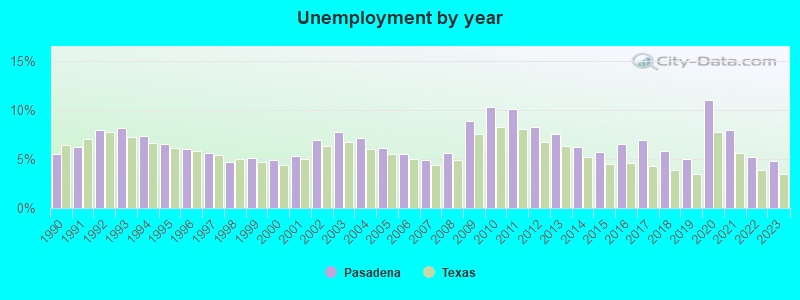
| Here: | 4.8% |
| Texas: | 3.5% |
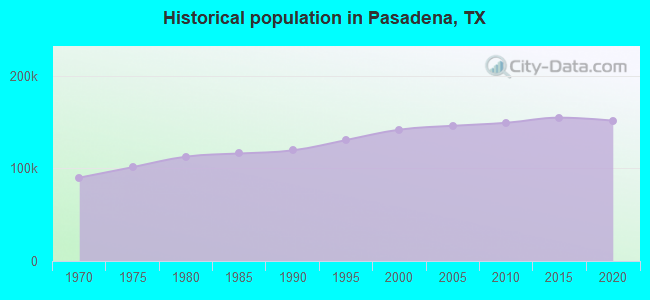
Population change in the 1990s: +21,637 (+18.0%).
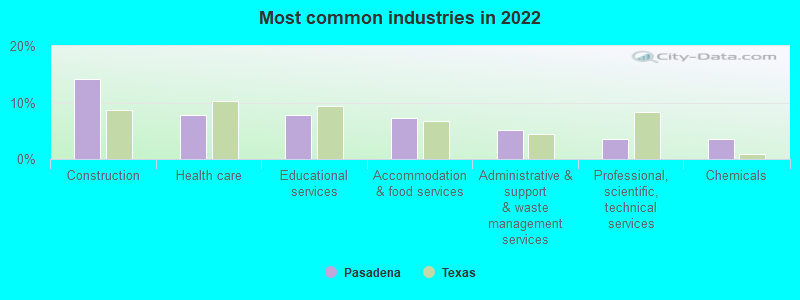
- Construction (14.1%)
- Health care (7.8%)
- Educational services (7.8%)
- Accommodation & food services (7.2%)
- Administrative & support & waste management services (5.1%)
- Professional, scientific, technical services (3.6%)
- Chemicals (3.6%)
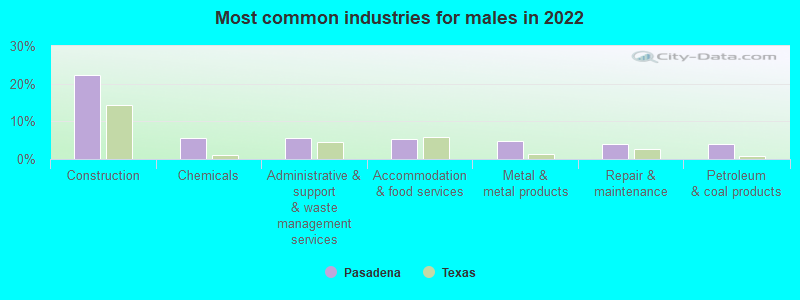
- Construction (22.2%)
- Chemicals (5.7%)
- Administrative & support & waste management services (5.6%)
- Accommodation & food services (5.2%)
- Metal & metal products (4.9%)
- Repair & maintenance (4.0%)
- Petroleum & coal products (3.9%)
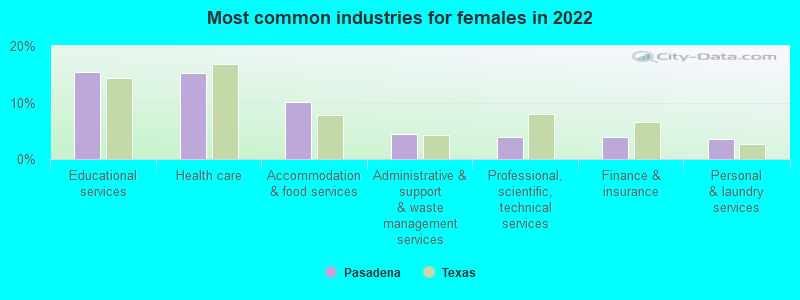
- Educational services (15.4%)
- Health care (15.3%)
- Accommodation & food services (10.1%)
- Administrative & support & waste management services (4.4%)
- Professional, scientific, technical services (3.9%)
- Finance & insurance (3.8%)
- Personal & laundry services (3.5%)
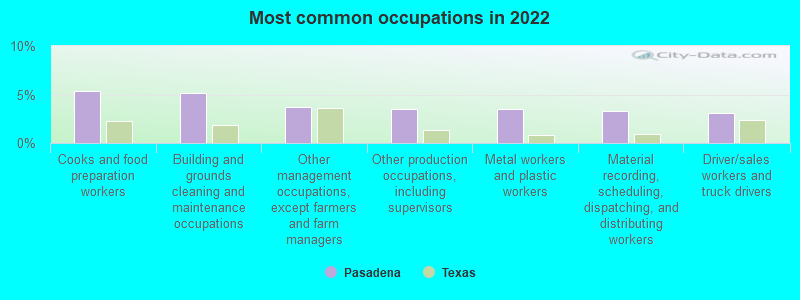
- Cooks and food preparation workers (5.4%)
- Building and grounds cleaning and maintenance occupations (5.1%)
- Other management occupations, except farmers and farm managers (3.7%)
- Other production occupations, including supervisors (3.5%)
- Metal workers and plastic workers (3.5%)
- Material recording, scheduling, dispatching, and distributing workers (3.2%)
- Driver/sales workers and truck drivers (3.1%)
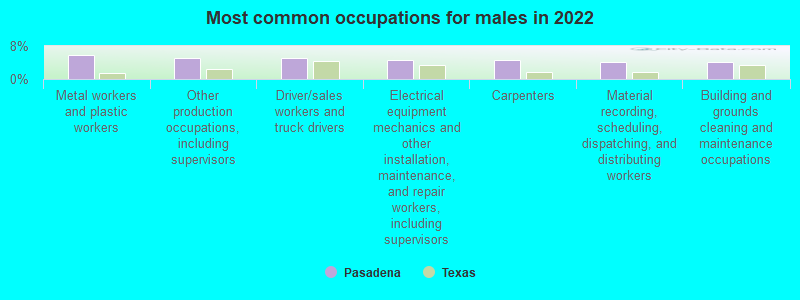
- Metal workers and plastic workers (5.8%)
- Other production occupations, including supervisors (5.2%)
- Driver/sales workers and truck drivers (5.1%)
- Electrical equipment mechanics and other installation, maintenance, and repair workers, including supervisors (4.6%)
- Carpenters (4.5%)
- Material recording, scheduling, dispatching, and distributing workers (4.2%)
- Building and grounds cleaning and maintenance occupations (4.1%)
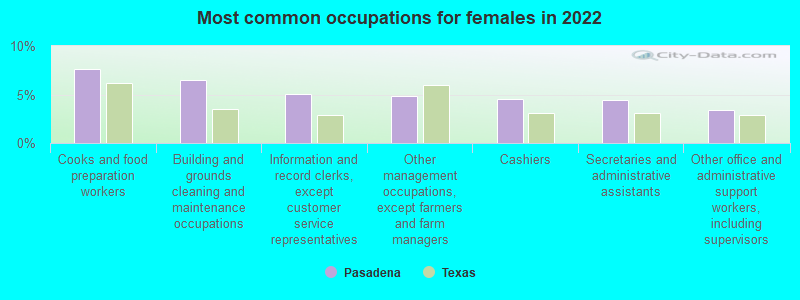
- Cooks and food preparation workers (7.7%)
- Building and grounds cleaning and maintenance occupations (6.5%)
- Information and record clerks, except customer service representatives (5.1%)
- Other management occupations, except farmers and farm managers (4.9%)
- Cashiers (4.6%)
- Secretaries and administrative assistants (4.4%)
- Other office and administrative support workers, including supervisors (3.4%)
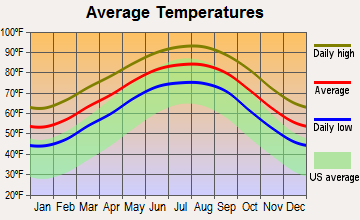
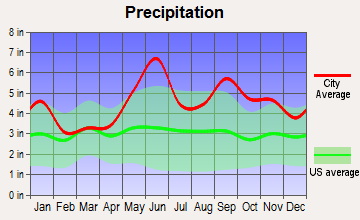
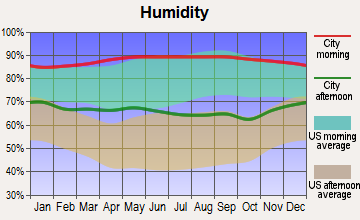
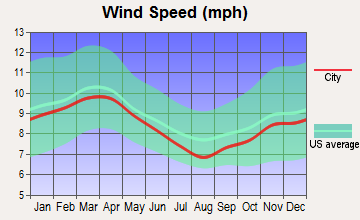
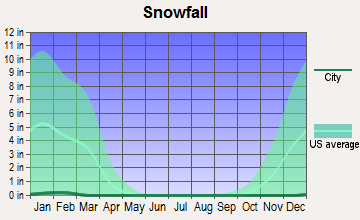
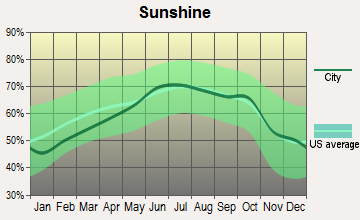
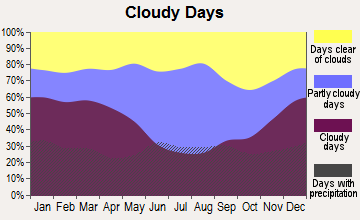
Average climate in Pasadena, Texas
Based on data reported by over 4,000 weather stations
|
|


(lower is better)
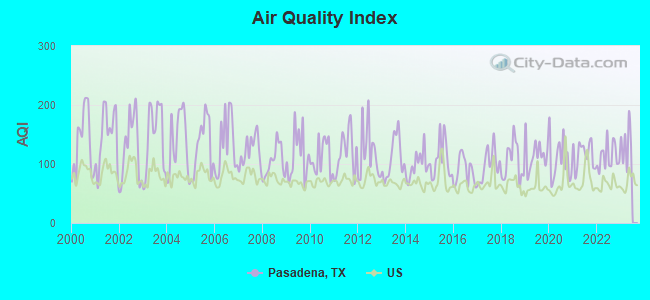
Air Quality Index (AQI) level in 2022 was 112. This is significantly worse than average.
| City: | 112 |
| U.S.: | 73 |
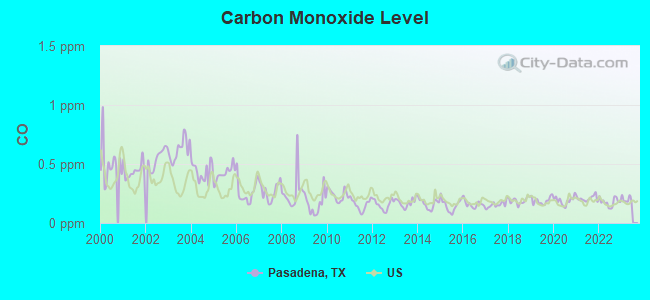
Carbon Monoxide (CO) [ppm] level in 2022 was 0.177. This is significantly better than average. Closest monitor was 2.8 miles away from the city center.
| City: | 0.177 |
| U.S.: | 0.251 |
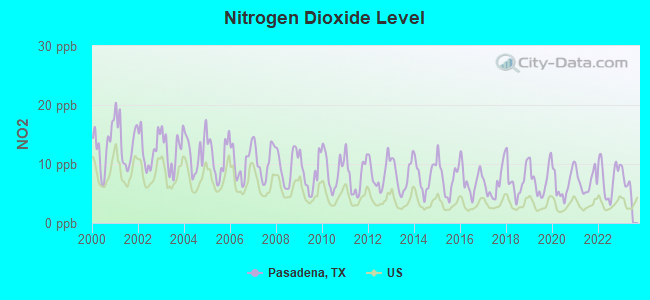
Nitrogen Dioxide (NO2) [ppb] level in 2022 was 7.60. This is significantly worse than average. Closest monitor was 2.6 miles away from the city center.
| City: | 7.60 |
| U.S.: | 5.11 |
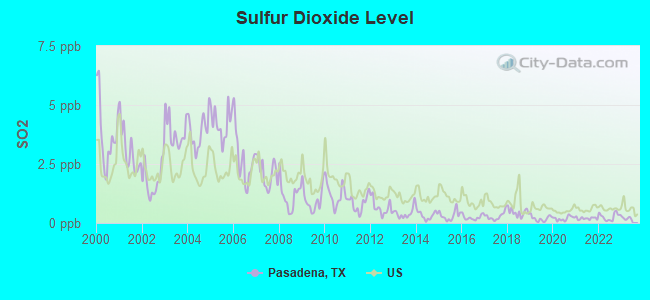
Sulfur Dioxide (SO2) [ppb] level in 2022 was 0.267. This is significantly better than average. Closest monitor was 2.6 miles away from the city center.
| City: | 0.267 |
| U.S.: | 1.515 |
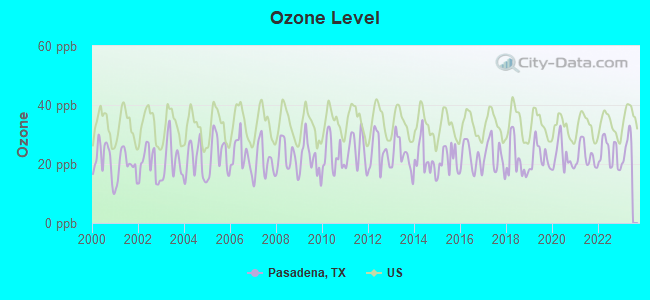
Ozone [ppb] level in 2022 was 23.7. This is significantly better than average. Closest monitor was 2.6 miles away from the city center.
| City: | 23.7 |
| U.S.: | 33.3 |
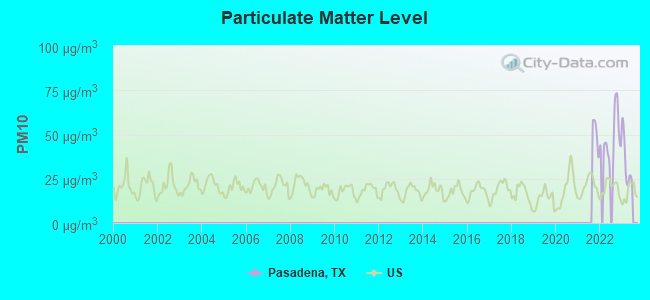
Particulate Matter (PM10) [µg/m3] level in 2022 was 48.1. This is significantly worse than average. Closest monitor was 2.8 miles away from the city center.
| City: | 48.1 |
| U.S.: | 19.2 |
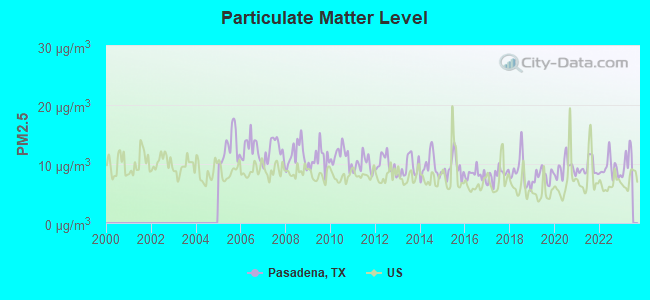
Particulate Matter (PM2.5) [µg/m3] level in 2022 was 9.26. This is about average. Closest monitor was 2.8 miles away from the city center.
| City: | 9.26 |
| U.S.: | 8.11 |
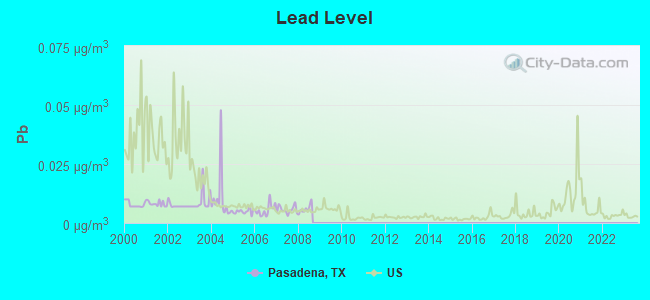
Lead (Pb) [µg/m3] level in 2008 was 0.00590. This is significantly better than average. Closest monitor was 1.3 miles away from the city center.
| City: | 0.00590 |
| U.S.: | 0.00931 |
Tornado activity:
Pasadena-area historical tornado activity is slightly above Texas state average. It is 86% greater than the overall U.S. average.
On 11/21/1992, a category F4 (max. wind speeds 207-260 mph) tornado 7.4 miles away from the Pasadena city center injured 16 people and caused between $50,000,000 and $500,000,000 in damages.
On 9/8/1969, a category F3 (max. wind speeds 158-206 mph) tornado 3.2 miles away from the city center caused between $5000 and $50,000 in damages.
Earthquake activity:
Pasadena-area historical earthquake activity is significantly above Texas state average. It is 38% smaller than the overall U.S. average.On 5/17/2012 at 08:12:00, a magnitude 4.8 (4.8 MW, Depth: 3.1 mi, Class: Light, Intensity: IV - V) earthquake occurred 162.8 miles away from Pasadena center
On 10/20/2011 at 12:24:41, a magnitude 4.8 (4.8 MW, Depth: 3.1 mi) earthquake occurred 184.0 miles away from the city center
On 9/2/2013 at 23:51:15, a magnitude 4.3 (4.3 MW, Depth: 2.9 mi) earthquake occurred 160.7 miles away from the city center
On 9/2/2013 at 21:52:38, a magnitude 4.2 (4.2 MW, Depth: 3.0 mi) earthquake occurred 163.0 miles away from the city center
On 4/9/1993 at 12:29:19, a magnitude 4.3 (4.1 MB, 4.3 LG, Depth: 3.1 mi) earthquake occurred 187.8 miles away from the city center
On 1/25/2013 at 07:01:19, a magnitude 4.1 (4.1 MB, Depth: 3.1 mi) earthquake occurred 158.7 miles away from the city center
Magnitude types: regional Lg-wave magnitude (LG), body-wave magnitude (MB), moment magnitude (MW)
Natural disasters:
The number of natural disasters in Harris County (32) is a lot greater than the US average (15).Major Disasters (Presidential) Declared: 22
Emergencies Declared: 6
Causes of natural disasters: Storms: 16, Floods: 15, Hurricanes: 9, Tornadoes: 7, Tropical Storms: 4, Fires: 2, Winds: 2, Other: 1 (Note: some incidents may be assigned to more than one category).
Hospitals in Pasadena:
- BAYSHORE MEDICAL CENTER (Proprietary, provides emergency services, 4000 SPENCER HWY)
- JUDY LIVING CENTER (2012 JUDY LN)
- PASADENA COTTAGE B (2122 WICHITA)
- PASADENA GENERAL HOSPITAL (1004 SEYMOUR)
- PONCA LIVING CENTER (4314 PONCA ST)
- PRISTINE HOSPITAL OF PASADENA (Proprietary, provides emergency services, 1004 SEYMOUR STREET)
- SAN JACINTO LIVING CENTER (2406 SAN JACINTO ST)
- ST LUKE'S PATIENTS MEDICAL CENTER (Physician, 4600 EAST SAM HOUSTON PARKWAY SOUTH)
- SURGERY SPECIALTY HOSPITALS OF AMERICA SE HOUSTON (Proprietary, 4301 B VISTA)
- TRI CITY REGIONAL HOSPITAL (4040 RED BLUFF RD)
Heliports located in Pasadena:
- 3321 Westside Heliport (XS38)
- Memorial Hospital Heliport (TS88)
- Police Heliport (XS37)
- San Jacinto College Central Campus Heliport (XS16)
Amtrak stations near Pasadena:
- 5 miles: SOUTH HOUSTON (1546 COLLEGE) - Bus Station
- 14 miles: HOUSTON (902 WASHINGTON AVE.) . Services: ticket office, fully wheelchair accessible, enclosed waiting area, public restrooms, public payphones, vending machines, free short-term parking, free long-term parking, taxi stand, public transit connection.
Colleges/Universities in Pasadena:
- San Jacinto Community College (Full-time enrollment: 13,517; Location: 8060 Spencer Hwy; Public; Website: www.sjcd.edu)
- Regency Beauty Institute-Pasadena (Full-time enrollment: 92; Location: 5968 Fairmont Pkwy, Suite A; Private, for-profit; Website: www.regency.edu)
- Interactive Learning Systems-Pasadena (Full-time enrollment: 34; Location: 213 W Southmore St Suite 101; Private, for-profit; Website: ict.edu/pasadena-colleges-in-pasadena-tx/)
- Texas Chiropractic College Foundation Inc (Location: 5912 Spencer Hwy; Private, not-for-profit; Website: www.txchiro.edu; Offers Doctor's degree)
Other colleges/universities with over 2000 students near Pasadena:
- University of Houston-Clear Lake (about 8 miles; Houston, TX; Full-time enrollment: 5,833)
- University of Houston (about 11 miles; Houston, TX; FT enrollment: 31,888)
- Texas Southern University (about 12 miles; Houston, TX; FT enrollment: 7,053)
- Lee College (about 13 miles; Baytown, TX; FT enrollment: 4,278)
- University of Houston-Downtown (about 13 miles; Houston, TX; FT enrollment: 10,122)
- Houston Community College (about 13 miles; Houston, TX; FT enrollment: 38,303)
- The University of Texas Health Science Center at Houston (about 14 miles; Houston, TX; FT enrollment: 3,023)
Public high schools in Pasadena:
- PASADENA MEMORIAL H S (Students: 2,825, Location: 4410 CRENSHAW, Grades: 9-12)
- SAM RAYBURN H S (Students: 2,666, Location: 2121 CHERRYBROOK LN, Grades: 9-12)
- PASADENA HIGH SCHOOL (Students: 2,369, Location: 206 S SHAVER, Grades: 9-12)
- DEEPWATER JR HIGH (Students: 664, Location: 501 GLENMORE, Grades: 6-9)
- TEGELER CAREER CENTER (Location: 4949 BURKE RD, Grades: 6-12)
- GUIDANCE CENTER (Location: 310 BAYSHORE, Grades: 6-12)
- THE SUMMIT (HIGH SCHOOL) (Location: 1838 E SAM HOUSTON PKWY S, Grades: 9-12)
- COMMUNITY SCHOOL (Location: 1838 A E SAM HOUSTON PKWY S, Grades: 9-12)
- CAREER & TECHNICAL H S (Location: 4320 CRENSHAW, Grades: 9-12)
Private high schools in Pasadena:
- FIRST BAPTIST CHRISTIAN ACADEMY (Students: 377, Location: 7500 FAIRMONT PKWY, Grades: PK-12)
- FAITH CHRISTIAN ACADEMY (Students: 73, Location: 3519 BURKE RD, Grades: KG-12)
- PUEBLOS ROYAL CHRISTIAN SCHOOL (Students: 66, Location: 1600 PASADENA BLVD, Grades: PK-11)
- APOSTOLIC CHRISTIAN ACADEMY (Students: 41, Location: 2630 ALLEN GENOA RD, Grades: T1-12)
Biggest public elementary/middle schools in Pasadena:
- CARTER LOMAX MIDDLE (Students: 919, Location: 1519 GENOA RED BLUFF RD, Grades: 5-6)
- BOBBY SHAW MIDDLE (Students: 895, Location: 1200 HOUSTON AVE, Grades: 5-6)
- PARK VIEW INTERMEDIATE (Students: 881, Location: 3003 DABNEY DR, Grades: 6-8)
- BONDY INT (Students: 866, Location: 5101 KEITH RD, Grades: 7-8)
- RICHEY EL (Students: 843, Location: 610 S RICHEY, Grades: PK-4)
- SOUTHMORE INT (Students: 787, Location: 2000 PATRICIA LN, Grades: 7-8)
- BAILEY ELEMENTARY (Students: 785, Location: 2707 LAFFERTY RD, Grades: KG-5)
- FAIRMONT ELEMENTARY (Students: 769, Location: 4315 HEATHFIELD, Grades: KG-5)
- DEEPWATER ELEMENTARY (Students: 764, Location: 309 GLENMORE, Grades: 3-5)
- PARKWOOD ELEMENTARY (Students: 762, Location: 404 PARKWOOD, Grades: KG-2)
Private elementary/middle school in Pasadena:
Points of interest:
Notable locations in Pasadena: Pasadena Town Square (A), Nassau Bay Hilton Marina (B), Parkside Marina (C), Camp Tejas (D), Pasadena Volunteer Fire Department Station 2 (E), Pasadena Volunteer Fire Department Station 3 (F), Pasadena Fire Protection Service (G), Pasadena Fire Chief (H), Pasadena Volunteer Fire Department Station 4 (I), Pasadena Volunteer Fire Department Station 5 (J), Pasadena Volunteer Fire Department Station 6 (K), Pasadena Volunteer Fire Department Station 7 (L), Pasadena Volunteer Fire Department Station 8 (M), Pasadena Volunteer Fire Department Station 9 (N), Pasadena Volunteer Fire Department Station 10 (O), James and Jessie West Mansion (P), Pasadena Fire Marshal's Office (Q), Pasadena Police Department (R), Pasadena Police Academy (S), W Kyle Chapman Courthouse (T). Display/hide their locations on the map
Shopping Centers: Spencer Square Shopping Center (1), Crossroads Center Shopping Center (2), Allendale Shopping Center (3), Fairmont Junction Center Shopping Center (4), Fairmont Plaza Shopping Center (5), Fairway Plaza Shopping Center (6), Pasadena Park Shopping Center (7), Pasadena Shopping Center (8), Randalls Shopping Center (9). Display/hide their locations on the map
Churches in Pasadena include: Central Baptist Church of Pasadena (A), Grace Memorial Baptist Church (B), Golden Acres Baptist Church (C), Liberty Baptist Church (D), Lafferty Road Baptist Church (E), Hope Missionary Baptist Church (F), Saint Pius Convent (G), Alta Vista Baptist Church (H), Bethany Temple Church (I). Display/hide their locations on the map
Lake: Mud Lake (A). Display/hide its location on the map
Streams, rivers, and creeks: Willow Springs Bayou (A), Horsepen Bayou (B), Boggy Bayou (C). Display/hide their locations on the map
Parks in Pasadena include: Grandview Memorial Park (1), Southmore Park (2), Gardens Park (3), Queens Park (4), Sunset Park (5), Strawberry Park (6), Memorial Park (7), Red Bluff Park (8), San Jacinto College Central Soccer Stadium and Track (9). Display/hide their locations on the map
Tourist attraction: Armand Bayou Nature Center (Nature Centers; 8500 Bay Area Boulevard) (1). Display/hide its approximate location on the map
Hotels: Budget Host (4840 Spencer Highway) (1), Apartment Hunters (3611 Turtle Cove Drive) (2). Display/hide their approximate locations on the map
Court: Pasadena-City - Municipal Court (1001 West Shaw Avenue) (1). Display/hide its approximate location on the map
Birthplace of: Tom Prichard - Professional wrestler, Bruce Prichard - Professional wrestling executive, Donnie Elliott - Baseball player, James Robison (televangelist) - Television evangelist, Monika Schultz - Engineer, Duane Walker - Baseball player, Jacob Green - Football player, Mike Kirkland (American football) - Football player, Russell Harvard - Actor, Trey McDowell - College basketball player (Louisiana Tech Bulldogs).
Drinking water stations with addresses in Pasadena and their reported violations in the past:
CEDAR GROVE PARK (Population served: 435, Groundwater):Past monitoring violations:
- Monitoring and Reporting (DBP) - Between JAN-2014 and MAR-2014, Contaminant: Chlorine. Follow-up actions: St Violation/Reminder Notice (JUL-02-2014), St Public Notif requested (JUL-02-2014)
- Follow-up Or Routine LCR Tap M/R - In OCT-01-2013, Contaminant: Lead and Copper Rule
- Monitoring and Reporting (DBP) - Between JUL-2013 and SEP-2013, Contaminant: Chlorine. Follow-up actions: St Violation/Reminder Notice (MAY-20-2014), St Public Notif requested (MAY-20-2014)
- Monitoring and Reporting (DBP) - Between APR-2013 and JUN-2013, Contaminant: Chlorine. Follow-up actions: St Violation/Reminder Notice (NOV-14-2013), St Public Notif requested (NOV-14-2013)
- Monitoring and Reporting (DBP) - Between JAN-2013 and MAR-2013, Contaminant: Chlorine. Follow-up actions: St Violation/Reminder Notice (NOV-14-2013), St Public Notif requested (NOV-14-2013)
- 33 regular monitoring violations
- 17 other older monitoring violations
| This city: | 3.1 people |
| Texas: | 2.8 people |
| This city: | 73.9% |
| Whole state: | 69.9% |
| This city: | 7.3% |
| Whole state: | 6.0% |
Likely homosexual households (counted as self-reported same-sex unmarried-partner households)
- Lesbian couples: 0.3% of all households
- Gay men: 0.2% of all households
People in group quarters in Pasadena in 2010:
- 547 people in nursing facilities/skilled-nursing facilities
- 163 people in correctional facilities intended for juveniles
- 83 people in emergency and transitional shelters (with sleeping facilities) for people experiencing homelessness
- 30 people in group homes intended for adults
- 27 people in local jails and other municipal confinement facilities
- 23 people in residential treatment centers for adults
- 11 people in other noninstitutional facilities
People in group quarters in Pasadena in 2000:
- 747 people in nursing homes
- 115 people in training schools for juvenile delinquents
- 68 people in other noninstitutional group quarters
- 31 people in other group homes
- 25 people in crews of maritime vessels
- 24 people in homes or halfway houses for drug/alcohol abuse
- 17 people in college dormitories (includes college quarters off campus)
- 9 people in homes for the mentally retarded
- 8 people in religious group quarters
- 3 people in hospitals/wards and hospices for chronically ill
- 3 people in hospices or homes for chronically ill
- 3 people in other nonhousehold living situations
Banks with most branches in Pasadena (2011 data):
- JPMorgan Chase Bank, National Association: Pasadena Branch, Pasadena Branch, Shaver Street Branch, Fairmont Banking Center Branch, Spencer Hwy And Red Bluff Branch, East Drive-Up Branch. Info updated 2011/11/10: Bank assets: $1,811,678.0 mil, Deposits: $1,190,738.0 mil, headquarters in Columbus, OH, positive income, International Specialization, 5577 total offices, Holding Company: Jpmorgan Chase & Co.
- Wells Fargo Bank, National Association: Shaver And Southmore Branch, Beltway 8 & Fairmont Parkway Branch, Pasadena Branch, Red Bluff And Spencer, Pasadena Branch. Info updated 2011/04/05: Bank assets: $1,161,490.0 mil, Deposits: $905,653.0 mil, headquarters in Sioux Falls, SD, positive income, 6395 total offices, Holding Company: Wells Fargo & Company
- Bank of America, National Association: Pasadena Motor Branch, Pasadena Branch, Fairmont Banking Store Branch. Info updated 2009/11/18: Bank assets: $1,451,969.3 mil, Deposits: $1,077,176.8 mil, headquarters in Charlotte, NC, positive income, 5782 total offices, Holding Company: Bank Of America Corporation
- Amegy Bank National Association: Pasadena Branch, South Shaver Branch, Red Bluff Branch. Info updated 2007/09/24: Bank assets: $12,197.6 mil, Deposits: $9,733.2 mil, headquarters in Houston, TX, positive income, Commercial Lending Specialization, 97 total offices, Holding Company: Zions Bancorporation
- First National Bank Texas: Pasadena Banking Center - Rc 627 at 1107 South Shaver Street, branch established on 1999/09/15; Spencer Hwy Banking Center - Rc 322 at 6767 Spencer Hwy, branch established on 2004/01/19. Info updated 2006/11/03: Bank assets: $944.3 mil, Deposits: $815.9 mil, headquarters in Killeen, TX, positive income, Mortgage Lending Specialization, 250 total offices, Holding Company: First Community Bancshares, Inc.
- Comerica Bank: Fairmont Parkway-Beltway 8 at 5940 Fairmont Parkway, branch established on 1985/02/14; Spencer Highway Branch at 4041 Spencer Highway, branch established on 1998/01/13. Info updated 2011/07/29: Bank assets: $60,970.5 mil, Deposits: $48,300.9 mil, headquarters in Dallas, TX, positive income, Commercial Lending Specialization, 497 total offices, Holding Company: Comerica Incorporated
- Capital Bank: Fairmont Parkway Branch at 6101 Fairmont Parkway, branch established on 2004/01/22. Info updated 2006/11/03: Bank assets: $264.8 mil, Deposits: $236.3 mil, headquarters in Jacinto City, TX, positive income, Commercial Lending Specialization, 6 total offices, Holding Company: Jane Austin Chapman Limited Partnership, L.P.
- International Bank of Commerce: Fairmont Parkway Branch at 6210 Fairmont Parkway, branch established on 2008/03/13. Info updated 2007/03/28: Bank assets: $9,621.9 mil, Deposits: $6,548.8 mil, headquarters in Laredo, TX, positive income, Commercial Lending Specialization, 197 total offices, Holding Company: International Bancshares Corporation
- Capital One, National Association: W.Pasadena Branch at 3025 Shaver Street, branch established on 2008/11/03. Info updated 2011/07/01: Bank assets: $133,477.8 mil, Deposits: $97,063.7 mil, headquarters in Mclean, VA, positive income, 984 total offices, Holding Company: Capital One Financial Corporation
- 9 other banks with 9 local branches
For population 15 years and over in Pasadena:
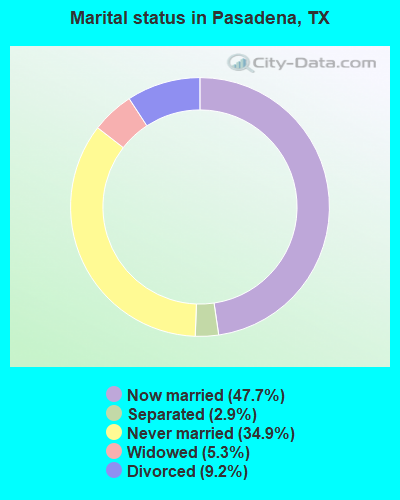
- Never married: 34.9%
- Now married: 47.7%
- Separated: 2.9%
- Widowed: 5.3%
- Divorced: 9.2%
For population 25 years and over in Pasadena:
- High school or higher: 74.2%
- Bachelor's degree or higher: 14.8%
- Graduate or professional degree: 5.7%
- Unemployed: 7.1%
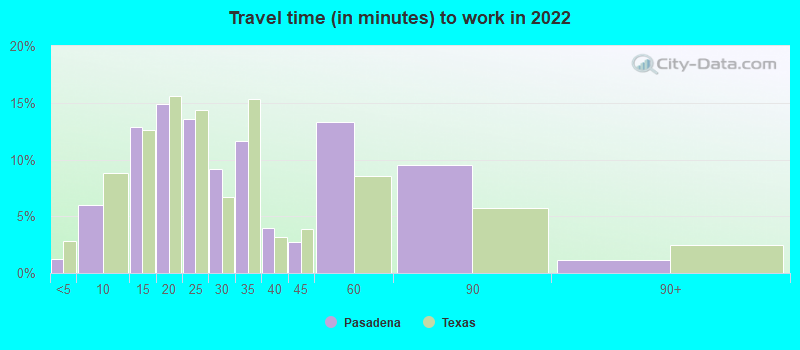
- Mean travel time to work (commute): 21.6 minutes

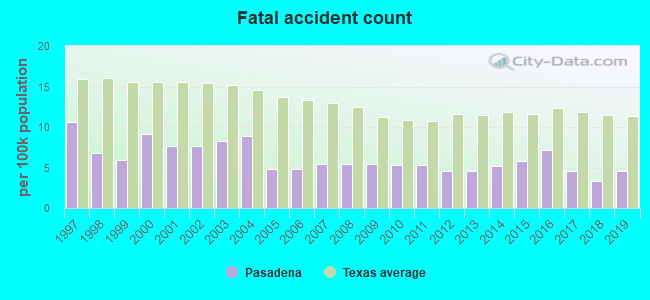
| Here: | 17.6 |
| Texas average: | 14.0 |
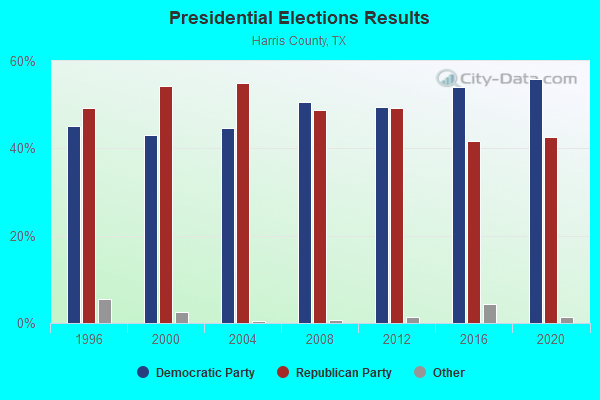
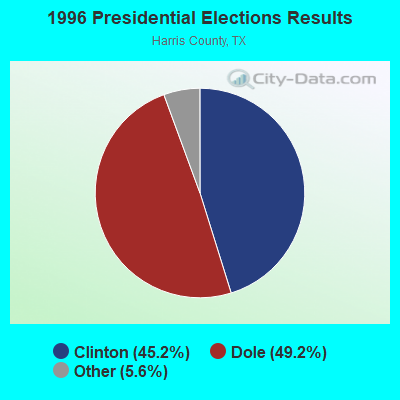
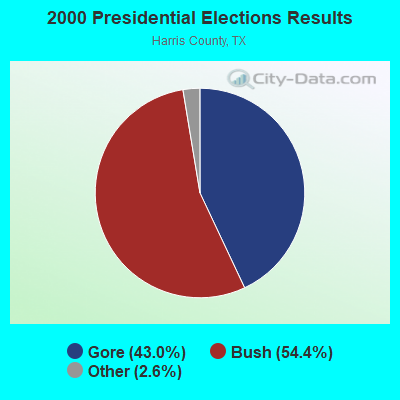
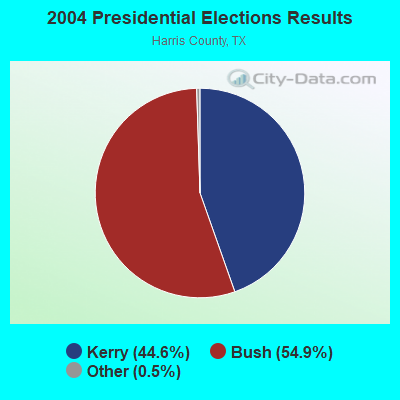
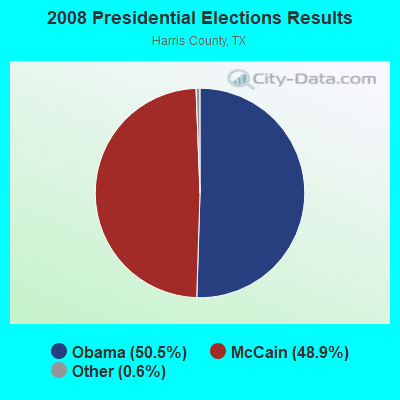
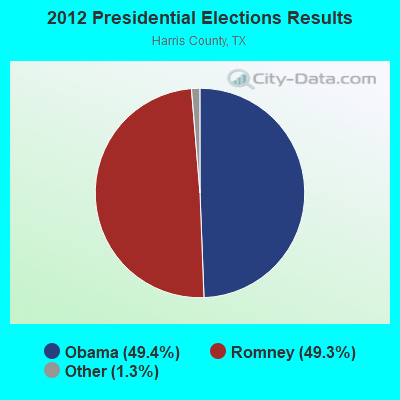
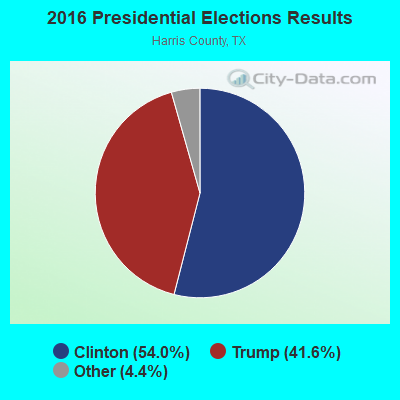
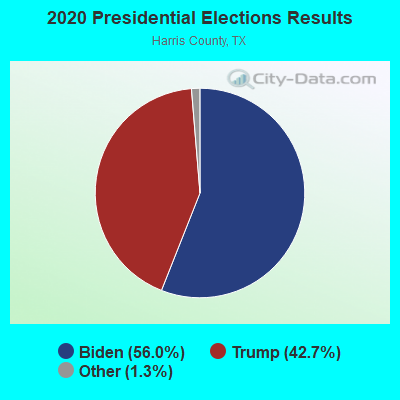
Graphs represent county-level data. Detailed 2008 Election Results
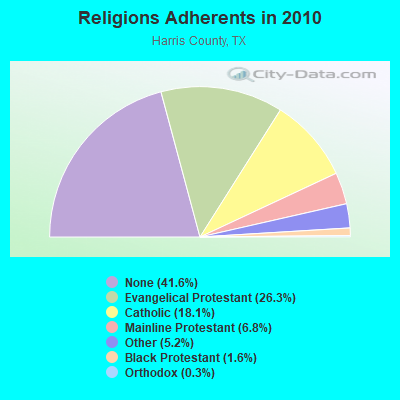
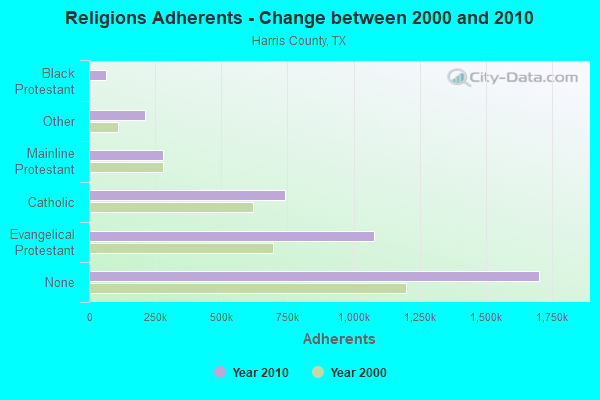
Religion statistics for Pasadena, TX (based on Harris County data)
| Religion | Adherents | Congregations |
|---|---|---|
| Evangelical Protestant | 1,077,287 | 2,102 |
| Catholic | 741,896 | 109 |
| Mainline Protestant | 278,855 | 288 |
| Other | 213,212 | 296 |
| Black Protestant | 65,641 | 211 |
| Orthodox | 12,884 | 25 |
| None | 1,702,684 | - |
Food Environment Statistics:
| Harris County: | 1.88 / 10,000 pop. |
| State: | 1.47 / 10,000 pop. |
| Here: | 0.10 / 10,000 pop. |
| Texas: | 0.14 / 10,000 pop. |
| Harris County: | 1.35 / 10,000 pop. |
| Texas: | 1.11 / 10,000 pop. |
| Harris County: | 3.38 / 10,000 pop. |
| Texas: | 3.95 / 10,000 pop. |
| Harris County: | 5.88 / 10,000 pop. |
| State: | 6.13 / 10,000 pop. |
| This county: | 8.9% |
| Texas: | 8.9% |
| Harris County: | 26.0% |
| Texas: | 26.6% |
| Here: | 17.1% |
| Texas: | 15.7% |
Health and Nutrition:
| Here: | 46.7% |
| Texas: | 48.6% |
| This city: | 45.7% |
| Texas: | 47.4% |
| This city: | 28.3 |
| Texas: | 28.5 |
| Here: | 22.4% |
| Texas: | 20.6% |
| This city: | 10.0% |
| Texas: | 10.3% |
| Here: | 6.8 |
| Texas: | 6.8 |
| This city: | 31.1% |
| Texas: | 33.1% |
| Pasadena: | 55.0% |
| Texas: | 56.2% |
| Pasadena: | 80.6% |
| State: | 80.7% |
More about Health and Nutrition of Pasadena, TX Residents
| Local government employment and payroll (March 2022) | |||||
| Function | Full-time employees | Monthly full-time payroll | Average yearly full-time wage | Part-time employees | Monthly part-time payroll |
|---|---|---|---|---|---|
| Police Protection - Officers | 282 | $2,370,705 | $100,881 | 0 | $0 |
| Other and Unallocable | 97 | $423,491 | $52,391 | 2 | $2,529 |
| Parks and Recreation | 84 | $302,640 | $43,234 | 18 | $13,983 |
| Police - Other | 77 | $399,743 | $62,298 | 3 | $4,646 |
| Solid Waste Management | 54 | $181,555 | $40,346 | 5 | $7,965 |
| Streets and Highways | 51 | $245,883 | $57,855 | 3 | $6,446 |
| Water Supply | 50 | $200,656 | $48,157 | 3 | $4,464 |
| Health | 48 | $183,469 | $45,867 | 1 | $1,400 |
| Sewerage | 42 | $155,737 | $44,496 | 1 | $2,022 |
| Financial Administration | 41 | $279,137 | $81,699 | 0 | $0 |
| Local Libraries | 34 | $140,671 | $49,649 | 5 | $5,757 |
| Judicial and Legal | 30 | $151,889 | $60,756 | 7 | $22,143 |
| Other Government Administration | 29 | $234,578 | $97,067 | 10 | $19,331 |
| Welfare | 14 | $80,768 | $69,230 | 0 | $0 |
| Housing and Community Development (Local) | 11 | $58,628 | $63,958 | 0 | $0 |
| Firefighters | 10 | $59,637 | $71,564 | 6 | $10,363 |
| Fire - Other | 9 | $68,461 | $91,281 | 0 | $0 |
| Totals for Government | 963 | $5,537,649 | $69,005 | 64 | $101,048 |
Pasadena government finances - Expenditure in 2021 (per resident):
- Construction - Local Fire Protection: $11,542,000 ($78.16)
Regular Highways: $11,457,000 ($77.59)
Water Utilities: $8,480,000 ($57.43)
Financial Administration: $4,902,000 ($33.20)
Central Staff Services: $4,010,000 ($27.16)
Parks and Recreation: $663,000 ($4.49)
Housing and Community Development: $2,000 ($0.01)
- Current Operations - Police Protection: $51,056,000 ($345.76)
Water Utilities: $17,461,000 ($118.25)
Parks and Recreation: $12,595,000 ($85.30)
Financial Administration: $12,477,000 ($84.50)
Solid Waste Management: $8,955,000 ($60.65)
Housing and Community Development: $8,860,000 ($60.00)
Regular Highways: $8,449,000 ($57.22)
Sewerage: $8,217,000 ($55.65)
Local Fire Protection: $5,891,000 ($39.90)
Central Staff Services: $5,872,000 ($39.77)
Health - Other: $5,814,000 ($39.37)
General Public Buildings: $4,535,000 ($30.71)
Libraries: $3,447,000 ($23.34)
Judicial and Legal Services: $2,211,000 ($14.97)
- General - Interest on Debt: $3,862,000 ($26.15)
- Other Capital Outlay - Local Fire Protection: $3,529,000 ($23.90)
Police Protection: $3,156,000 ($21.37)
Financial Administration: $524,000 ($3.55)
Libraries: $219,000 ($1.48)
Central Staff Services: $129,000 ($0.87)
Health - Other: $63,000 ($0.43)
Parks and Recreation: $20,000 ($0.14)
- Total Salaries and Wages: $77,453,000 ($524.53)
- Water Utilities - Interest on Debt: $2,766,000 ($18.73)
Pasadena government finances - Revenue in 2021 (per resident):
- Charges - Sewerage: $14,398,000 ($97.51)
Solid Waste Management: $9,192,000 ($62.25)
Parks and Recreation: $857,000 ($5.80)
- Federal Intergovernmental - Housing and Community Development: $9,920,000 ($67.18)
- Local Intergovernmental - Public Welfare: $3,984,000 ($26.98)
- Miscellaneous - Fines and Forfeits: $4,028,000 ($27.28)
Interest Earnings: $3,074,000 ($20.82)
General Revenue - Other: $1,335,000 ($9.04)
Sale of Property: $128,000 ($0.87)
- Revenue - Water Utilities: $30,596,000 ($207.20)
- State Intergovernmental - Other: $13,692,000 ($92.73)
General Local Government Support: $254,000 ($1.72)
- Tax - Property: $58,070,000 ($393.26)
General Sales and Gross Receipts: $36,669,000 ($248.33)
Other Selective Sales: $23,237,000 ($157.37)
Public Utilities Sales: $8,987,000 ($60.86)
Occupation and Business License - Other: $2,227,000 ($15.08)
Pasadena government finances - Debt in 2021 (per resident):
- Long Term Debt - Beginning Outstanding - Unspecified Public Purpose: $288,894,000 ($1956.45)
Outstanding Unspecified Public Purpose: $238,121,000 ($1612.61)
Retired Unspecified Public Purpose: $113,415,000 ($768.07)
Issue, Unspecified Public Purpose: $62,643,000 ($424.23)
Pasadena government finances - Cash and Securities in 2021 (per resident):
- Bond Funds - Cash and Securities: $32,498,000 ($220.08)
- Other Funds - Cash and Securities: $230,489,000 ($1560.92)
- Sinking Funds - Cash and Securities: $3,182,000 ($21.55)
5.26% of this county's 2021 resident taxpayers lived in other counties in 2020 ($67,872 average adjusted gross income)
| Here: | 5.26% |
| Texas average: | 8.12% |
0.02% of residents moved from foreign countries ($158 average AGI)
Harris County: 0.02% Texas average: 0.04%
Top counties from which taxpayers relocated into this county between 2020 and 2021:
| from Fort Bend County, TX | |
| from Montgomery County, TX | |
| from Galveston County, TX |
5.91% of this county's 2020 resident taxpayers moved to other counties in 2021 ($76,622 average adjusted gross income)
| Here: | 5.91% |
| Texas average: | 7.40% |
0.01% of residents moved to foreign countries ($155 average AGI)
Harris County: 0.01% Texas average: 0.03%
Top counties to which taxpayers relocated from this county between 2020 and 2021:
| to Fort Bend County, TX | |
| to Montgomery County, TX | |
| to Brazoria County, TX |
| Businesses in Pasadena, TX | ||||
| Name | Count | Name | Count | |
|---|---|---|---|---|
| 24 Hour Fitness | 1 | Journeys | 1 | |
| 99 Cents Only Stores | 1 | KFC | 4 | |
| AT&T | 2 | Kohl's | 1 | |
| Academy Sports + Outdoors | 1 | Kroger | 3 | |
| Advance Auto Parts | 2 | La Quinta | 2 | |
| Alco Stores | 1 | Lane Bryant | 1 | |
| Applebee's | 1 | Lane Furniture | 2 | |
| Arby's | 1 | Little Caesars Pizza | 2 | |
| Ashley Furniture | 1 | Long John Silver's | 3 | |
| AutoZone | 5 | Lowe's | 1 | |
| Avenue | 1 | Macy's | 1 | |
| Barnes & Noble | 1 | Marshalls | 1 | |
| Bath & Body Works | 1 | McDonald's | 9 | |
| Bed Bath & Beyond | 1 | Men's Wearhouse | 1 | |
| Blockbuster | 1 | Motel 6 | 1 | |
| Burger King | 3 | Motherhood Maternity | 2 | |
| CVS | 3 | Nike | 6 | |
| Casual Male XL | 1 | Office Depot | 2 | |
| Chevrolet | 1 | OfficeMax | 1 | |
| Chick-Fil-A | 1 | Old Navy | 1 | |
| Chipotle | 1 | Panera Bread | 1 | |
| Chuck E. Cheese's | 1 | Papa John's Pizza | 1 | |
| Church's Chicken | 4 | Payless | 4 | |
| Cricket Wireless | 10 | Penske | 1 | |
| Curves | 1 | PetSmart | 1 | |
| DHL | 2 | Pier 1 Imports | 1 | |
| Dairy Queen | 2 | Pizza Hut | 4 | |
| Dennys | 2 | Popeyes | 1 | |
| Discount Tire | 3 | Quiznos | 2 | |
| Domino's Pizza | 1 | RadioShack | 3 | |
| DressBarn | 1 | Red Lobster | 1 | |
| Dressbarn | 1 | SAS Shoes | 1 | |
| Dunkin Donuts | 1 | SONIC Drive-In | 2 | |
| Econo Lodge | 1 | Sears | 4 | |
| Famous Footwear | 1 | Sprint Nextel | 2 | |
| Fashion Bug | 1 | Starbucks | 4 | |
| FedEx | 13 | Subway | 9 | |
| Finish Line | 1 | Super 8 | 1 | |
| Firestone Complete Auto Care | 1 | T-Mobile | 7 | |
| Foot Locker | 1 | Taco Bell | 5 | |
| GNC | 4 | Target | 1 | |
| GameStop | 3 | Toys"R"Us | 2 | |
| Goodwill | 1 | True Value | 1 | |
| H&R Block | 5 | U-Haul | 5 | |
| Hilton | 1 | UPS | 7 | |
| Hobby Lobby | 1 | Vans | 2 | |
| Holiday Inn | 1 | Verizon Wireless | 1 | |
| Home Depot | 1 | Waffle House | 1 | |
| IHOP | 2 | Walgreens | 6 | |
| InTown Suites | 1 | Walmart | 2 | |
| JCPenney | 1 | Wendy's | 2 | |
| Jack In The Box | 5 | YMCA | 1 | |
| Jones New York | 1 | |||
Strongest AM radio stations in Pasadena:
- KLVL (1480 AM; 3 kW; PASADENA, TX; Owner: SIGA BROADCASTING CORP.)
- KXYZ (1320 AM; 5 kW; HOUSTON, TX; Owner: BLAYA INC.)
- KIKK (650 AM; daytime; 0 kW; PASADENA, TX; Owner: TEXAS INFINITY BROADCASTING L.P.)
- KTRH (740 AM; 50 kW; HOUSTON, TX; Owner: AMFM TEXAS LICENSES LIMITED PARTNERSHIP)
- KCOH (1430 AM; 5 kW; HOUSTON, TX; Owner: KCOH, INC.)
- KPRC (950 AM; 5 kW; HOUSTON, TX; Owner: CCB TEXAS LICENSES, L.P.)
- KGOL (1180 AM; 50 kW; HUMBLE, TX; Owner: ENTRAVISION HOLDINGS, LLC)
- KLAT (1010 AM; 10 kW; HOUSTON, TX; Owner: TICHENOR LICENSE CORPORATION ("TLC"))
- KILE (1560 AM; 50 kW; BELLAIRE, TX; Owner: THE RAFTT CORPORATION)
- KWWJ (1360 AM; 5 kW; BAYTOWN, TX; Owner: SALT OF THE EARTH BROADCASTING, INC.)
- KILT (610 AM; 5 kW; HOUSTON, TX; Owner: TEXAS INFINITY BROADCASTING L.P.)
- KEYH (850 AM; 10 kW; HOUSTON, TX; Owner: LIBERMAN BROADCASTING OF HOUSTON LICENSE CORP.)
- KKHT (1070 AM; 10 kW; HOUSTON, TX; Owner: SOUTH TEXAS BROADCASTING, INC.)
Strongest FM radio stations in Pasadena:
- KFTG (88.1 FM; PASADENA, TX; Owner: ALELUYA CHRISTIAN BROADCASTING, INC.)
- KMJQ (102.1 FM; HOUSTON, TX; Owner: RADIO ONE LICENSES, LLC)
- KLTN (102.9 FM; HOUSTON, TX; Owner: HBC HOUSTON LICENSE CORPORATION)
- KUHF (88.7 FM; HOUSTON, TX; Owner: UNIVERSITY OF HOUSTON SYSTEM)
- KBXX (97.9 FM; HOUSTON, TX; Owner: RADIO ONE LICENSES, LLC)
- KHJZ-FM (95.7 FM; HOUSTON, TX; Owner: TEXAS INFINITY BROADCASTING L.P.)
- KHMX (96.5 FM; HOUSTON, TX; Owner: CITICASTERS LICENSES, L.P.)
- KILT-FM (100.3 FM; HOUSTON, TX; Owner: TEXAS INFINITY BROADCASTING L.P.)
- KKBQ-FM (92.9 FM; PASADENA, TX; Owner: CXR HOLDINGS, INC.)
- KLOL (101.1 FM; HOUSTON, TX; Owner: AMFM TEXAS LICENSES LIMITED PARTNERSHIP)
- KODA (99.1 FM; HOUSTON, TX; Owner: AMFM TEXAS LICENSES LIMITED PARTNERSHIP)
- KTBZ-FM (94.5 FM; HOUSTON, TX; Owner: AMFM TEXAS LICENSES LIMITED PARTNERSHIP)
- KRBE (104.1 FM; HOUSTON, TX; Owner: KRBE LICO, INC.)
- KKRW (93.7 FM; HOUSTON, TX; Owner: CAPSTAR TX LIMITED PARTNERSHIP)
- KHCB-FM (105.7 FM; HOUSTON, TX; Owner: HOUSTON CHRISTIAN BROADCASTERS, INC.)
- KLDE (107.5 FM; LAKE JACKSON, TX; Owner: CXR HOLDINGS, INC.)
- KPTY (104.9 FM; MISSOURI CITY, TX; Owner: TICHENOR LICENSE CORPORATION ("TLC"))
- KOVE-FM (106.5 FM; GALVESTON, TX; Owner: HBC LICENSE CORPORATION)
- KHPT (106.9 FM; CONROE, TX; Owner: CXR HOLDINGS, INC.)
- KQBU-FM (93.3 FM; PORT ARTHUR, TX; Owner: TICHENOR LICENSE CORPORATION ("TLC"))
TV broadcast stations around Pasadena:
- KJIB-LP (Channel 5; CLEAR LAKE CITY, TX; Owner: FAR EASTERN TELECASTERS)
- KTMD (Channel 48; GALVESTON, TX; Owner: TELEMUNDO OF TEXAS PARTNERSHIP, LP)
- KVQT-LP (Channel 24; HOUSTON, TX; Owner: C. DOWEN JOHNSON)
- KPRC-TV (Channel 2; HOUSTON, TX; Owner: POST-NEWSWEEK STATIONS, HOUSTON, LP)
- KHOU-TV (Channel 11; HOUSTON, TX; Owner: KHOU-TV, L.P.)
- KRIV (Channel 26; HOUSTON, TX; Owner: FOX TELEVISION STATIONS, INC.)
- KTRK-TV (Channel 13; HOUSTON, TX; Owner: KTRK TELEVISION, INC.)
- KLTJ (Channel 22; GALVESTON, TX; Owner: WORD OF GOD FELLOWSHIP, INC.)
- KHWB (Channel 39; HOUSTON, TX; Owner: KHWB, INC.)
- KNWS-TV (Channel 51; KATY, TX; Owner: JOHNSON BROADCASTING, INC.)
- KVVV-LP (Channel 53; HOUSTON, TX; Owner: KAZH LICENSE, LLC)
- KUHT (Channel 8; HOUSTON, TX; Owner: UNIVERSITY OF HOUSTON SYSTEM)
- KPXB (Channel 49; CONROE, TX; Owner: PAXSON HOUSTON LICENSE, INC.)
- KFTH (Channel 67; ALVIN, TX; Owner: TELEFUTURA HOUSTON LLC)
- KXLN-TV (Channel 45; ROSENBERG, TX; Owner: KXLN LICENSE PARTNERSHIP, L.P.)
- KTBU (Channel 55; CONROE, TX; Owner: HUMANITY INTERESTED MEDIA, INC.)
- KTXH (Channel 20; HOUSTON, TX; Owner: FOX TELEVISION STATIONS, INC.)
- KZJL (Channel 61; HOUSTON, TX; Owner: KZJL LICENSE CORP.)
- KETH (Channel 14; HOUSTON, TX; Owner: COMMUNITY EDUCATIONAL TV, INC.)
- KHLM-LP (Channel 43; HOUSTON, TX; Owner: U.S. INTERACTIVE, L.L.C.)
- KVDO-LP (Channel 69; CLEAR LAKE, TX; Owner: FAR EASTERN TELECASTERS)
- KBPX-LP (Channel 33; HOUSTON, TX; Owner: PAXSON COMMUNICATIONS LPTV, INC.)
- KAZH (Channel 57; BAYTOWN, TX; Owner: KAZH LICENSE, LLC)
- K30CV (Channel 30; HOUSTON, TX; Owner: BROADCASTING SYSTEMS, INC.)
- KHMV-LP (Channel 28; HOUSTON, TX; Owner: PAPPAS TELECASTING OF THE GULF COAST, A CALIFORNIA LP)
- National Bridge Inventory (NBI) Statistics
- 201Number of bridges
- 3,878ft / 1,182mTotal length
- $3,962,000Total costs
- 3,776,878Total average daily traffic
- 269,263Total average daily truck traffic
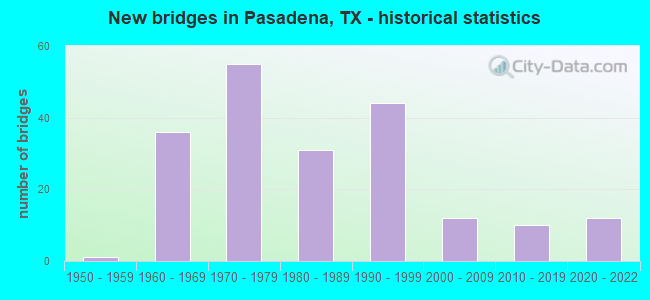
- New bridges - historical statistics
- 11950-1959
- 361960-1969
- 551970-1979
- 311980-1989
- 441990-1999
- 122000-2009
- 102010-2019
- 122020-2022
FCC Registered Antenna Towers: 451 (See the full list of FCC Registered Antenna Towers)
FCC Registered Commercial Land Mobile Towers: 1 (See the full list of FCC Registered Commercial Land Mobile Towers in Pasadena, TX)
FCC Registered Broadcast Land Mobile Towers: 175 (See the full list of FCC Registered Broadcast Land Mobile Towers)
FCC Registered Microwave Towers: 229 (See the full list of FCC Registered Microwave Towers in this town)
FCC Registered Paging Towers: 4 (See the full list of FCC Registered Paging Towers)
FCC Registered Maritime Coast & Aviation Ground Towers: 7 (See the full list of FCC Registered Maritime Coast & Aviation Ground Towers)
FCC Registered Amateur Radio Licenses: 314 (See the full list of FCC Registered Amateur Radio Licenses in Pasadena)
FAA Registered Aircraft: 35 (See the full list of FAA Registered Aircraft in Pasadena)
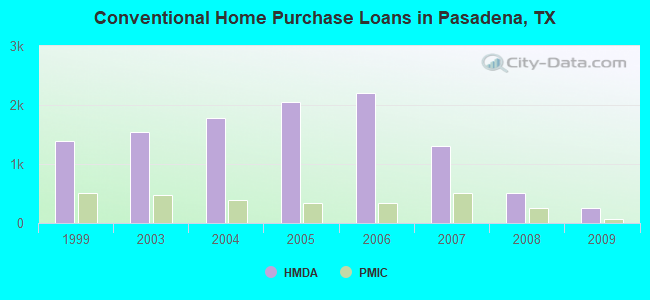
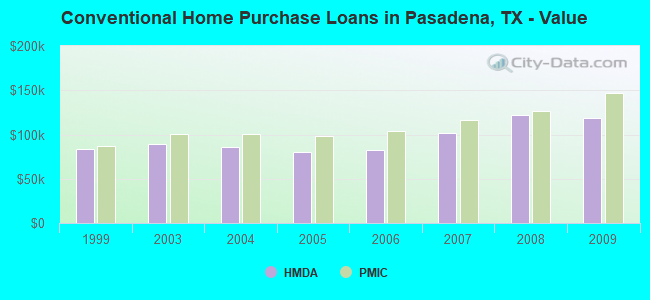
| Home Mortgage Disclosure Act Aggregated Statistics For Year 2009 (Based on 23 full and 10 partial tracts) | ||||||||||||||
| A) FHA, FSA/RHS & VA Home Purchase Loans | B) Conventional Home Purchase Loans | C) Refinancings | D) Home Improvement Loans | E) Loans on Dwellings For 5+ Families | F) Non-occupant Loans on < 5 Family Dwellings (A B C & D) | G) Loans On Manufactured Home Dwelling (A B C & D) | ||||||||
|---|---|---|---|---|---|---|---|---|---|---|---|---|---|---|
| Number | Average Value | Number | Average Value | Number | Average Value | Number | Average Value | Number | Average Value | Number | Average Value | Number | Average Value | |
| LOANS ORIGINATED | 415 | $120,743 | 257 | $118,746 | 719 | $123,338 | 91 | $40,857 | 8 | $1,997,972 | 75 | $75,429 | 5 | $46,790 |
| APPLICATIONS APPROVED, NOT ACCEPTED | 27 | $101,239 | 22 | $129,982 | 92 | $119,925 | 14 | $25,986 | 1 | $1,700,000 | 7 | $148,780 | 1 | $47,720 |
| APPLICATIONS DENIED | 71 | $114,391 | 78 | $103,685 | 470 | $104,200 | 180 | $31,324 | 2 | $5,625,000 | 34 | $78,939 | 16 | $49,144 |
| APPLICATIONS WITHDRAWN | 55 | $116,168 | 34 | $133,723 | 191 | $116,591 | 25 | $33,644 | 0 | $0 | 12 | $79,592 | 2 | $59,500 |
| FILES CLOSED FOR INCOMPLETENESS | 22 | $119,670 | 15 | $144,537 | 57 | $112,607 | 14 | $54,352 | 0 | $0 | 10 | $61,341 | 1 | $15,000 |
Detailed mortgage data for all 34 tracts in Pasadena, TX
| Private Mortgage Insurance Companies Aggregated Statistics For Year 2009 (Based on 19 full and 9 partial tracts) | ||||||
| A) Conventional Home Purchase Loans | B) Refinancings | C) Non-occupant Loans on < 5 Family Dwellings (A & B) | ||||
|---|---|---|---|---|---|---|
| Number | Average Value | Number | Average Value | Number | Average Value | |
| LOANS ORIGINATED | 64 | $147,263 | 32 | $146,641 | 0 | $0 |
| APPLICATIONS APPROVED, NOT ACCEPTED | 27 | $118,857 | 15 | $128,507 | 2 | $116,000 |
| APPLICATIONS DENIED | 9 | $151,733 | 6 | $123,160 | 0 | $0 |
| APPLICATIONS WITHDRAWN | 3 | $106,263 | 1 | $120,840 | 0 | $0 |
| FILES CLOSED FOR INCOMPLETENESS | 1 | $168,000 | 0 | $0 | 0 | $0 |
2002 - 2018 National Fire Incident Reporting System (NFIRS) incidents
- Fire incident types reported to NFIRS in Pasadena, TX
- 1,15937.4%Structure Fires
- 93330.1%Outside Fires
- 73423.7%Mobile Property/Vehicle Fires
- 2708.7%Other
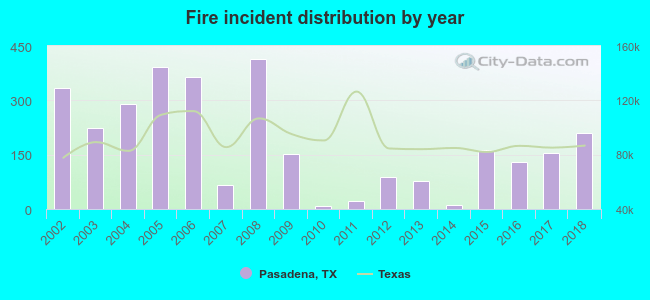 According to the data from the years 2002 - 2018 the average number of fires per year is 182. The highest number of reported fire incidents - 413 took place in 2008, and the least - 7 in 2010. The data has a declining trend.
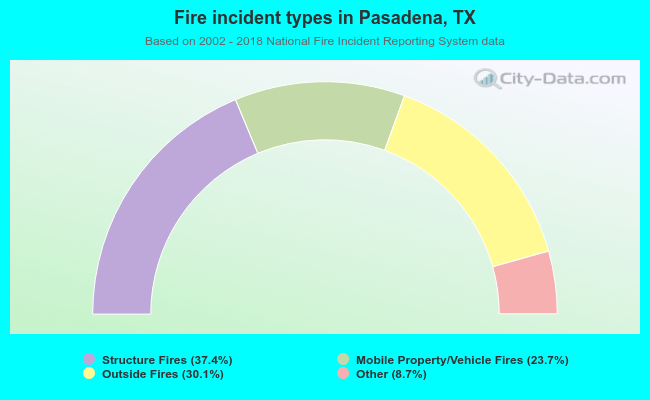 When looking into fire subcategories, the most reports belonged to: Structure Fires (37.4%), and Outside Fires (30.1%).
Fire-safe hotels and motels in Pasadena, Texas:
- Days Inn, 2601 Spencer Hwy, Pasadena, Texas 77504 , Phone: (713) 910-6100
- Americas Best Value Inn, 823 W Pasadena Fwy, Pasadena, Texas 77506 , Phone: (713) 477-4266
- Intown Suites Pasadena, 6330 Fairmont Pkwy, Pasadena, Texas 77505 , Phone: (281) 991-7897, Fax: (281) 998-9836
- La Quinta Inns & Suites Pasadena, 3490 E Sam Houston Expressway Pkwy, Pasadena, Texas 77505 , Phone: (281) 991-7771, Fax: (281) 991-7785
- Comfort Inn Pasadena, 2205 Pasadena Fwy, Pasadena, Texas 77502 , Phone: (713) 475-2205, Fax: (713) 475-2206
- Hampton Inn & Suites Pasadena Texas, 4741 E Sam Houston Parkway S, Pasadena, Texas 77505 , Phone: (281) 998-3300, Fax: (281) 998-3301
- Holiday Inn Express & Suites Pasadena, 5450 Vista Rd, Pasadena, Texas 77505 , Phone: (281) 487-8888, Fax: (281) 487-8890
- Residence Inn Houston Pasadena, 4711 E Sam Houston Parkway S, Pasadena, Texas 77505 , Phone: (888) 236-2427, Fax: (831) 328-0451
- 4 other hotels and motels
| Most common first names in Pasadena, TX among deceased individuals | ||
| Name | Count | Lived (average) |
|---|---|---|
| James | 450 | 70.1 years |
| John | 431 | 70.6 years |
| Mary | 420 | 75.2 years |
| William | 415 | 71.5 years |
| Robert | 303 | 68.1 years |
| Charles | 229 | 68.8 years |
| George | 174 | 72.0 years |
| Dorothy | 151 | 75.5 years |
| Thomas | 149 | 70.4 years |
| Helen | 120 | 77.4 years |
| Most common last names in Pasadena, TX among deceased individuals | ||
| Last name | Count | Lived (average) |
|---|---|---|
| Smith | 223 | 69.7 years |
| Williams | 156 | 74.0 years |
| Johnson | 141 | 71.3 years |
| Davis | 117 | 74.9 years |
| Jones | 116 | 72.7 years |
| Brown | 101 | 73.6 years |
| Wilson | 87 | 74.0 years |
| Miller | 82 | 71.8 years |
| Moore | 73 | 72.0 years |
| Garcia | 71 | 65.8 years |
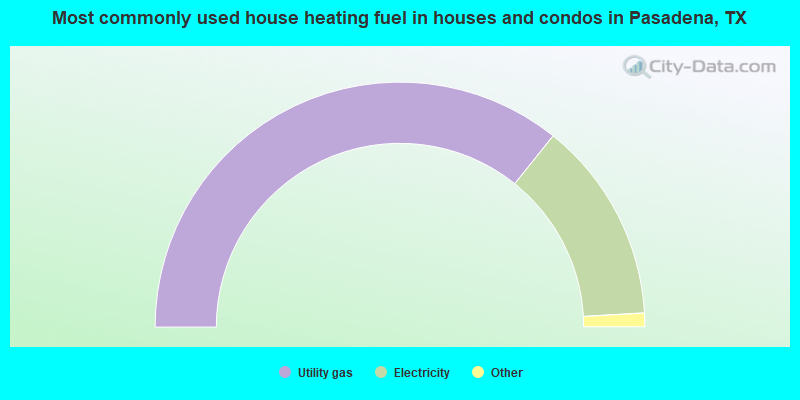
- 71.5%Utility gas
- 26.7%Electricity
- 0.9%Bottled, tank, or LP gas
- 0.5%No fuel used
- 0.2%Coal or coke
- 0.1%Other fuel
- 0.1%Fuel oil, kerosene, etc.
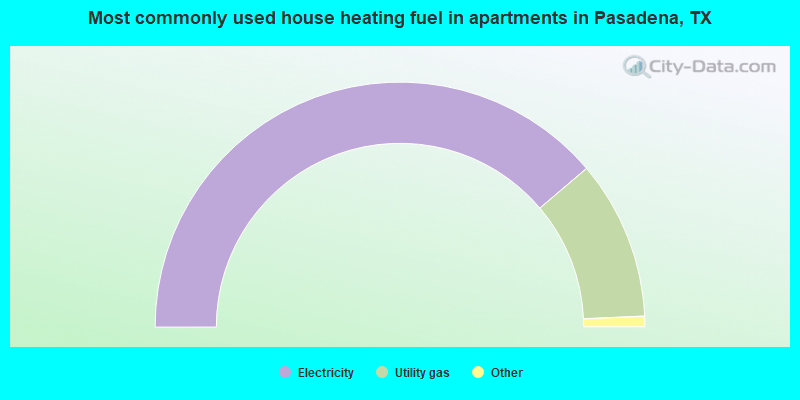
- 77.6%Electricity
- 21.0%Utility gas
- 0.7%No fuel used
- 0.6%Bottled, tank, or LP gas
Pasadena compared to Texas state average:
- Unemployed percentage below state average.
- Black race population percentage below state average.
- Hispanic race population percentage above state average.
- Foreign-born population percentage above state average.
- Length of stay since moving in significantly above state average.
- House age significantly below state average.
Pasadena, TX compared to other similar cities:
Pasadena on our top lists:
- #4 on the list of "Top 101 cities with largest percentage of males in industries: construction (population 50,000+)"
- #5 on the list of "Top 101 cities with largest percentage of males in occupations: construction and extraction occupations (population 50,000+)"
- #6 on the list of "Top 101 cities with the most people below the poverty level, excluding cities with 15% or more of residents in college and with the median age below 28 (population 50,000+)"
- #7 on the list of "Top 101 cities with the smallest percentages of current college students (population 100,000+)"
- #13 on the list of "Top 101 cities with the most people below 50% of the poverty level, excluding cities with 15% or more of residents in college and with the median age below 28 (population 50,000+)"
- #16 on the list of "Top 101 cities with largest percentage of females in industries: construction (population 50,000+)"
- #20 on the list of "Top 101 cities with the least people having professional degrees (population 50,000+)"
- #22 on the list of "Top 101 cities with the highest average humidity (population 50,000+)"
- #28 on the list of "Top 101 cities with largest percentage of females in occupations: fire fighting and prevention workers including supervisors (population 50,000+)"
- #29 on the list of "Top 101 cities with the smallest percentage of elementary and middle school students in private schools (5,000+ students)"
- #37 on the list of "Top 100 cities with lowest ratio of median house value to median household income (pop. 50,000+)"
- #38 on the list of "Top 101 cities with the largest percentage of people in crews of maritime vessels (population 1,000+)"
- #47 on the list of "Top 101 cities with the lowest percentage of workers working at home, population 50,000+"
- #52 on the list of "Top 101 cities with the lowest cost per building permit (population 50,000+)"
- #52 on the list of "Top 100 least-educated cities (pop. 50,000+)"
- #53 on the list of "Top 101 cities with the smallest differences between morning and afternoon humidity (population 50,000+)"
- #53 on the list of "Top 101 cities with the smallest humidity differences during a year (population 50,000+)"
- #55 on the list of "Top 101 cities with largest percentage of males in industries: other services, except public administration (population 50,000+)"
- #56 on the list of "Top 101 cities with largest percentage of males in occupations: installation, maintenance, and repair occupations (population 50,000+)"
- #61 on the list of "Top 101 cities with the least people having Master's or Doctorate degrees (population 50,000+)"
- #1 on the list of "Top 101 counties with the most Mainline Protestant adherents"
- #1 on the list of "Top 101 counties with the most Evangelical Protestant adherents"
- #2 on the list of "Top 101 counties with the most Evangelical Protestant congregations"
- #3 on the list of "Top 101 counties with the highest ground withdrawal of fresh water for public supply"
- #6 on the list of "Top 101 counties with the most Mainline Protestant congregations (pop. 50,000+)"

|
|
Total of 465 patent applications in 2008-2024.