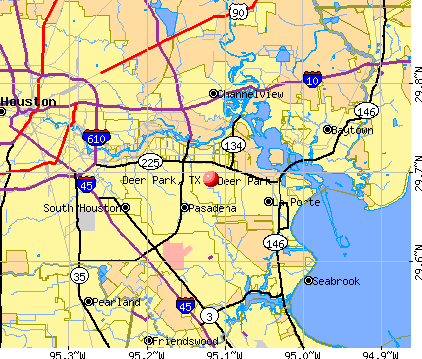
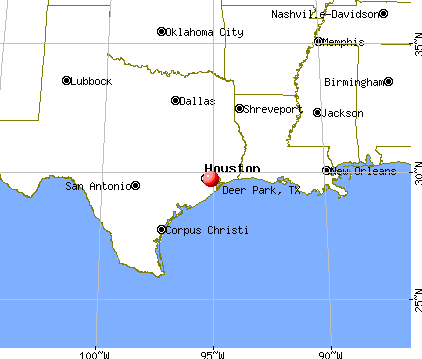
Deer Park, Texas
Submit your own pictures of this city and show them to the world
- OSM Map
- General Map
- Google Map
- MSN Map
Population change since 2000: +17.3%
 |
| Males: 16,691 | |
| Females: 16,777 |
| Median resident age: | 37.2 years |
| Texas median age: | 35.6 years |
Zip codes: 77503, 77505, 77536, 77571.
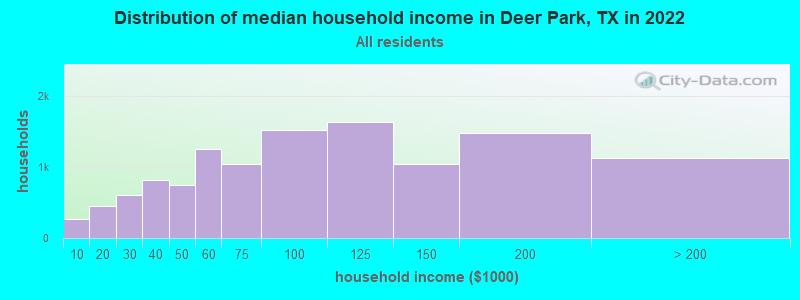
Deer Park Zip Code Map| Deer Park: | $86,594 |
| TX: | $72,284 |
Estimated per capita income in 2022: $37,111 (it was $24,440 in 2000)
Deer Park city income, earnings, and wages data
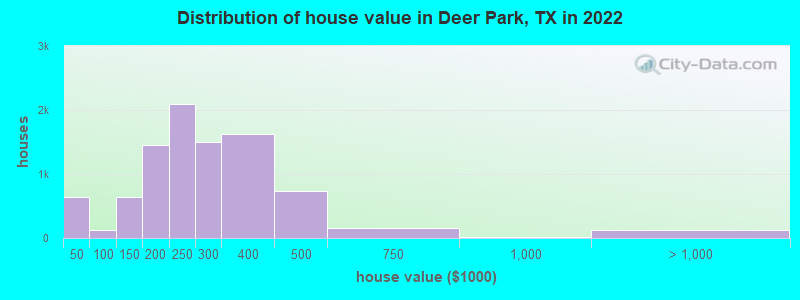
Estimated median house or condo value in 2022: $251,546 (it was $90,200 in 2000)
| Deer Park: | $251,546 |
| TX: | $275,400 |
Mean prices in 2022: all housing units: $351,842; detached houses: $364,274; townhouses or other attached units: $318,336; in 2-unit structures: $370,492; in 3-to-4-unit structures: $220,695; in 5-or-more-unit structures: $300,125; mobile homes: $115,450; occupied boats, rvs, vans, etc.: $137,528
Median gross rent in 2022: $1,273.
(6.1% for White Non-Hispanic residents, 0.3% for Black residents, 8.1% for Hispanic or Latino residents, 14.7% for American Indian residents, 9.3% for other race residents, 9.9% for two or more races residents)
Detailed information about poverty and poor residents in Deer Park, TX


Compare current foreclosures near Deer Park, TX:
| Photo | Address | Area | Beds / Baths | Price | Details |
|---|---|---|---|---|---|

|
#1
Robinwood Dr
Deer Park, TX 77536
|
2,621 sq. feet
|
2 baths 3 beds |
show details | |

|
#2
Regency Dr
Deer Park, TX 77536
|
2,500 sq. feet
|
2 baths 5 beds |
show details | |

|
#3
Harrison Dr
Deer Park, TX 77536
|
1,550 sq. feet
|
2 baths 3 beds |
show details | |

|
#4
Bradshire Ct
Deer Park, TX 77536
|
1,578 sq. feet
|
2 baths 3 beds |
show details | |

|
#5
Rutgers Ln
Deer Park, TX 77536
|
1,470 sq. feet
|
2 baths 4 beds |
show details | |

|
#6
Stoney Brook Dr
Deer Park, TX 77536
|
2,452 sq. feet
|
2 baths 4 beds |
show details | |

|
#7
N Kaufman Dr
Deer Park, TX 77536
|
3,769 sq. feet
|
3 baths 5 beds |
show details | |

|
#8
Village Ln
Deer Park, TX 77536
|
1,820 sq. feet
|
2 baths 3 beds |
show details | |

|
#9
Village Ln
Deer Park, TX 77536
|
2,130 sq. feet
|
2 baths 3 beds |
show details | |

|
#10
Park Shadow Ln
Deer Park, TX 77536
|
1,815 sq. feet
|
2 baths 3 beds |
show details |
| Photo | Address | Area | Beds / Baths | Price | Details |
|---|---|---|---|---|---|

|
#11
E Princeton Ln
Deer Park, TX 77536
|
1,406 sq. feet
|
1 baths 3 beds |
show details | |

|
#12
Robinwood Dr
Deer Park, TX 77536
|
2,701 sq. feet
|
2 baths 4 beds |
show details | |

|
#13
Neches Dr
Deer Park, TX 77536
|
2,404 sq. feet
|
2 baths 4 beds |
show details | |

|
#14
Wildwood Dr
Deer Park, TX 77536
|
1,396 sq. feet
|
2 baths 3 beds |
show details | |

|
#15
Atlanta St
Deer Park, TX 77536
|
2,180 sq. feet
|
2 baths 3 beds |
show details | |

|
#16
Estate Dr
Deer Park, TX 77536
|
1,536 sq. feet
|
1 baths 3 beds |
show details | |

|
#17
Luella Ave
Deer Park, TX 77536
|
1,146 sq. feet
|
1 baths 3 beds |
show details | |

|
#18
Deer Ave
Deer Park, TX 77536
|
1,206 sq. feet
|
1 baths 3 beds |
show details | |

|
#19
E Meadow Dr
Deer Park, TX 77536
|
3,460 sq. feet
|
2 baths 4 beds |
show details | |

|
#20
Bradshire Ct
Deer Park, TX 77536
|
1,736 sq. feet
|
2 baths 3 beds |
show details |
| Photo | Address | Area | Beds / Baths | Price | Details |
|---|---|---|---|---|---|

|
#21
Kingwood Dr
Deer Park, TX 77536
|
2,413 sq. feet
|
2 baths 4 beds |
show details | |

|
#22
Independence Parkway South
Deer Park, TX 77536
|
- sq. feet
|
- baths - beds |
show details | |

|
#23
St Patrick Ln
Deer Park, TX 77536
|
- sq. feet
|
- baths - beds |
show details | |

|
#24
E X St
Deer Park, TX 77536
|
- sq. feet
|
- baths - beds |
show details | |

|
#25
N Park Way Dr
Deer Park, TX 77536
|
- sq. feet
|
- baths - beds |
show details | |

|
#26
Georgia Ave
Deer Park, TX 77536
|
- sq. feet
|
- baths - beds |
show details | |

|
#27
Temperance Ln
Deer Park, TX 77536
|
- sq. feet
|
- baths - beds |
show details | |

|
#28
Carrie Ln Apt 284
Deer Park, TX 77536
|
- sq. feet
|
- baths - beds |
show details | |

|
#29
Black Horse Rd
Baytown, TX 77523
|
3,419 sq. feet
|
3 baths 4 beds |
$589,900
|
show details |

|
#30
Stonefair Ln
Houston, TX 77075
|
2,594 sq. feet
|
3 baths 4 beds |
$305,000
|
show details |
| Photo | Address | Area | Beds / Baths | Price | Details |
|---|---|---|---|---|---|

|
#31
Creekview Dr
La Porte, TX 77571
|
2,986 sq. feet
|
2 baths 3 beds |
$199,500
|
show details |

|
#32
Pickerton Dr
Deer Park, TX 77536
|
- sq. feet
|
- baths - beds |
show details | |

|
#33
Clover St
Houston, TX 77033
|
1,584 sq. feet
|
2 baths 4 beds |
show details | |

|
#34
Mickle Creek Dr
Houston, TX 77049
|
1,986 sq. feet
|
2 baths 3 beds |
show details | |

|
#35
Burbank St
Baytown, TX 77520
|
1,248 sq. feet
|
1 baths 3 beds |
show details | |

|
#36
Casita Verde Way
Houston, TX 77049
|
1,750 sq. feet
|
2 baths 4 beds |
show details | |

|
#37
Sydnor St
Houston, TX 77020
|
1,426 sq. feet
|
2 baths 3 beds |
show details | |

|
#38
Macclesby Ln
Channelview, TX 77530
|
2,562 sq. feet
|
2 baths 4 beds |
show details | |

|
#39
Maple Way
Houston, TX 77015
|
1,672 sq. feet
|
1 baths 3 beds |
show details | |

|
#40
Kittrell St
Houston, TX 77034
|
1,380 sq. feet
|
1 baths 3 beds |
show details |
| Photo | Address | Area | Beds / Baths | Price | Details |
|---|---|---|---|---|---|

|
#41
Way St
Houston, TX 77028
|
1,248 sq. feet
|
2 baths 3 beds |
show details | |

|
#42
Wessex Dr
Houston, TX 77089
|
1,769 sq. feet
|
2 baths 3 beds |
show details | |

|
#43
N Everton St
Houston, TX 77003
|
881 sq. feet
|
1 baths 2 beds |
show details | |

|
#44
Versailles Dr
Houston, TX 77015
|
1,211 sq. feet
|
2 baths 3 beds |
show details | |

|
#45
Silver Leaf Dr
League City, TX 77573
|
1,634 sq. feet
|
2 baths 3 beds |
show details | |

|
#46
Sunset Isles Dr
Baytown, TX 77521
|
- sq. feet
|
2 baths 4 beds |
show details | |

|
#47
N Shady Ln
La Porte, TX 77571
|
1,787 sq. feet
|
2 baths 3 beds |
show details | |

|
#48
Hunters Trace Lane
Baytown, TX 77521
|
- sq. feet
|
2 baths 4 beds |
show details | |

|
#49
Lake Landing Dr
League City, TX 77573
|
7,959 sq. feet
|
5 baths 7 beds |
show details | |

|
Check over 1 million property listings on Foreclosure.com!
|
browse all offers | |||


- 17,16649.8%White alone
- 14,53942.2%Hispanic
- 1,2033.5%Two or more races
- 7422.2%Black alone
- 3130.9%Asian alone
- 850.2%American Indian alone
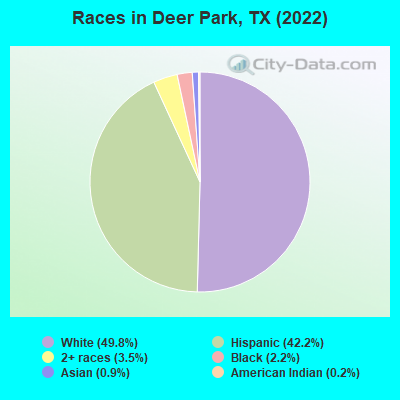
Races in Deer Park detailed stats: ancestries, foreign born residents, place of birth
According to our research of Texas and other state lists, there were 47 registered sex offenders living in Deer Park, Texas as of April 27, 2024.
The ratio of all residents to sex offenders in Deer Park is 738 to 1.
The ratio of registered sex offenders to all residents in this city is lower than the state average.
Type |
2009 |
2010 |
2011 |
2012 |
2013 |
2014 |
2015 |
2016 |
2017 |
2018 |
2019 |
2020 |
2021 |
2022 |
|---|---|---|---|---|---|---|---|---|---|---|---|---|---|---|
| Murders (per 100,000) | 0 (0.0) | 3 (9.4) | 0 (0.0) | 0 (0.0) | 0 (0.0) | 0 (0.0) | 0 (0.0) | 0 (0.0) | 0 (0.0) | 0 (0.0) | 4 (11.7) | 0 (0.0) | 0 (0.0) | 0 (0.0) |
| Rapes (per 100,000) | 11 (35.3) | 8 (25.0) | 14 (42.8) | 13 (39.2) | 12 (36.0) | 12 (35.8) | 7 (20.5) | 16 (46.8) | 12 (35.2) | 7 (20.5) | 22 (64.4) | 14 (41.6) | 23 (69.7) | 10 (30.3) |
| Robberies (per 100,000) | 8 (25.7) | 5 (15.6) | 6 (18.4) | 14 (42.2) | 10 (30.0) | 13 (38.8) | 11 (32.2) | 15 (43.9) | 3 (8.8) | 5 (14.6) | 5 (14.6) | 8 (23.8) | 5 (15.2) | 3 (9.1) |
| Assaults (per 100,000) | 60 (192.5) | 12 (37.5) | 19 (58.1) | 19 (57.2) | 19 (57.1) | 21 (62.6) | 23 (67.4) | 34 (99.5) | 23 (67.5) | 18 (52.7) | 17 (49.8) | 25 (74.3) | 24 (72.7) | 24 (72.7) |
| Burglaries (per 100,000) | 150 (481.3) | 255 (796.6) | 122 (373.3) | 117 (352.5) | 64 (192.2) | 92 (274.4) | 80 (234.4) | 48 (140.5) | 70 (205.5) | 63 (184.5) | 52 (152.2) | 63 (187.3) | 54 (163.6) | 62 (187.8) |
| Thefts (per 100,000) | 621 (1,993) | 725 (2,265) | 682 (2,087) | 720 (2,169) | 571 (1,715) | 543 (1,620) | 513 (1,503) | 509 (1,490) | 396 (1,162) | 384 (1,124) | 464 (1,358) | 467 (1,389) | 356 (1,079) | 409 (1,239) |
| Auto thefts (per 100,000) | 66 (211.8) | 35 (109.3) | 32 (97.9) | 37 (111.5) | 24 (72.1) | 49 (146.2) | 35 (102.5) | 35 (102.5) | 34 (99.8) | 45 (131.8) | 37 (108.3) | 43 (127.9) | 47 (142.4) | 41 (124.2) |
| Arson (per 100,000) | 4 (12.8) | 1 (3.1) | 0 (0.0) | 2 (6.0) | 4 (12.0) | 2 (6.0) | 3 (8.8) | 0 (0.0) | 2 (5.9) | 2 (5.9) | 1 (2.9) | 0 (0.0) | 1 (3.0) | 0 (0.0) |
| City-Data.com crime index | 204.8 | 206.0 | 168.8 | 175.8 | 137.1 | 148.5 | 124.3 | 148.2 | 113.2 | 99.8 | 162.9 | 134.2 | 140.9 | 114.1 |
The City-Data.com crime index weighs serious crimes and violent crimes more heavily. Higher means more crime, U.S. average is 246.1. It adjusts for the number of visitors and daily workers commuting into cities.
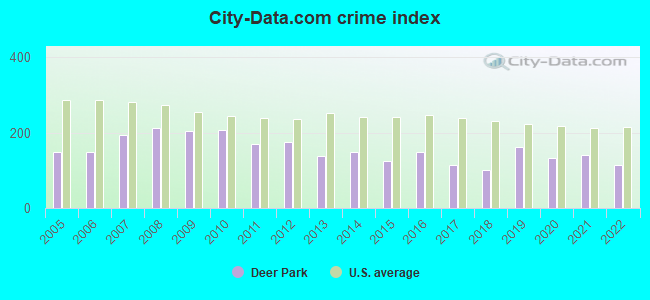
Crime rate in Deer Park detailed stats: murders, rapes, robberies, assaults, burglaries, thefts, arson
Full-time law enforcement employees in 2021, including police officers: 89 (60 officers - 46 male; 14 female).
| Officers per 1,000 residents here: | 1.82 |
| Texas average: | 2.07 |
 Recent articles from our blog. Our writers, many of them Ph.D. graduates or candidates, create easy-to-read articles on a wide variety of topics.


Latest news from Deer Park, TX collected exclusively by city-data.com from local newspapers, TV, and radio stations
Ancestries: American (9.8%), German (8.3%), English (5.9%), Irish (3.2%), African (2.3%), European (1.8%).
Current Local Time: CST time zone
Land area: 10.4 square miles.
Population density: 3,230 people per square mile (average).
3,619 residents are foreign born (9.3% Latin America).
| This city: | 10.5% |
| Texas: | 17.1% |
Median real estate property taxes paid for housing units with mortgages in 2022: $4,508 (1.7%)
Median real estate property taxes paid for housing units with no mortgage in 2022: $2,580 (1.2%)
Nearest city with pop. 50,000+: Pasadena, TX  (3.5 miles , pop. 141,674).
Nearest city with pop. 200,000+: Houston, TX (16.7 miles , pop. 1,953,631).
Nearest cities:
), ), ), Latitude: 29.69 N, Longitude: 95.12 W
Daytime population change due to commuting: +9,605 (+27.9%)
Workers who live and work in this city: 3,382 (20.9%)
Area codes: 281, 832, 713
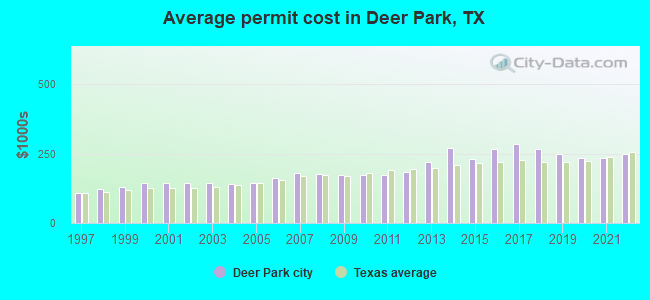
Property values in Deer Park, TX

Deer Park, Texas accommodation & food services, waste management - Economy and Business Data
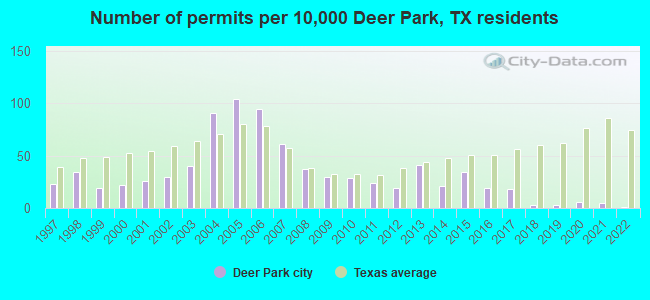
Single-family new house construction building permits:
- 2022: 2 buildings, average cost: $247,700
- 2021: 15 buildings, average cost: $234,800
- 2020: 17 buildings, average cost: $233,400
- 2019: 8 buildings, average cost: $246,800
- 2018: 8 buildings, average cost: $266,900
- 2017: 51 buildings, average cost: $283,300
- 2016: 55 buildings, average cost: $264,800
- 2015: 98 buildings, average cost: $229,000
- 2014: 59 buildings, average cost: $271,200
- 2013: 117 buildings, average cost: $220,100
- 2012: 53 buildings, average cost: $182,500
- 2011: 69 buildings, average cost: $170,900
- 2010: 84 buildings, average cost: $171,800
- 2009: 85 buildings, average cost: $170,500
- 2008: 106 buildings, average cost: $175,200
- 2007: 174 buildings, average cost: $181,100
- 2006: 269 buildings, average cost: $162,200
- 2005: 296 buildings, average cost: $143,000
- 2004: 260 buildings, average cost: $140,200
- 2003: 115 buildings, average cost: $142,700
- 2002: 85 buildings, average cost: $144,300
- 2001: 73 buildings, average cost: $143,200
- 2000: 64 buildings, average cost: $143,100
- 1999: 55 buildings, average cost: $129,800
- 1998: 97 buildings, average cost: $123,100
- 1997: 66 buildings, average cost: $109,000
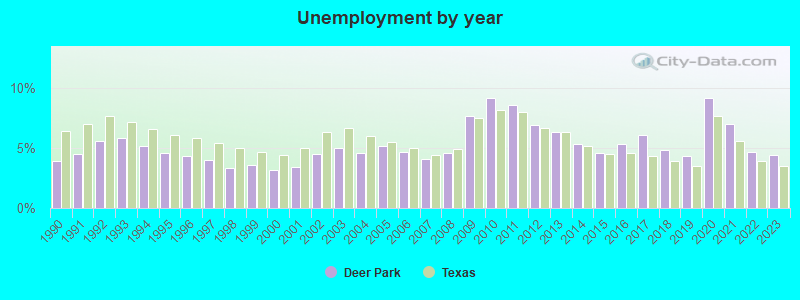
| Here: | 4.4% |
| Texas: | 3.5% |
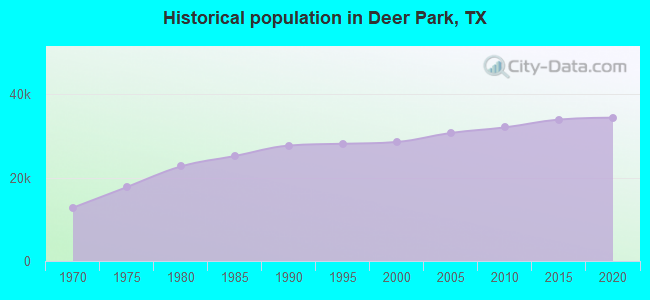
Population change in the 1990s: +789 (+2.8%).
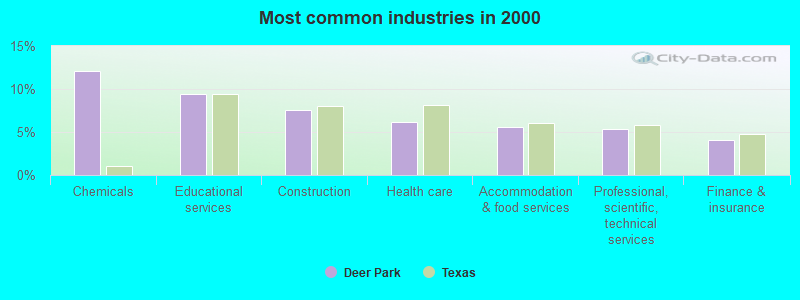
- Chemicals (12.1%)
- Educational services (9.4%)
- Construction (7.5%)
- Health care (6.1%)
- Accommodation & food services (5.5%)
- Professional, scientific, technical services (5.3%)
- Finance & insurance (4.1%)
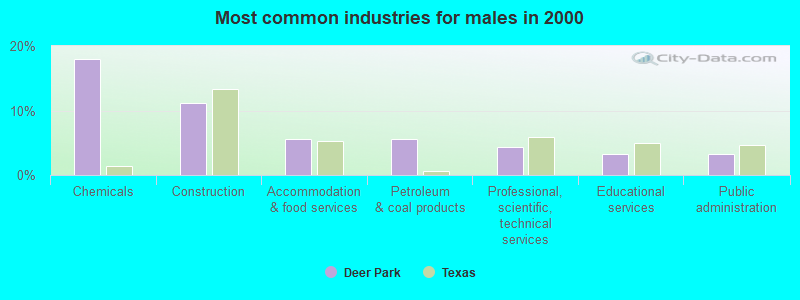
- Chemicals (17.9%)
- Construction (11.1%)
- Accommodation & food services (5.6%)
- Petroleum & coal products (5.5%)
- Professional, scientific, technical services (4.3%)
- Educational services (3.3%)
- Public administration (3.2%)
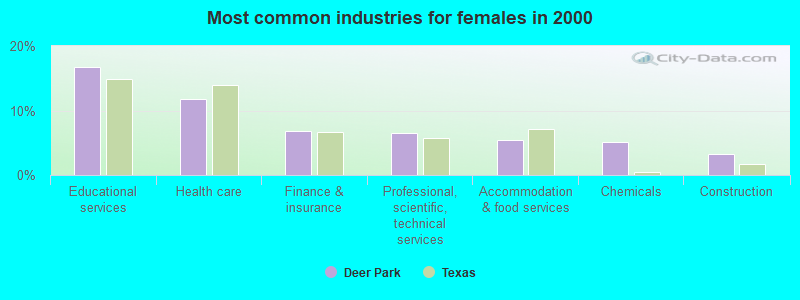
- Educational services (16.7%)
- Health care (11.8%)
- Finance & insurance (6.8%)
- Professional, scientific, technical services (6.5%)
- Accommodation & food services (5.5%)
- Chemicals (5.2%)
- Construction (3.3%)
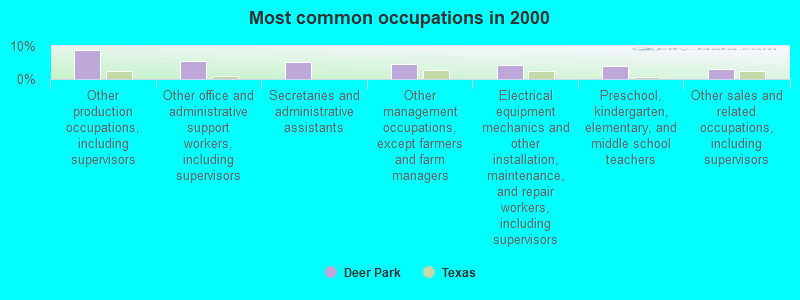
- Other production occupations, including supervisors (8.8%)
- Other office and administrative support workers, including supervisors (5.4%)
- Secretaries and administrative assistants (5.3%)
- Other management occupations, except farmers and farm managers (4.5%)
- Electrical equipment mechanics and other installation, maintenance, and repair workers, including supervisors (4.1%)
- Preschool, kindergarten, elementary, and middle school teachers (3.9%)
- Other sales and related occupations, including supervisors (3.0%)
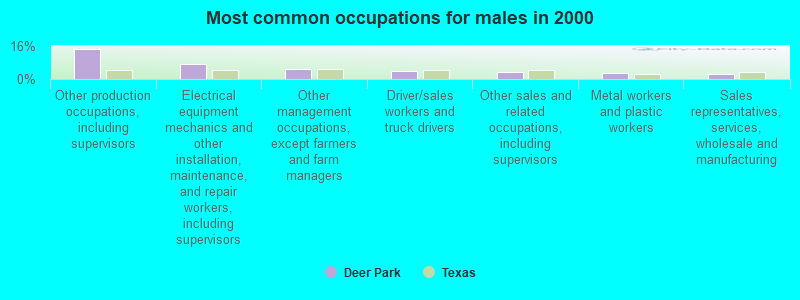
- Other production occupations, including supervisors (14.7%)
- Electrical equipment mechanics and other installation, maintenance, and repair workers, including supervisors (7.4%)
- Other management occupations, except farmers and farm managers (4.9%)
- Driver/sales workers and truck drivers (3.7%)
- Other sales and related occupations, including supervisors (3.3%)
- Metal workers and plastic workers (3.1%)
- Sales representatives, services, wholesale and manufacturing (2.7%)
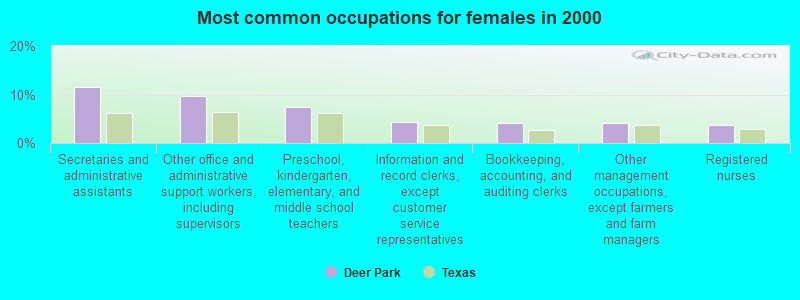
- Secretaries and administrative assistants (11.5%)
- Other office and administrative support workers, including supervisors (9.7%)
- Preschool, kindergarten, elementary, and middle school teachers (7.4%)
- Information and record clerks, except customer service representatives (4.2%)
- Bookkeeping, accounting, and auditing clerks (4.1%)
- Other management occupations, except farmers and farm managers (4.1%)
- Registered nurses (3.7%)
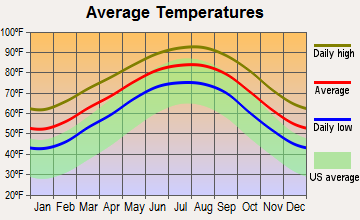
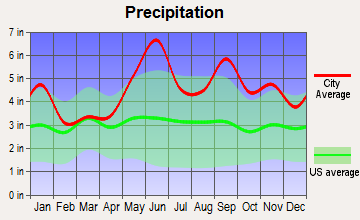
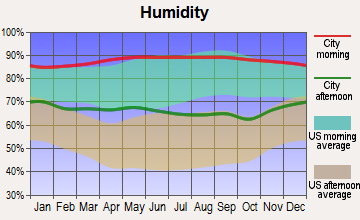
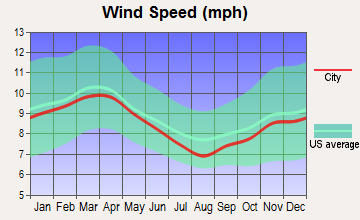
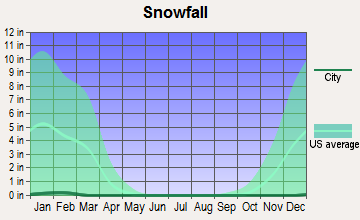
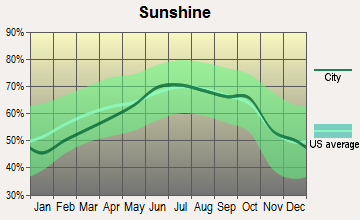
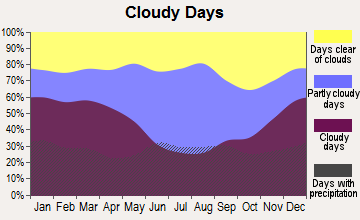
Average climate in Deer Park, Texas
Based on data reported by over 4,000 weather stations
|
|

(lower is better)
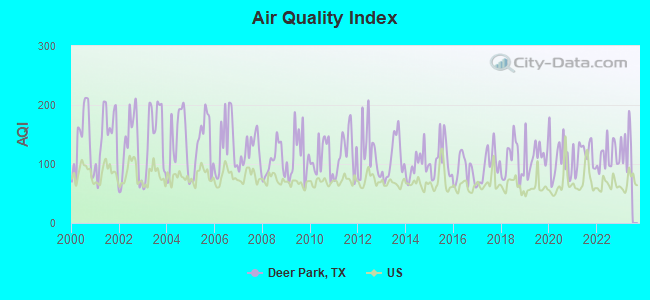
Air Quality Index (AQI) level in 2022 was 112. This is significantly worse than average.
| City: | 112 |
| U.S.: | 73 |
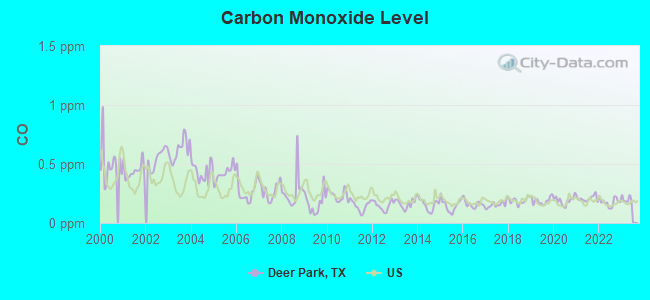
Carbon Monoxide (CO) [ppm] level in 2022 was 0.177. This is significantly better than average. Closest monitor was 1.6 miles away from the city center.
| City: | 0.177 |
| U.S.: | 0.251 |
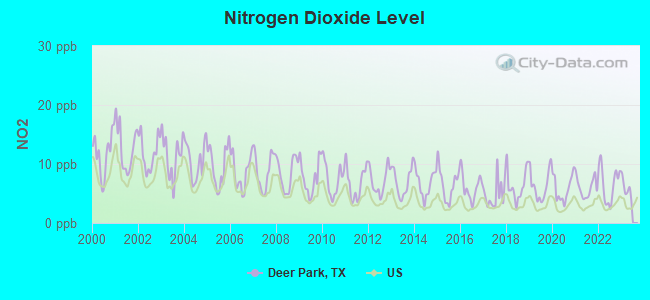
Nitrogen Dioxide (NO2) [ppb] level in 2022 was 6.61. This is worse than average. Closest monitor was 0.5 miles away from the city center.
| City: | 6.61 |
| U.S.: | 5.11 |
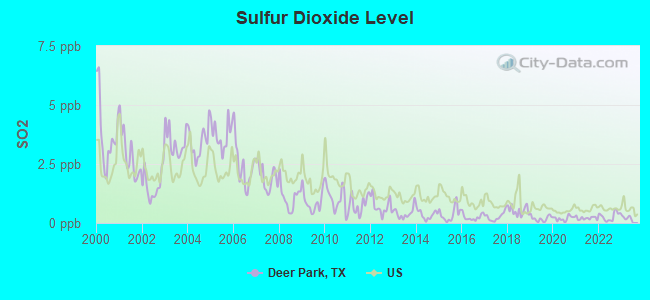
Sulfur Dioxide (SO2) [ppb] level in 2022 was 0.281. This is significantly better than average. Closest monitor was 0.5 miles away from the city center.
| City: | 0.281 |
| U.S.: | 1.515 |
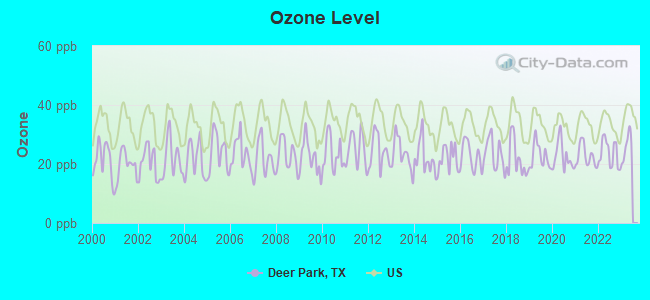
Ozone [ppb] level in 2022 was 23.7. This is significantly better than average. Closest monitor was 1.2 miles away from the city center.
| City: | 23.7 |
| U.S.: | 33.3 |
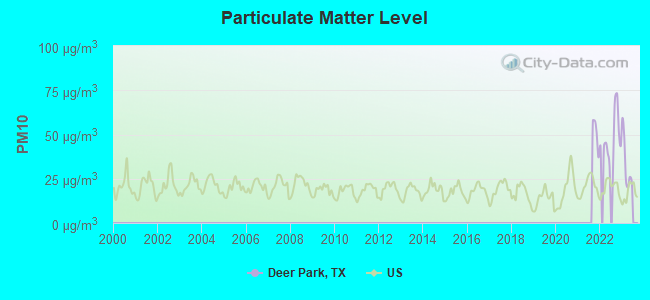
Particulate Matter (PM10) [µg/m3] level in 2022 was 48.1. This is significantly worse than average. Closest monitor was 1.6 miles away from the city center.
| City: | 48.1 |
| U.S.: | 19.2 |
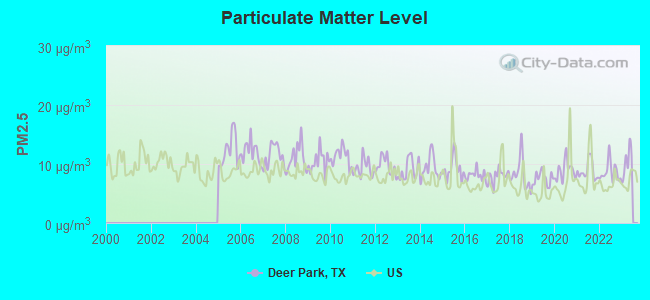
Particulate Matter (PM2.5) [µg/m3] level in 2022 was 8.68. This is about average. Closest monitor was 1.6 miles away from the city center.
| City: | 8.68 |
| U.S.: | 8.11 |
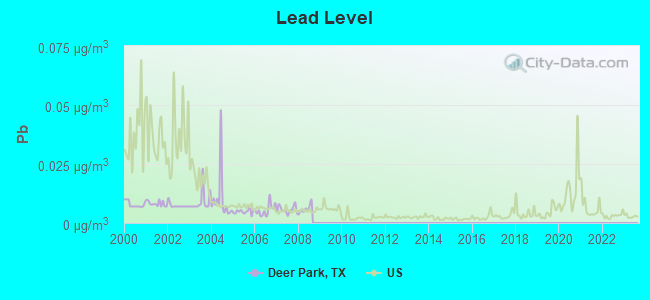
Lead (Pb) [µg/m3] level in 2008 was 0.00590. This is significantly better than average. Closest monitor was 0.5 miles away from the city center.
| City: | 0.00590 |
| U.S.: | 0.00931 |
Tornado activity:
Deer Park-area historical tornado activity is slightly above Texas state average. It is 86% greater than the overall U.S. average.
On 11/21/1992, a category F4 (max. wind speeds 207-260 mph) tornado 10.1 miles away from the Deer Park city center injured 16 people and caused between $50,000,000 and $500,000,000 in damages.
On 2/11/1950, a category F3 (max. wind speeds 158-206 mph) tornado 4.4 miles away from the city center killed one person and injured 12 people and caused between $5000 and $50,000 in damages.
Earthquake activity:
Deer Park-area historical earthquake activity is significantly above Texas state average. It is 38% smaller than the overall U.S. average.On 5/17/2012 at 08:12:00, a magnitude 4.8 (4.8 MW, Depth: 3.1 mi, Class: Light, Intensity: IV - V) earthquake occurred 160.8 miles away from the city center
On 10/20/2011 at 12:24:41, a magnitude 4.8 (4.8 MW, Depth: 3.1 mi) earthquake occurred 187.6 miles away from the city center
On 9/2/2013 at 23:51:15, a magnitude 4.3 (4.3 MW, Depth: 2.9 mi) earthquake occurred 158.8 miles away from the city center
On 9/2/2013 at 21:52:38, a magnitude 4.2 (4.2 MW, Depth: 3.0 mi) earthquake occurred 161.1 miles away from Deer Park center
On 4/9/1993 at 12:29:19, a magnitude 4.3 (4.1 MB, 4.3 LG, Depth: 3.1 mi) earthquake occurred 191.4 miles away from Deer Park center
On 1/25/2013 at 07:01:19, a magnitude 4.1 (4.1 MB, Depth: 3.1 mi) earthquake occurred 156.6 miles away from Deer Park center
Magnitude types: regional Lg-wave magnitude (LG), body-wave magnitude (MB), moment magnitude (MW)
Natural disasters:
The number of natural disasters in Harris County (32) is a lot greater than the US average (15).Major Disasters (Presidential) Declared: 22
Emergencies Declared: 6
Causes of natural disasters: Storms: 16, Floods: 15, Hurricanes: 9, Tornadoes: 7, Tropical Storms: 4, Fires: 2, Winds: 2, Other: 1 (Note: some incidents may be assigned to more than one category).
Hospitals and medical centers in Deer Park:
Heliports located in Deer Park:
See details about Heliports located in Deer Park, TXAmtrak stations near Deer Park:
- 9 miles: SOUTH HOUSTON (1546 COLLEGE) - Bus Station
- 16 miles: HOUSTON (902 WASHINGTON AVE.) . Services: ticket office, fully wheelchair accessible, enclosed waiting area, public restrooms, public payphones, vending machines, free short-term parking, free long-term parking, taxi stand, public transit connection.
Colleges/universities with over 2000 students nearest to Deer Park:
- San Jacinto Community College (about 3 miles; Pasadena, TX; Full-time enrollment: 13,517)
- University of Houston-Clear Lake (about 8 miles; Houston, TX; FT enrollment: 5,833)
- Lee College (about 9 miles; Baytown, TX; FT enrollment: 4,278)
- University of Houston (about 14 miles; Houston, TX; FT enrollment: 31,888)
- Texas Southern University (about 15 miles; Houston, TX; FT enrollment: 7,053)
- University of Houston-Downtown (about 16 miles; Houston, TX; FT enrollment: 10,122)
- Houston Community College (about 16 miles; Houston, TX; FT enrollment: 38,303)
Public high schools in Deer Park:
- DEER PARK J H (Students: 3,772, Location: 410 E NINTH, Grades: 6-9)
- DEER PARK HS (Students: 856, Location: 710 W SAN AUGUSTINE, Grades: 9-12)
- H S POINT (Location: 301 W P ST, Grades: 9-11)
Public elementary/middle schools in Deer Park:
- CARPENTER ELEMENTARY (Students: 898, Location: 5002 PASADENA BLVD, Grades: KG-5)
- JP DABBS ELEMENTARY (Students: 761, Location: 302 E LAMBUTH, Grades: KG-5)
- BONNETTE JR HIGH (Students: 745, Location: 5010 PASADENA BLVD, Grades: 6-8)
- DEER PARK ELEMENTARY (Students: 706, Location: 2920 LUELLA, Grades: KG-5)
- SAN JACINTO EL (Students: 685, Location: 1302 E THIRTEENTH ST, Grades: KG-5)
- COLLEGE PARK EL (Location: 4315 LUELLA, Grades: PK-5)
- HERITAGE EL (Location: 4301 E BLVD, Grades: PK-5)
Library in Deer Park:
Points of interest:
Notable locations in Deer Park: Deer Park Volunteer Fire Department (A), Deer Park Police Department - Investigation (B), City of Deer Park Fire Department (C), Deer Park Volunteer Fire Department / Ambulance Service Station 2 (D). Display/hide their locations on the map
Shopping Center: Parktown Shopping Center (1). Display/hide its location on the map
Churches in Deer Park include: Central Baptist Churches (A), First Baptist Church of Deer Park (B), Glenwood Baptist Church (C), Korean First Baptist Church (D), San Jacinto Church (E), Center Street Baptist Church (F), Deer Park Assembly of God Church (G), Deer Park United Methodist Church (H), Faithbridge Church (I). Display/hide their locations on the map
Cemetery: Betheny Cemetery (1). Display/hide its location on the map
Streams, rivers, and creeks: East Fork Patrick Bayou (A). Display/hide its location on the map
Parks in Deer Park include: Abshire Stadium - Deer Park High School (1), Bayou Bend Park (2). Display/hide their locations on the map
Hotel: Best Western Deer Park Inn Ste (1401 Center Street).
Court: Deer Park-City - Municipal Court (1302 Center Street).
Birthplace of: Ryan Bright - College basketball player (Sam Houston St. Bearkats).
| This city: | 2.9 people |
| Texas: | 2.8 people |
| This city: | 78.3% |
| Whole state: | 69.9% |
| This city: | 5.2% |
| Whole state: | 6.0% |
Likely homosexual households (counted as self-reported same-sex unmarried-partner households)
- Lesbian couples: 0.4% of all households
- Gay men: 0.3% of all households
People in group quarters in Deer Park in 2010:
- 87 people in nursing facilities/skilled-nursing facilities
- 18 people in group homes intended for adults
- 4 people in emergency and transitional shelters (with sleeping facilities) for people experiencing homelessness
People in group quarters in Deer Park in 2000:
- 185 people in homes or halfway houses for drug/alcohol abuse
- 89 people in nursing homes
- 27 people in crews of maritime vessels
- 2 people in religious group quarters
Banks with branches in Deer Park (2011 data):
- Iberiabank: Deer Park Branch at 1601 Center Street, branch established on 2009/10/30. Info updated 2011/06/08: Bank assets: $11,676.7 mil, Deposits: $9,387.9 mil, headquarters in Lafayette, LA, positive income, Commercial Lending Specialization, 187 total offices, Holding Company: Iberiabank Corporation
- JPMorgan Chase Bank, National Association: Deer Park Branch at 3605 Center Street, branch established on 1889/01/01. Info updated 2011/11/10: Bank assets: $1,811,678.0 mil, Deposits: $1,190,738.0 mil, headquarters in Columbus, OH, positive income, International Specialization, 5577 total offices, Holding Company: Jpmorgan Chase & Co.
- Wells Fargo Bank, National Association: Deer Park Branch at 715 Center Street, branch established on 1957/08/29. Info updated 2011/04/05: Bank assets: $1,161,490.0 mil, Deposits: $905,653.0 mil, headquarters in Sioux Falls, SD, positive income, 6395 total offices, Holding Company: Wells Fargo & Company
- Comerica Bank: Deer Park Branch at 1500 Center Street, branch established on 2001/02/05. Info updated 2011/07/29: Bank assets: $60,970.5 mil, Deposits: $48,300.9 mil, headquarters in Dallas, TX, positive income, Commercial Lending Specialization, 497 total offices, Holding Company: Comerica Incorporated
- Capital Bank: Deer Park Branch at 3500 East Boulevard, branch established on 2006/06/12. Info updated 2006/11/03: Bank assets: $264.8 mil, Deposits: $236.3 mil, headquarters in Jacinto City, TX, positive income, Commercial Lending Specialization, 6 total offices, Holding Company: Jane Austin Chapman Limited Partnership, L.P.
- Texas Coastal Bank: Deer Park Office Branch at 102 W. Pasadena Blvd., branch established on 2005/07/18. Info updated 2006/11/03: Bank assets: $29.3 mil, Deposits: $26.8 mil, headquarters in Pasadena, TX, negative income in the last year, Commercial Lending Specialization, 2 total offices
For population 15 years and over in Deer Park:
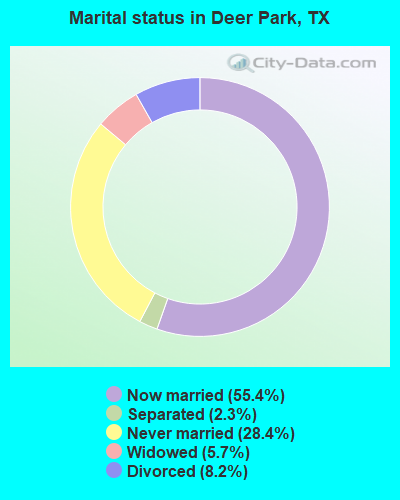
- Never married: 28.4%
- Now married: 55.4%
- Separated: 2.3%
- Widowed: 5.7%
- Divorced: 8.2%
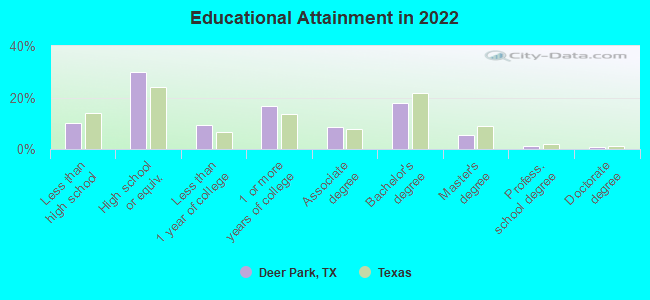
For population 25 years and over in Deer Park:
- High school or higher: 88.9%
- Bachelor's degree or higher: 24.4%
- Graduate or professional degree: 6.9%
- Unemployed: 5.6%
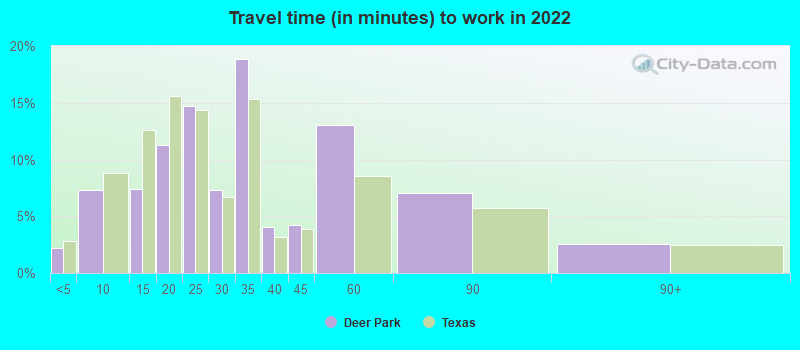
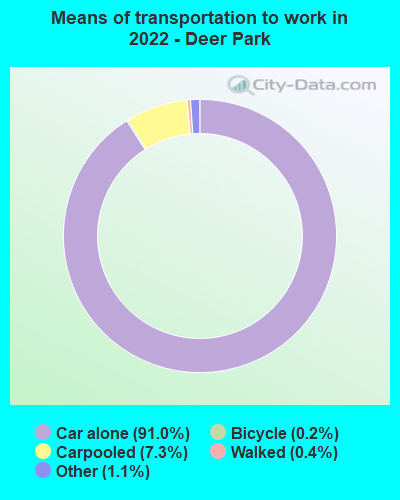
- Mean travel time to work (commute): 22.7 minutes
| Here: | 11.2 |
| Texas average: | 14.0 |
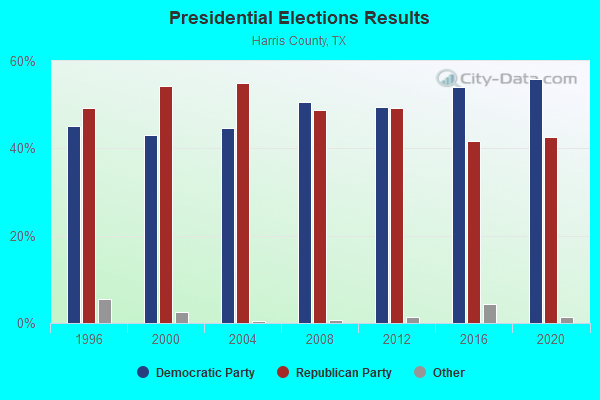
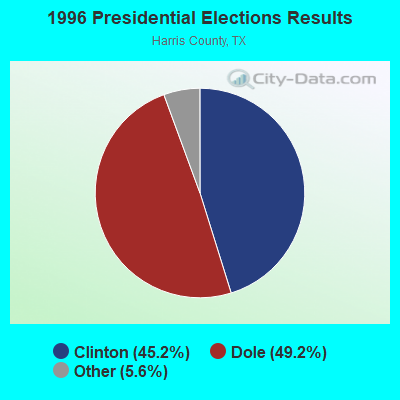
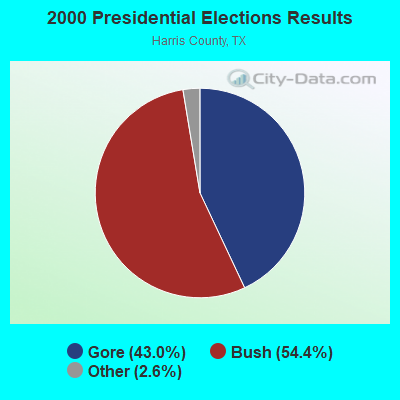
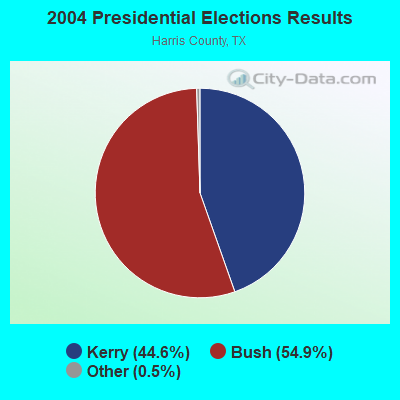
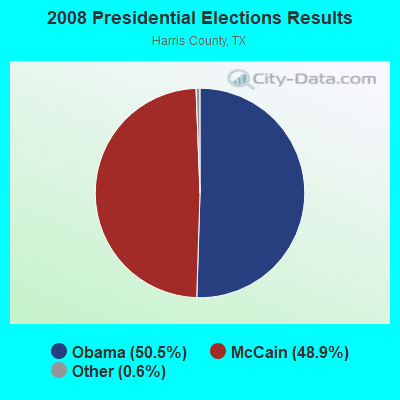
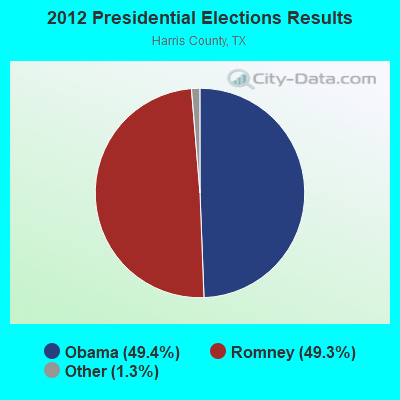
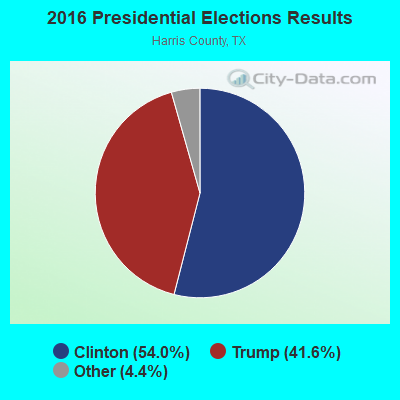
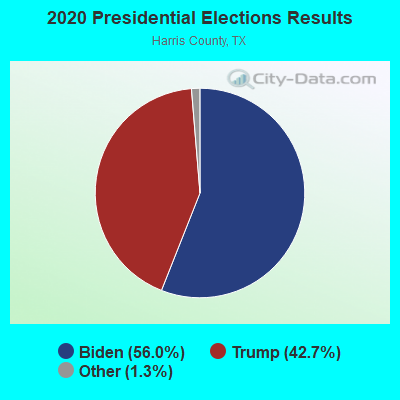
Graphs represent county-level data. Detailed 2008 Election Results
Religion statistics for Deer Park, TX (based on Harris County data)
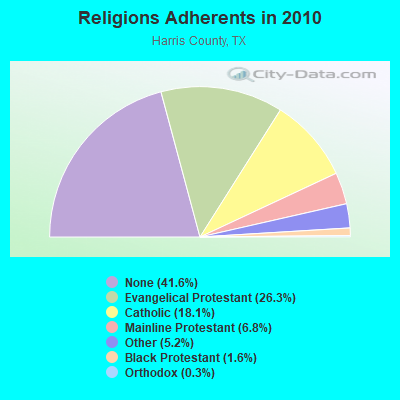
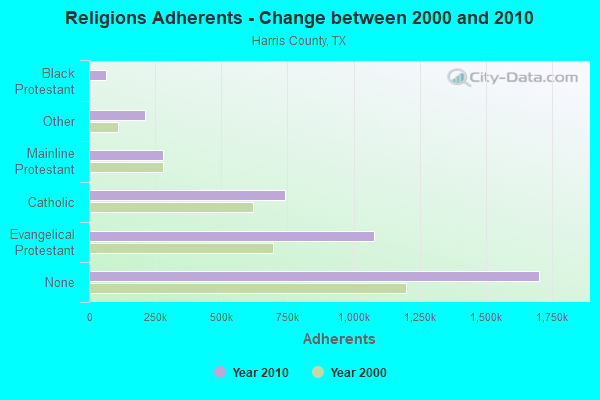
| Religion | Adherents | Congregations |
|---|---|---|
| Evangelical Protestant | 1,077,287 | 2,102 |
| Catholic | 741,896 | 109 |
| Mainline Protestant | 278,855 | 288 |
| Other | 213,212 | 296 |
| Black Protestant | 65,641 | 211 |
| Orthodox | 12,884 | 25 |
| None | 1,702,684 | - |
Food Environment Statistics:
| Harris County: | 1.88 / 10,000 pop. |
| State: | 1.47 / 10,000 pop. |
| Harris County: | 0.10 / 10,000 pop. |
| State: | 0.14 / 10,000 pop. |
| Harris County: | 1.35 / 10,000 pop. |
| Texas: | 1.11 / 10,000 pop. |
| Harris County: | 3.38 / 10,000 pop. |
| Texas: | 3.95 / 10,000 pop. |
| Harris County: | 5.88 / 10,000 pop. |
| Texas: | 6.13 / 10,000 pop. |
| This county: | 8.9% |
| Texas: | 8.9% |
| This county: | 26.0% |
| Texas: | 26.6% |
| This county: | 17.1% |
| State: | 15.7% |
Health and Nutrition:
| Deer Park: | 47.8% |
| State: | 48.6% |
| Deer Park: | 45.3% |
| State: | 47.4% |
| Deer Park: | 28.8 |
| Texas: | 28.5 |
| Deer Park: | 23.0% |
| Texas: | 20.6% |
| Deer Park: | 9.7% |
| Texas: | 10.3% |
| Here: | 6.8 |
| Texas: | 6.8 |
| Here: | 35.0% |
| Texas: | 33.1% |
| This city: | 55.4% |
| Texas: | 56.2% |
| Deer Park: | 79.2% |
| State: | 80.7% |
More about Health and Nutrition of Deer Park, TX Residents
| Local government employment and payroll (March 2022) | |||||
| Function | Full-time employees | Monthly full-time payroll | Average yearly full-time wage | Part-time employees | Monthly part-time payroll |
|---|---|---|---|---|---|
| Police Protection - Officers | 62 | $518,632 | $100,380 | 0 | $0 |
| Parks and Recreation | 45 | $216,015 | $57,604 | 66 | $67,301 |
| Police - Other | 30 | $143,136 | $57,254 | 23 | $16,678 |
| Streets and Highways | 28 | $152,179 | $65,220 | 3 | $9,287 |
| Fire - Other | 22 | $139,283 | $75,973 | 5 | $11,550 |
| Solid Waste Management | 22 | $93,711 | $51,115 | 0 | $0 |
| Financial Administration | 19 | $119,388 | $75,403 | 0 | $0 |
| Other Government Administration | 18 | $125,703 | $83,802 | 3 | $2,918 |
| Water Supply | 17 | $95,024 | $67,076 | 1 | $638 |
| Other and Unallocable | 13 | $53,725 | $49,592 | 0 | $0 |
| Sewerage | 11 | $70,800 | $77,236 | 0 | $0 |
| Local Libraries | 11 | $54,409 | $59,355 | 1 | $1,953 |
| Judicial and Legal | 5 | $24,851 | $59,642 | 0 | $0 |
| Firefighters | 2 | $14,763 | $88,578 | 0 | $0 |
| Totals for Government | 305 | $1,821,618 | $71,670 | 102 | $110,325 |
Deer Park government finances - Expenditure in 2021 (per resident):
- Construction - Toll Highways: $15,602,000 ($466.18)
- Current Operations - Police Protection: $23,101,000 ($690.24)
Central Staff Services: $9,966,000 ($297.78)
General - Other: $9,880,000 ($295.21)
Toll Highways: $2,683,000 ($80.17)
Judicial and Legal Services: $2,437,000 ($72.82)
Water Utilities: $958,000 ($28.62)
Parks and Recreation: $461,000 ($13.77)
Sewerage: $307,000 ($9.17)
- Intergovernmental to Local - Other - Local Fire Protection: $7,068,000 ($211.19)
Other - Sewerage: $6,317,000 ($188.75)
Other - Solid Waste Management: $2,457,000 ($73.41)
Other - Water Utilities: $2,186,000 ($65.32)
- Intergovernmental to State - Regular Highways: $364,000 ($10.88)
- Total Salaries and Wages: $21,549,000 ($643.87)
- Water Utilities - Interest on Debt: $3,441,000 ($102.81)
Deer Park government finances - Revenue in 2021 (per resident):
- Charges - Sewerage: $9,908,000 ($296.04)
Solid Waste Management: $2,585,000 ($77.24)
Other: $261,000 ($7.80)
- Local Intergovernmental - Transit Utilities: $5,449,000 ($162.81)
Other: $3,472,000 ($103.74)
- Miscellaneous - Fines and Forfeits: $5,385,000 ($160.90)
Interest Earnings: $895,000 ($26.74)
General Revenue - Other: $751,000 ($22.44)
- Revenue - Water Utilities: $12,317,000 ($368.02)
- Tax - Property: $42,851,000 ($1280.36)
General Sales and Gross Receipts: $11,956,000 ($357.24)
Deer Park government finances - Debt in 2021 (per resident):
- Long Term Debt - Beginning Outstanding - Unspecified Public Purpose: $106,475,000 ($3181.40)
Outstanding Unspecified Public Purpose: $100,926,000 ($3015.60)
Retired Unspecified Public Purpose: $5,549,000 ($165.80)
Deer Park government finances - Cash and Securities in 2021 (per resident):
- Bond Funds - Cash and Securities: $705,000 ($21.06)
- Other Funds - Cash and Securities: $92,607,000 ($2767.03)
5.26% of this county's 2021 resident taxpayers lived in other counties in 2020 ($67,872 average adjusted gross income)
| Here: | 5.26% |
| Texas average: | 8.12% |
0.02% of residents moved from foreign countries ($158 average AGI)
Harris County: 0.02% Texas average: 0.04%
Top counties from which taxpayers relocated into this county between 2020 and 2021:
| from Fort Bend County, TX | |
| from Montgomery County, TX | |
| from Galveston County, TX |
5.91% of this county's 2020 resident taxpayers moved to other counties in 2021 ($76,622 average adjusted gross income)
| Here: | 5.91% |
| Texas average: | 7.40% |
0.01% of residents moved to foreign countries ($155 average AGI)
Harris County: 0.01% Texas average: 0.03%
Top counties to which taxpayers relocated from this county between 2020 and 2021:
| to Fort Bend County, TX | |
| to Montgomery County, TX | |
| to Brazoria County, TX |
| Businesses in Deer Park, TX | ||||
| Name | Count | Name | Count | |
|---|---|---|---|---|
| Ace Hardware | 1 | La Quinta | 1 | |
| Advance Auto Parts | 1 | Little Caesars Pizza | 1 | |
| Best Western | 1 | MasterBrand Cabinets | 1 | |
| Blockbuster | 1 | McDonald's | 2 | |
| Burger King | 1 | Papa John's Pizza | 1 | |
| CVS | 1 | Pizza Hut | 1 | |
| Church's Chicken | 1 | Popeyes | 1 | |
| Comfort Suites | 1 | RadioShack | 1 | |
| Cricket Wireless | 1 | SONIC Drive-In | 1 | |
| Curves | 1 | Starbucks | 1 | |
| Domino's Pizza | 1 | Subway | 3 | |
| FedEx | 4 | T-Mobile | 2 | |
| Firestone Complete Auto Care | 1 | Taco Bell | 1 | |
| H&R Block | 1 | UPS | 2 | |
| Holiday Inn | 2 | Walgreens | 1 | |
Strongest AM radio stations in Deer Park:
- KXYZ (1320 AM; 5 kW; HOUSTON, TX; Owner: BLAYA INC.)
- KTRH (740 AM; 50 kW; HOUSTON, TX; Owner: AMFM TEXAS LICENSES LIMITED PARTNERSHIP)
- KLVL (1480 AM; 3 kW; PASADENA, TX; Owner: SIGA BROADCASTING CORP.)
- KWWJ (1360 AM; 5 kW; BAYTOWN, TX; Owner: SALT OF THE EARTH BROADCASTING, INC.)
- KGOL (1180 AM; 50 kW; HUMBLE, TX; Owner: ENTRAVISION HOLDINGS, LLC)
- KPRC (950 AM; 5 kW; HOUSTON, TX; Owner: CCB TEXAS LICENSES, L.P.)
- KCOH (1430 AM; 5 kW; HOUSTON, TX; Owner: KCOH, INC.)
- KLAT (1010 AM; 10 kW; HOUSTON, TX; Owner: TICHENOR LICENSE CORPORATION ("TLC"))
- KIKK (650 AM; daytime; 0 kW; PASADENA, TX; Owner: TEXAS INFINITY BROADCASTING L.P.)
- KILE (1560 AM; 50 kW; BELLAIRE, TX; Owner: THE RAFTT CORPORATION)
- KILT (610 AM; 5 kW; HOUSTON, TX; Owner: TEXAS INFINITY BROADCASTING L.P.)
- KYST (920 AM; 5 kW; TEXAS CITY, TX; Owner: HISPANIC BROADCASTING, INC.)
- KKHT (1070 AM; 10 kW; HOUSTON, TX; Owner: SOUTH TEXAS BROADCASTING, INC.)
Strongest FM radio stations in Deer Park:
- KFTG (88.1 FM; PASADENA, TX; Owner: ALELUYA CHRISTIAN BROADCASTING, INC.)
- KMJQ (102.1 FM; HOUSTON, TX; Owner: RADIO ONE LICENSES, LLC)
- KLTN (102.9 FM; HOUSTON, TX; Owner: HBC HOUSTON LICENSE CORPORATION)
- KBXX (97.9 FM; HOUSTON, TX; Owner: RADIO ONE LICENSES, LLC)
- KHJZ-FM (95.7 FM; HOUSTON, TX; Owner: TEXAS INFINITY BROADCASTING L.P.)
- KHMX (96.5 FM; HOUSTON, TX; Owner: CITICASTERS LICENSES, L.P.)
- KILT-FM (100.3 FM; HOUSTON, TX; Owner: TEXAS INFINITY BROADCASTING L.P.)
- KKBQ-FM (92.9 FM; PASADENA, TX; Owner: CXR HOLDINGS, INC.)
- KLOL (101.1 FM; HOUSTON, TX; Owner: AMFM TEXAS LICENSES LIMITED PARTNERSHIP)
- KODA (99.1 FM; HOUSTON, TX; Owner: AMFM TEXAS LICENSES LIMITED PARTNERSHIP)
- KTBZ-FM (94.5 FM; HOUSTON, TX; Owner: AMFM TEXAS LICENSES LIMITED PARTNERSHIP)
- KUHF (88.7 FM; HOUSTON, TX; Owner: UNIVERSITY OF HOUSTON SYSTEM)
- KRBE (104.1 FM; HOUSTON, TX; Owner: KRBE LICO, INC.)
- KKRW (93.7 FM; HOUSTON, TX; Owner: CAPSTAR TX LIMITED PARTNERSHIP)
- KHCB-FM (105.7 FM; HOUSTON, TX; Owner: HOUSTON CHRISTIAN BROADCASTERS, INC.)
- KLDE (107.5 FM; LAKE JACKSON, TX; Owner: CXR HOLDINGS, INC.)
- KOVE-FM (106.5 FM; GALVESTON, TX; Owner: HBC LICENSE CORPORATION)
- KPTY (104.9 FM; MISSOURI CITY, TX; Owner: TICHENOR LICENSE CORPORATION ("TLC"))
- KQBU-FM (93.3 FM; PORT ARTHUR, TX; Owner: TICHENOR LICENSE CORPORATION ("TLC"))
- KQQK (107.9 FM; BEAUMONT, TX; Owner: LIBERMAN BROADCASTING OF HOUSTON LICENSE CORP.)
TV broadcast stations around Deer Park:
- KJIB-LP (Channel 5; CLEAR LAKE CITY, TX; Owner: FAR EASTERN TELECASTERS)
- KTMD (Channel 48; GALVESTON, TX; Owner: TELEMUNDO OF TEXAS PARTNERSHIP, LP)
- KVQT-LP (Channel 24; HOUSTON, TX; Owner: C. DOWEN JOHNSON)
- KPRC-TV (Channel 2; HOUSTON, TX; Owner: POST-NEWSWEEK STATIONS, HOUSTON, LP)
- KHOU-TV (Channel 11; HOUSTON, TX; Owner: KHOU-TV, L.P.)
- KLTJ (Channel 22; GALVESTON, TX; Owner: WORD OF GOD FELLOWSHIP, INC.)
- KRIV (Channel 26; HOUSTON, TX; Owner: FOX TELEVISION STATIONS, INC.)
- KHLM-LP (Channel 43; HOUSTON, TX; Owner: U.S. INTERACTIVE, L.L.C.)
- KTRK-TV (Channel 13; HOUSTON, TX; Owner: KTRK TELEVISION, INC.)
- KHWB (Channel 39; HOUSTON, TX; Owner: KHWB, INC.)
- KNWS-TV (Channel 51; KATY, TX; Owner: JOHNSON BROADCASTING, INC.)
- KPXB (Channel 49; CONROE, TX; Owner: PAXSON HOUSTON LICENSE, INC.)
- KUHT (Channel 8; HOUSTON, TX; Owner: UNIVERSITY OF HOUSTON SYSTEM)
- KFTH (Channel 67; ALVIN, TX; Owner: TELEFUTURA HOUSTON LLC)
- KXLN-TV (Channel 45; ROSENBERG, TX; Owner: KXLN LICENSE PARTNERSHIP, L.P.)
- KTBU (Channel 55; CONROE, TX; Owner: HUMANITY INTERESTED MEDIA, INC.)
- KTXH (Channel 20; HOUSTON, TX; Owner: FOX TELEVISION STATIONS, INC.)
- KZJL (Channel 61; HOUSTON, TX; Owner: KZJL LICENSE CORP.)
- KETH (Channel 14; HOUSTON, TX; Owner: COMMUNITY EDUCATIONAL TV, INC.)
- KVVV-LP (Channel 53; HOUSTON, TX; Owner: KAZH LICENSE, LLC)
- KVDO-LP (Channel 69; CLEAR LAKE, TX; Owner: FAR EASTERN TELECASTERS)
- KBPX-LP (Channel 33; HOUSTON, TX; Owner: PAXSON COMMUNICATIONS LPTV, INC.)
- KAZH (Channel 57; BAYTOWN, TX; Owner: KAZH LICENSE, LLC)
- K30CV (Channel 30; HOUSTON, TX; Owner: BROADCASTING SYSTEMS, INC.)
- KHMV-LP (Channel 28; HOUSTON, TX; Owner: PAPPAS TELECASTING OF THE GULF COAST, A CALIFORNIA LP)
- National Bridge Inventory (NBI) Statistics
- 26Number of bridges
- 315ft / 95.6mTotal length
- $1,215,000Total costs
- 634,437Total average daily traffic
- 54,310Total average daily truck traffic
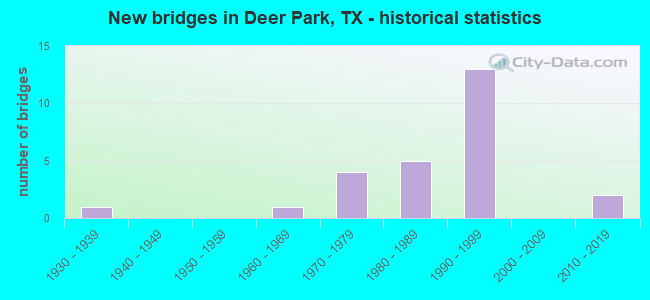
- New bridges - historical statistics
- 11930-1939
- 11960-1969
- 41970-1979
- 51980-1989
- 131990-1999
- 22010-2019
FCC Registered Private Land Mobile Towers: 6 (See the full list of FCC Registered Private Land Mobile Towers in Deer Park, TX)
FCC Registered Broadcast Land Mobile Towers: 69 (See the full list of FCC Registered Broadcast Land Mobile Towers)
FCC Registered Microwave Towers: 89 (See the full list of FCC Registered Microwave Towers in this town)
FCC Registered Paging Towers: 13 (See the full list of FCC Registered Paging Towers)
FCC Registered Maritime Coast & Aviation Ground Towers: 4 (See the full list of FCC Registered Maritime Coast & Aviation Ground Towers)
FCC Registered Amateur Radio Licenses: 131 (See the full list of FCC Registered Amateur Radio Licenses in Deer Park)
FAA Registered Aircraft: 19 (See the full list of FAA Registered Aircraft in Deer Park)
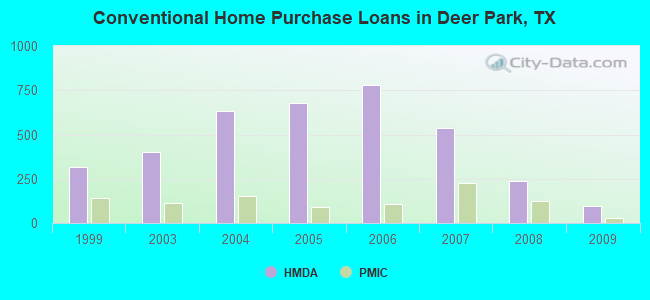
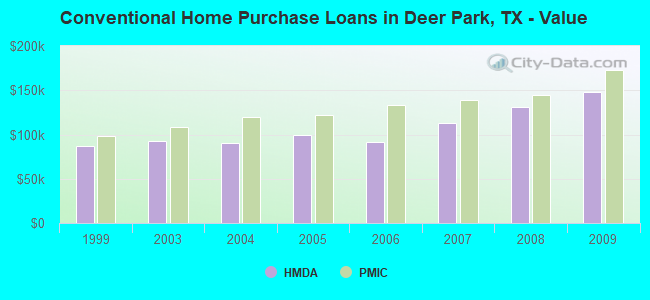
| Home Mortgage Disclosure Act Aggregated Statistics For Year 2009 (Based on 5 full and 1 partial tracts) | ||||||||||||||
| A) FHA, FSA/RHS & VA Home Purchase Loans | B) Conventional Home Purchase Loans | C) Refinancings | D) Home Improvement Loans | E) Loans on Dwellings For 5+ Families | F) Non-occupant Loans on < 5 Family Dwellings (A B C & D) | G) Loans On Manufactured Home Dwelling (A B C & D) | ||||||||
|---|---|---|---|---|---|---|---|---|---|---|---|---|---|---|
| Number | Average Value | Number | Average Value | Number | Average Value | Number | Average Value | Number | Average Value | Number | Average Value | Number | Average Value | |
| LOANS ORIGINATED | 195 | $138,013 | 98 | $148,395 | 375 | $123,640 | 46 | $44,208 | 0 | $0 | 13 | $72,672 | 0 | $0 |
| APPLICATIONS APPROVED, NOT ACCEPTED | 9 | $153,570 | 8 | $103,775 | 30 | $106,944 | 3 | $26,923 | 0 | $0 | 5 | $71,920 | 1 | $46,720 |
| APPLICATIONS DENIED | 21 | $134,266 | 23 | $66,920 | 172 | $127,604 | 27 | $31,142 | 2 | $180,500 | 9 | $60,374 | 7 | $25,609 |
| APPLICATIONS WITHDRAWN | 14 | $149,071 | 14 | $137,894 | 84 | $133,081 | 5 | $54,258 | 0 | $0 | 5 | $81,334 | 0 | $0 |
| FILES CLOSED FOR INCOMPLETENESS | 5 | $123,054 | 1 | $148,150 | 26 | $132,982 | 4 | $35,652 | 0 | $0 | 2 | $68,875 | 0 | $0 |
Detailed HMDA statistics for the following Tracts: 3423.00 , 3425.00, 3426.00, 3427.00, 3428.00, 3429.00
| Private Mortgage Insurance Companies Aggregated Statistics For Year 2009 (Based on 5 full tracts) | ||||||
| A) Conventional Home Purchase Loans | B) Refinancings | C) Non-occupant Loans on < 5 Family Dwellings (A & B) | ||||
|---|---|---|---|---|---|---|
| Number | Average Value | Number | Average Value | Number | Average Value | |
| LOANS ORIGINATED | 29 | $172,331 | 21 | $154,831 | 0 | $0 |
| APPLICATIONS APPROVED, NOT ACCEPTED | 14 | $163,971 | 5 | $187,112 | 1 | $44,970 |
| APPLICATIONS DENIED | 2 | $173,045 | 4 | $189,912 | 0 | $0 |
| APPLICATIONS WITHDRAWN | 2 | $116,480 | 2 | $175,035 | 0 | $0 |
| FILES CLOSED FOR INCOMPLETENESS | 2 | $178,365 | 0 | $0 | 0 | $0 |
Detailed PMIC statistics for the following Tracts: 3423.00 , 3425.00, 3426.00, 3427.00, 3428.00, 3429.00
2004 - 2018 National Fire Incident Reporting System (NFIRS) incidents
- Fire incident types reported to NFIRS in Deer Park, TX
- 30935.7%Outside Fires
- 24227.9%Structure Fires
- 16619.2%Mobile Property/Vehicle Fires
- 14917.2%Other
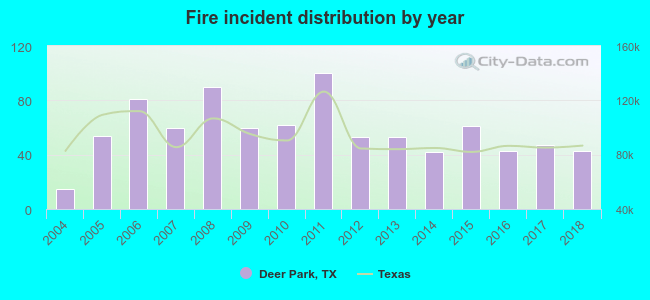 Based on the data from the years 2004 - 2018 the average number of fires per year is 58. The highest number of reported fires - 100 took place in 2011, and the least - 15 in 2004. The data has an increasing trend.
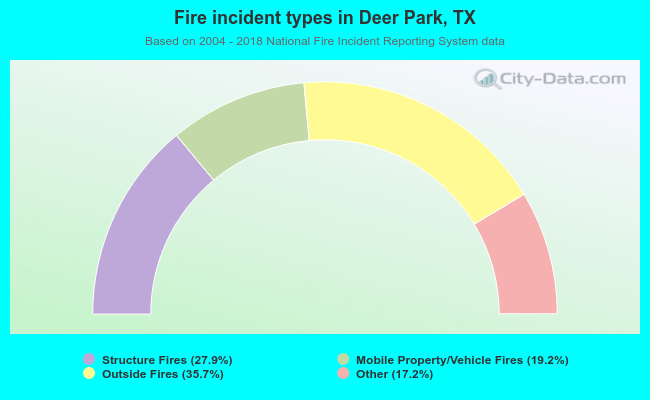 When looking into fire subcategories, the most reports belonged to: Outside Fires (35.7%), and Structure Fires (27.9%).
Fire-safe hotels and motels in Deer Park, Texas:
- Comfort Suites Deer Park, 1501 Center St, Deer Park, Texas 77536 , Phone: (281) 930-8888, Fax: (281) 930-8883
- Super 8, 846 Center St, Deer Park, Texas 77536 , Phone: (281) 930-4800, Fax: (281) 476-4242
- La Quinta Inn And Suites Deer Park, 1400 East Blvd, Deer Park, Texas 77536 , Phone: (281) 476-5300, Fax: (281) 476-9297
- Candlewood Suites Deer Park, 1300 East Blvd, Deer Park, Texas 77536 , Phone: (281) 478-0200, Fax: (281) 478-0202
- Holiday Inn Express Deer Park, 201 W X St, Deer Park, Texas 77536 , Phone: (281) 479-9888, Fax: (281) 479-5888
| Most common first names in Deer Park, TX among deceased individuals | ||
| Name | Count | Lived (average) |
|---|---|---|
| Mary | 70 | 78.7 years |
| John | 69 | 74.9 years |
| James | 66 | 73.0 years |
| William | 60 | 72.9 years |
| Robert | 55 | 68.6 years |
| Charles | 53 | 68.8 years |
| Dorothy | 34 | 74.5 years |
| George | 33 | 73.6 years |
| David | 29 | 61.4 years |
| Helen | 29 | 78.0 years |
| Most common last names in Deer Park, TX among deceased individuals | ||
| Last name | Count | Lived (average) |
|---|---|---|
| Smith | 32 | 73.1 years |
| Brown | 22 | 75.4 years |
| Williams | 20 | 76.3 years |
| Clark | 20 | 73.9 years |
| Johnson | 19 | 72.5 years |
| Moore | 19 | 76.5 years |
| Jones | 19 | 70.4 years |
| Davis | 15 | 75.4 years |
| Price | 14 | 66.7 years |
| Taylor | 14 | 74.3 years |
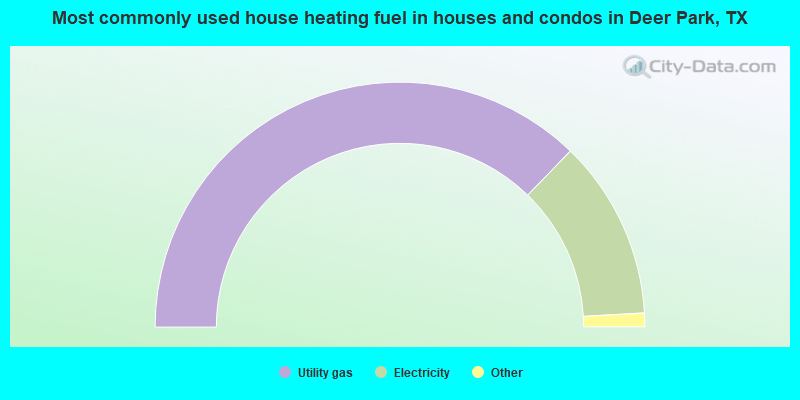
- 74.5%Utility gas
- 23.7%Electricity
- 1.0%Solar energy
- 0.6%Bottled, tank, or LP gas
- 0.1%No fuel used
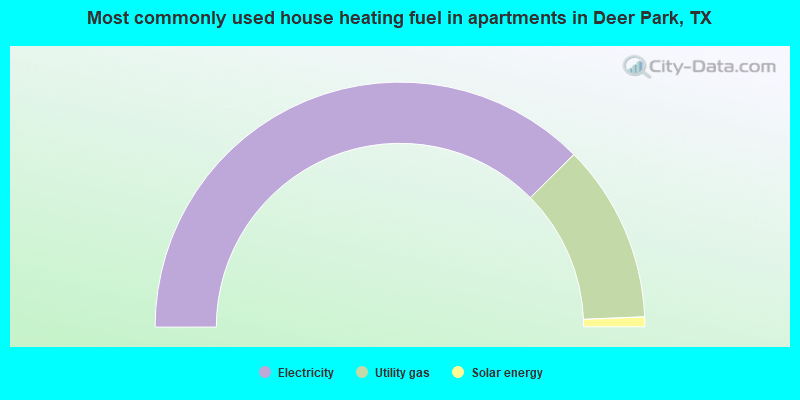
- 75.2%Electricity
- 23.6%Utility gas
- 1.3%Solar energy
Deer Park compared to Texas state average:
- Unemployed percentage below state average.
- Black race population percentage significantly below state average.
- Median age above state average.
- Renting percentage below state average.
- Length of stay since moving in significantly above state average.
Deer Park on our top lists:
- #17 on the list of "Top 101 cities with the largest percentage of people in crews of maritime vessels (population 1,000+)"
- #95 on the list of "Top 101 cities with the largest percentage of people in homes or halfway houses for drug/alcohol abuse (population 1,000+)"
- #1 on the list of "Top 101 counties with the most Mainline Protestant adherents"
- #1 on the list of "Top 101 counties with the most Evangelical Protestant adherents"
- #2 on the list of "Top 101 counties with the most Evangelical Protestant congregations"
- #3 on the list of "Top 101 counties with the highest ground withdrawal of fresh water for public supply"
- #6 on the list of "Top 101 counties with the most Mainline Protestant congregations (pop. 50,000+)"
State forum archive:
- Texas Pages: 2 3 4 5 6 7 8 9 10 11 12 13 14 15 16 17 18 19 20 21 22 23 24 25 26 27 28 29 30 31 32 33 34 35 36 37 38 39 40 41 42 43 44 45 46 47 48 49 50 51 52 53 54 55 56 57 58 59 60 61 62 63 64
- Austin Pages: 2 3 4 5 6 7 8 9 10 11 12 13 14 15 16 17 18 19 20 21 22 23 24 25 26 27 28 29 30 31 32 33 34 35 36 37 38 39 40 41 42 43 44 45 46 47 48 49 50 51 52 53 54 55 56 57 58 59 60 61 62 63 64 65 66 67 68 69 70 71 72 73 74 75 76 77 78 79 80 81 82 83 84 85 86 87 88 89 90 91 92 93 94 95 96 97 98 99 100 101 102 103 104 105 106 107 108 109 110 111 112 113 114 115 116 117 118 119 120 121 122 123 124 125 126 127 128 129
- Corpus Christi Pages: 2 3 4 5 6
- Dallas Pages: 2 3 4 5 6 7 8 9 10 11 12 13 14 15 16 17 18 19 20 21 22 23 24 25 26 27 28 29 30 31 32 33 34 35 36 37 38 39 40 41 42 43 44 45 46 47 48 49 50 51 52 53 54 55 56 57 58 59 60 61 62 63 64 65 66 67 68 69 70 71 72 73 74 75 76 77 78 79 80 81 82 83 84 85 86 87 88 89 90 91 92 93 94 95 96 97 98 99 100 101 102 103 104 105 106 107 108 109 110 111 112 113 114 115 116 117 118 119 120 121 122 123 124 125 126 127 128 129 130 131 132 133 134 135 136 137 138 139 140 141 142 143 144 145 146 147 148 149 150 151 152 153 154 155 156
- El Paso Pages: 2 3 4 5 6 7 8 9 10 11 12 13 14 15 16 17
- Fort Worth Pages: 2 3 4 5 6 7 8 9 10 11 12 13 14 15 16 17 18 19 20 21 22 23 24 25 26 27 28
- Houston Pages: 2 3 4 5 6 7 8 9 10 11 12 13 14 15 16 17 18 19 20 21 22 23 24 25 26 27 28 29 30 31 32 33 34 35 36 37 38 39 40 41 42 43 44 45 46 47 48 49 50 51 52 53 54 55 56 57 58 59 60 61 62 63 64 65 66 67 68 69 70 71 72 73 74 75 76 77 78 79 80 81 82 83 84 85 86 87 88 89 90 91 92 93 94 95 96 97 98 99 100 101 102 103 104 105 106 107 108 109 110 111 112 113 114 115 116 117 118 119 120 121 122 123 124 125 126 127 128 129 130 131 132 133 134 135 136 137 138 139 140 141 142 143 144 145 146 147 148 149 150 151 152 153 154 155 156 157 158 159 160 161 162 163 164 165 166 167 168 169 170 171 172 173 174 175 176 177
- Lubbock Pages: 2 3
- San Antonio Pages: 2 3 4 5 6 7 8 9 10 11 12 13 14 15 16 17 18 19 20 21 22 23 24 25 26 27 28 29 30 31 32 33 34 35 36 37 38 39 40 41 42 43 44 45 46 47 48 49 50 51 52 53 54 55 56 57 58 59 60 61 62 63 64 65 66 67 68 69 70 71 72 73 74 75 76 77 78 79 80 81 82 83 84 85 86 87 88 89 90 91 92 93 94 95 96 97 98 99 100 101 102 103 104 105 106 107 108 109 110 111 112 113 114
- Tyler Pages: 2 3 4

|
|
Total of 99 patent applications in 2008-2024.