South Houston, Texas Submit your own pictures of this city and show them to the world
OSM Map
General Map
Google Map
MSN Map
OSM Map
General Map
Google Map
MSN Map
OSM Map
General Map
Google Map
MSN Map
OSM Map
General Map
Google Map
MSN Map
Please wait while loading the map...
Population in 2022: 15,860 (100% urban, 0% rural). Population change since 2000: +0.2%Males: 7,644 Females: 8,216
March 2022 cost of living index in South Houston: 96.1 (near average, U.S. average is 100) Percentage of residents living in poverty in 2022: 23.0%for White Non-Hispanic residents , 10.7% for Black residents , 24.4% for Hispanic or Latino residents , 19.0% for other race residents , 21.6% for two or more races residents )
Profiles of local businesses
Business Search - 14 Million verified businesses
Data:
Median household income ($)
Median household income (% change since 2000)
Household income diversity
Ratio of average income to average house value (%)
Ratio of average income to average rent
Median household income ($) - White
Median household income ($) - Black or African American
Median household income ($) - Asian
Median household income ($) - Hispanic or Latino
Median household income ($) - American Indian and Alaska Native
Median household income ($) - Multirace
Median household income ($) - Other Race
Median household income for houses/condos with a mortgage ($)
Median household income for apartments without a mortgage ($)
Races - White alone (%)
Races - White alone (% change since 2000)
Races - Black alone (%)
Races - Black alone (% change since 2000)
Races - American Indian alone (%)
Races - American Indian alone (% change since 2000)
Races - Asian alone (%)
Races - Asian alone (% change since 2000)
Races - Hispanic (%)
Races - Hispanic (% change since 2000)
Races - Native Hawaiian and Other Pacific Islander alone (%)
Races - Native Hawaiian and Other Pacific Islander alone (% change since 2000)
Races - Two or more races (%)
Races - Two or more races (% change since 2000)
Races - Other race alone (%)
Races - Other race alone (% change since 2000)
Racial diversity
Unemployment (%)
Unemployment (% change since 2000)
Unemployment (%) - White
Unemployment (%) - Black or African American
Unemployment (%) - Asian
Unemployment (%) - Hispanic or Latino
Unemployment (%) - American Indian and Alaska Native
Unemployment (%) - Multirace
Unemployment (%) - Other Race
Population density (people per square mile)
Population - Males (%)
Population - Females (%)
Population - Males (%) - White
Population - Males (%) - Black or African American
Population - Males (%) - Asian
Population - Males (%) - Hispanic or Latino
Population - Males (%) - American Indian and Alaska Native
Population - Males (%) - Multirace
Population - Males (%) - Other Race
Population - Females (%) - White
Population - Females (%) - Black or African American
Population - Females (%) - Asian
Population - Females (%) - Hispanic or Latino
Population - Females (%) - American Indian and Alaska Native
Population - Females (%) - Multirace
Population - Females (%) - Other Race
Coronavirus confirmed cases (Apr 27, 2024)
Deaths caused by coronavirus (Apr 27, 2024)
Coronavirus confirmed cases (per 100k population) (Apr 27, 2024)
Deaths caused by coronavirus (per 100k population) (Apr 27, 2024)
Daily increase in number of cases (Apr 27, 2024)
Weekly increase in number of cases (Apr 27, 2024)
Cases doubled (in days) (Apr 27, 2024)
Hospitalized patients (Apr 18, 2022)
Negative test results (Apr 18, 2022)
Total test results (Apr 18, 2022)
COVID Vaccine doses distributed (per 100k population) (Sep 19, 2023)
COVID Vaccine doses administered (per 100k population) (Sep 19, 2023)
COVID Vaccine doses distributed (Sep 19, 2023)
COVID Vaccine doses administered (Sep 19, 2023)
Likely homosexual households (%)
Likely homosexual households (% change since 2000)
Likely homosexual households - Lesbian couples (%)
Likely homosexual households - Lesbian couples (% change since 2000)
Likely homosexual households - Gay men (%)
Likely homosexual households - Gay men (% change since 2000)
Cost of living index
Median gross rent ($)
Median contract rent ($)
Median monthly housing costs ($)
Median house or condo value ($)
Median house or condo value ($ change since 2000)
Mean house or condo value by units in structure - 1, detached ($)
Mean house or condo value by units in structure - 1, attached ($)
Mean house or condo value by units in structure - 2 ($)
Mean house or condo value by units in structure by units in structure - 3 or 4 ($)
Mean house or condo value by units in structure - 5 or more ($)
Mean house or condo value by units in structure - Boat, RV, van, etc. ($)
Mean house or condo value by units in structure - Mobile home ($)
Median house or condo value ($) - White
Median house or condo value ($) - Black or African American
Median house or condo value ($) - Asian
Median house or condo value ($) - Hispanic or Latino
Median house or condo value ($) - American Indian and Alaska Native
Median house or condo value ($) - Multirace
Median house or condo value ($) - Other Race
Median resident age
Resident age diversity
Median resident age - Males
Median resident age - Females
Median resident age - White
Median resident age - Black or African American
Median resident age - Asian
Median resident age - Hispanic or Latino
Median resident age - American Indian and Alaska Native
Median resident age - Multirace
Median resident age - Other Race
Median resident age - Males - White
Median resident age - Males - Black or African American
Median resident age - Males - Asian
Median resident age - Males - Hispanic or Latino
Median resident age - Males - American Indian and Alaska Native
Median resident age - Males - Multirace
Median resident age - Males - Other Race
Median resident age - Females - White
Median resident age - Females - Black or African American
Median resident age - Females - Asian
Median resident age - Females - Hispanic or Latino
Median resident age - Females - American Indian and Alaska Native
Median resident age - Females - Multirace
Median resident age - Females - Other Race
Commute - mean travel time to work (minutes)
Travel time to work - Less than 5 minutes (%)
Travel time to work - Less than 5 minutes (% change since 2000)
Travel time to work - 5 to 9 minutes (%)
Travel time to work - 5 to 9 minutes (% change since 2000)
Travel time to work - 10 to 19 minutes (%)
Travel time to work - 10 to 19 minutes (% change since 2000)
Travel time to work - 20 to 29 minutes (%)
Travel time to work - 20 to 29 minutes (% change since 2000)
Travel time to work - 30 to 39 minutes (%)
Travel time to work - 30 to 39 minutes (% change since 2000)
Travel time to work - 40 to 59 minutes (%)
Travel time to work - 40 to 59 minutes (% change since 2000)
Travel time to work - 60 to 89 minutes (%)
Travel time to work - 60 to 89 minutes (% change since 2000)
Travel time to work - 90 or more minutes (%)
Travel time to work - 90 or more minutes (% change since 2000)
Marital status - Never married (%)
Marital status - Now married (%)
Marital status - Separated (%)
Marital status - Widowed (%)
Marital status - Divorced (%)
Median family income ($)
Median family income (% change since 2000)
Median non-family income ($)
Median non-family income (% change since 2000)
Median per capita income ($)
Median per capita income (% change since 2000)
Median family income ($) - White
Median family income ($) - Black or African American
Median family income ($) - Asian
Median family income ($) - Hispanic or Latino
Median family income ($) - American Indian and Alaska Native
Median family income ($) - Multirace
Median family income ($) - Other Race
Median year house/condo built
Median year apartment built
Year house built - Built 2005 or later (%)
Year house built - Built 2000 to 2004 (%)
Year house built - Built 1990 to 1999 (%)
Year house built - Built 1980 to 1989 (%)
Year house built - Built 1970 to 1979 (%)
Year house built - Built 1960 to 1969 (%)
Year house built - Built 1950 to 1959 (%)
Year house built - Built 1940 to 1949 (%)
Year house built - Built 1939 or earlier (%)
Average household size
Household density (households per square mile)
Average household size - White
Average household size - Black or African American
Average household size - Asian
Average household size - Hispanic or Latino
Average household size - American Indian and Alaska Native
Average household size - Multirace
Average household size - Other Race
Occupied housing units (%)
Vacant housing units (%)
Owner occupied housing units (%)
Renter occupied housing units (%)
Vacancy status - For rent (%)
Vacancy status - For sale only (%)
Vacancy status - Rented or sold, not occupied (%)
Vacancy status - For seasonal, recreational, or occasional use (%)
Vacancy status - For migrant workers (%)
Vacancy status - Other vacant (%)
Residents with income below the poverty level (%)
Residents with income below 50% of the poverty level (%)
Children below poverty level (%)
Poor families by family type - Married-couple family (%)
Poor families by family type - Male, no wife present (%)
Poor families by family type - Female, no husband present (%)
Poverty status for native-born residents (%)
Poverty status for foreign-born residents (%)
Poverty among high school graduates not in families (%)
Poverty among people who did not graduate high school not in families (%)
Residents with income below the poverty level (%) - White
Residents with income below the poverty level (%) - Black or African American
Residents with income below the poverty level (%) - Asian
Residents with income below the poverty level (%) - Hispanic or Latino
Residents with income below the poverty level (%) - American Indian and Alaska Native
Residents with income below the poverty level (%) - Multirace
Residents with income below the poverty level (%) - Other Race
Air pollution - Air Quality Index (AQI)
Air pollution - CO
Air pollution - NO2
Air pollution - SO2
Air pollution - Ozone
Air pollution - PM10
Air pollution - PM25
Air pollution - Pb
Crime - Murders per 100,000 population
Crime - Rapes per 100,000 population
Crime - Robberies per 100,000 population
Crime - Assaults per 100,000 population
Crime - Burglaries per 100,000 population
Crime - Thefts per 100,000 population
Crime - Auto thefts per 100,000 population
Crime - Arson per 100,000 population
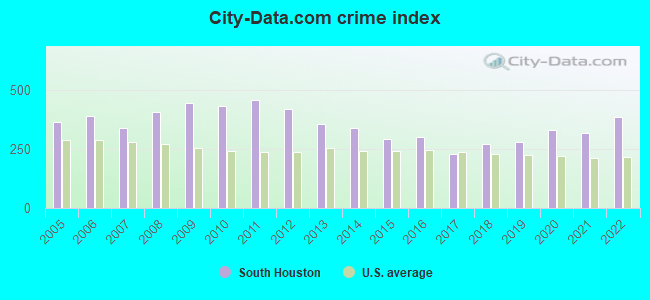
Crime - City-data.com crime index
Crime - Violent crime index
Crime - Property crime index
Crime - Murders per 100,000 population (5 year average)
Crime - Rapes per 100,000 population (5 year average)
Crime - Robberies per 100,000 population (5 year average)
Crime - Assaults per 100,000 population (5 year average)
Crime - Burglaries per 100,000 population (5 year average)
Crime - Thefts per 100,000 population (5 year average)
Crime - Auto thefts per 100,000 population (5 year average)
Crime - Arson per 100,000 population (5 year average)
Crime - City-data.com crime index (5 year average)
Crime - Violent crime index (5 year average)
Crime - Property crime index (5 year average)
1996 Presidential Elections Results (%) - Democratic Party (Clinton)
1996 Presidential Elections Results (%) - Republican Party (Dole)
1996 Presidential Elections Results (%) - Other
2000 Presidential Elections Results (%) - Democratic Party (Gore)
2000 Presidential Elections Results (%) - Republican Party (Bush)
2000 Presidential Elections Results (%) - Other
2004 Presidential Elections Results (%) - Democratic Party (Kerry)
2004 Presidential Elections Results (%) - Republican Party (Bush)
2004 Presidential Elections Results (%) - Other
2008 Presidential Elections Results (%) - Democratic Party (Obama)
2008 Presidential Elections Results (%) - Republican Party (McCain)
2008 Presidential Elections Results (%) - Other
2012 Presidential Elections Results (%) - Democratic Party (Obama)
2012 Presidential Elections Results (%) - Republican Party (Romney)
2012 Presidential Elections Results (%) - Other
2016 Presidential Elections Results (%) - Democratic Party (Clinton)
2016 Presidential Elections Results (%) - Republican Party (Trump)
2016 Presidential Elections Results (%) - Other
2020 Presidential Elections Results (%) - Democratic Party (Biden)
2020 Presidential Elections Results (%) - Republican Party (Trump)
2020 Presidential Elections Results (%) - Other
Ancestries Reported - Arab (%)
Ancestries Reported - Czech (%)
Ancestries Reported - Danish (%)
Ancestries Reported - Dutch (%)
Ancestries Reported - English (%)
Ancestries Reported - French (%)
Ancestries Reported - French Canadian (%)
Ancestries Reported - German (%)
Ancestries Reported - Greek (%)
Ancestries Reported - Hungarian (%)
Ancestries Reported - Irish (%)
Ancestries Reported - Italian (%)
Ancestries Reported - Lithuanian (%)
Ancestries Reported - Norwegian (%)
Ancestries Reported - Polish (%)
Ancestries Reported - Portuguese (%)
Ancestries Reported - Russian (%)
Ancestries Reported - Scotch-Irish (%)
Ancestries Reported - Scottish (%)
Ancestries Reported - Slovak (%)
Ancestries Reported - Subsaharan African (%)
Ancestries Reported - Swedish (%)
Ancestries Reported - Swiss (%)
Ancestries Reported - Ukrainian (%)
Ancestries Reported - United States (%)
Ancestries Reported - Welsh (%)
Ancestries Reported - West Indian (%)
Ancestries Reported - Other (%)
Educational Attainment - No schooling completed (%)
Educational Attainment - Less than high school (%)
Educational Attainment - High school or equivalent (%)
Educational Attainment - Less than 1 year of college (%)
Educational Attainment - 1 or more years of college (%)
Educational Attainment - Associate degree (%)
Educational Attainment - Bachelor's degree (%)
Educational Attainment - Master's degree (%)
Educational Attainment - Professional school degree (%)
Educational Attainment - Doctorate degree (%)
School Enrollment - Nursery, preschool (%)
School Enrollment - Kindergarten (%)
School Enrollment - Grade 1 to 4 (%)
School Enrollment - Grade 5 to 8 (%)
School Enrollment - Grade 9 to 12 (%)
School Enrollment - College undergrad (%)
School Enrollment - Graduate or professional (%)
School Enrollment - Not enrolled in school (%)
School enrollment - Public schools (%)
School enrollment - Private schools (%)
School enrollment - Not enrolled (%)
Median number of rooms in houses and condos
Median number of rooms in apartments
Housing units lacking complete plumbing facilities (%)
Housing units lacking complete kitchen facilities (%)
Density of houses
Urban houses (%)
Rural houses (%)
Households with people 60 years and over (%)
Households with people 65 years and over (%)
Households with people 75 years and over (%)
Households with one or more nonrelatives (%)
Households with no nonrelatives (%)
Population in households (%)
Family households (%)
Nonfamily households (%)
Population in families (%)
Family households with own children (%)
Median number of bedrooms in owner occupied houses
Mean number of bedrooms in owner occupied houses
Median number of bedrooms in renter occupied houses
Mean number of bedrooms in renter occupied houses
Median number of vehichles in owner occupied houses
Mean number of vehichles in owner occupied houses
Median number of vehichles in renter occupied houses
Mean number of vehichles in renter occupied houses
Mortgage status - with mortgage (%)
Mortgage status - with second mortgage (%)
Mortgage status - with home equity loan (%)
Mortgage status - with both second mortgage and home equity loan (%)
Mortgage status - without a mortgage (%)
Average family size
Average family size - White
Average family size - Black or African American
Average family size - Asian
Average family size - Hispanic or Latino
Average family size - American Indian and Alaska Native
Average family size - Multirace
Average family size - Other Race
Geographical mobility - Same house 1 year ago (%)
Geographical mobility - Moved within same county (%)
Geographical mobility - Moved from different county within same state (%)
Geographical mobility - Moved from different state (%)
Geographical mobility - Moved from abroad (%)
Place of birth - Born in state of residence (%)
Place of birth - Born in other state (%)
Place of birth - Native, outside of US (%)
Place of birth - Foreign born (%)
Housing units in structures - 1, detached (%)
Housing units in structures - 1, attached (%)
Housing units in structures - 2 (%)
Housing units in structures - 3 or 4 (%)
Housing units in structures - 5 to 9 (%)
Housing units in structures - 10 to 19 (%)
Housing units in structures - 20 to 49 (%)
Housing units in structures - 50 or more (%)
Housing units in structures - Mobile home (%)
Housing units in structures - Boat, RV, van, etc. (%)
House/condo owner moved in on average (years ago)
Renter moved in on average (years ago)
Year householder moved into unit - Moved in 1999 to March 2000 (%)
Year householder moved into unit - Moved in 1995 to 1998 (%)
Year householder moved into unit - Moved in 1990 to 1994 (%)
Year householder moved into unit - Moved in 1980 to 1989 (%)
Year householder moved into unit - Moved in 1970 to 1979 (%)
Year householder moved into unit - Moved in 1969 or earlier (%)
Means of transportation to work - Drove car alone (%)
Means of transportation to work - Carpooled (%)
Means of transportation to work - Public transportation (%)
Means of transportation to work - Bus or trolley bus (%)
Means of transportation to work - Streetcar or trolley car (%)
Means of transportation to work - Subway or elevated (%)
Means of transportation to work - Railroad (%)
Means of transportation to work - Ferryboat (%)
Means of transportation to work - Taxicab (%)
Means of transportation to work - Motorcycle (%)
Means of transportation to work - Bicycle (%)
Means of transportation to work - Walked (%)
Means of transportation to work - Other means (%)
Working at home (%)
Industry diversity
Most Common Industries - Agriculture, forestry, fishing and hunting, and mining (%)
Most Common Industries - Agriculture, forestry, fishing and hunting (%)
Most Common Industries - Mining, quarrying, and oil and gas extraction (%)
Most Common Industries - Construction (%)
Most Common Industries - Manufacturing (%)
Most Common Industries - Wholesale trade (%)
Most Common Industries - Retail trade (%)
Most Common Industries - Transportation and warehousing, and utilities (%)
Most Common Industries - Transportation and warehousing (%)
Most Common Industries - Utilities (%)
Most Common Industries - Information (%)
Most Common Industries - Finance and insurance, and real estate and rental and leasing (%)
Most Common Industries - Finance and insurance (%)
Most Common Industries - Real estate and rental and leasing (%)
Most Common Industries - Professional, scientific, and management, and administrative and waste management services (%)
Most Common Industries - Professional, scientific, and technical services (%)
Most Common Industries - Management of companies and enterprises (%)
Most Common Industries - Administrative and support and waste management services (%)
Most Common Industries - Educational services, and health care and social assistance (%)
Most Common Industries - Educational services (%)
Most Common Industries - Health care and social assistance (%)
Most Common Industries - Arts, entertainment, and recreation, and accommodation and food services (%)
Most Common Industries - Arts, entertainment, and recreation (%)
Most Common Industries - Accommodation and food services (%)
Most Common Industries - Other services, except public administration (%)
Most Common Industries - Public administration (%)
Occupation diversity
Most Common Occupations - Management, business, science, and arts occupations (%)
Most Common Occupations - Management, business, and financial occupations (%)
Most Common Occupations - Management occupations (%)
Most Common Occupations - Business and financial operations occupations (%)
Most Common Occupations - Computer, engineering, and science occupations (%)
Most Common Occupations - Computer and mathematical occupations (%)
Most Common Occupations - Architecture and engineering occupations (%)
Most Common Occupations - Life, physical, and social science occupations (%)
Most Common Occupations - Education, legal, community service, arts, and media occupations (%)
Most Common Occupations - Community and social service occupations (%)
Most Common Occupations - Legal occupations (%)
Most Common Occupations - Education, training, and library occupations (%)
Most Common Occupations - Arts, design, entertainment, sports, and media occupations (%)
Most Common Occupations - Healthcare practitioners and technical occupations (%)
Most Common Occupations - Health diagnosing and treating practitioners and other technical occupations (%)
Most Common Occupations - Health technologists and technicians (%)
Most Common Occupations - Service occupations (%)
Most Common Occupations - Healthcare support occupations (%)
Most Common Occupations - Protective service occupations (%)
Most Common Occupations - Fire fighting and prevention, and other protective service workers including supervisors (%)
Most Common Occupations - Law enforcement workers including supervisors (%)
Most Common Occupations - Food preparation and serving related occupations (%)
Most Common Occupations - Building and grounds cleaning and maintenance occupations (%)
Most Common Occupations - Personal care and service occupations (%)
Most Common Occupations - Sales and office occupations (%)
Most Common Occupations - Sales and related occupations (%)
Most Common Occupations - Office and administrative support occupations (%)
Most Common Occupations - Natural resources, construction, and maintenance occupations (%)
Most Common Occupations - Farming, fishing, and forestry occupations (%)
Most Common Occupations - Construction and extraction occupations (%)
Most Common Occupations - Installation, maintenance, and repair occupations (%)
Most Common Occupations - Production, transportation, and material moving occupations (%)
Most Common Occupations - Production occupations (%)
Most Common Occupations - Transportation occupations (%)
Most Common Occupations - Material moving occupations (%)
People in Group quarters - Institutionalized population (%)
People in Group quarters - Correctional institutions (%)
People in Group quarters - Federal prisons and detention centers (%)
People in Group quarters - Halfway houses (%)
People in Group quarters - Local jails and other confinement facilities (including police lockups) (%)
People in Group quarters - Military disciplinary barracks (%)
People in Group quarters - State prisons (%)
People in Group quarters - Other types of correctional institutions (%)
People in Group quarters - Nursing homes (%)
People in Group quarters - Hospitals/wards, hospices, and schools for the handicapped (%)
People in Group quarters - Hospitals/wards and hospices for chronically ill (%)
People in Group quarters - Hospices or homes for chronically ill (%)
People in Group quarters - Military hospitals or wards for chronically ill (%)
People in Group quarters - Other hospitals or wards for chronically ill (%)
People in Group quarters - Hospitals or wards for drug/alcohol abuse (%)
People in Group quarters - Mental (Psychiatric) hospitals or wards (%)
People in Group quarters - Schools, hospitals, or wards for the mentally retarded (%)
People in Group quarters - Schools, hospitals, or wards for the physically handicapped (%)
People in Group quarters - Institutions for the deaf (%)
People in Group quarters - Institutions for the blind (%)
People in Group quarters - Orthopedic wards and institutions for the physically handicapped (%)
People in Group quarters - Wards in general hospitals for patients who have no usual home elsewhere (%)
People in Group quarters - Wards in military hospitals for patients who have no usual home elsewhere (%)
People in Group quarters - Juvenile institutions (%)
People in Group quarters - Long-term care (%)
People in Group quarters - Homes for abused, dependent, and neglected children (%)
People in Group quarters - Residential treatment centers for emotionally disturbed children (%)
People in Group quarters - Training schools for juvenile delinquents (%)
People in Group quarters - Short-term care, detention or diagnostic centers for delinquent children (%)
People in Group quarters - Type of juvenile institution unknown (%)
People in Group quarters - Noninstitutionalized population (%)
People in Group quarters - College dormitories (includes college quarters off campus) (%)
People in Group quarters - Military quarters (%)
People in Group quarters - On base (%)
People in Group quarters - Barracks, unaccompanied personnel housing (UPH), (Enlisted/Officer), ;and similar group living quarters for military personnel (%)
People in Group quarters - Transient quarters for temporary residents (%)
People in Group quarters - Military ships (%)
People in Group quarters - Group homes (%)
People in Group quarters - Homes or halfway houses for drug/alcohol abuse (%)
People in Group quarters - Homes for the mentally ill (%)
People in Group quarters - Homes for the mentally retarded (%)
People in Group quarters - Homes for the physically handicapped (%)
People in Group quarters - Other group homes (%)
People in Group quarters - Religious group quarters (%)
People in Group quarters - Dormitories (%)
People in Group quarters - Agriculture workers' dormitories on farms (%)
People in Group quarters - Job Corps and vocational training facilities (%)
People in Group quarters - Other workers' dormitories (%)
People in Group quarters - Crews of maritime vessels (%)
People in Group quarters - Other nonhousehold living situations (%)
People in Group quarters - Other noninstitutional group quarters (%)
Residents speaking English at home (%)
Residents speaking English at home - Born in the United States (%)
Residents speaking English at home - Native, born elsewhere (%)
Residents speaking English at home - Foreign born (%)
Residents speaking Spanish at home (%)
Residents speaking Spanish at home - Born in the United States (%)
Residents speaking Spanish at home - Native, born elsewhere (%)
Residents speaking Spanish at home - Foreign born (%)
Residents speaking other language at home (%)
Residents speaking other language at home - Born in the United States (%)
Residents speaking other language at home - Native, born elsewhere (%)
Residents speaking other language at home - Foreign born (%)
Class of Workers - Employee of private company (%)
Class of Workers - Self-employed in own incorporated business (%)
Class of Workers - Private not-for-profit wage and salary workers (%)
Class of Workers - Local government workers (%)
Class of Workers - State government workers (%)
Class of Workers - Federal government workers (%)
Class of Workers - Self-employed workers in own not incorporated business and Unpaid family workers (%)
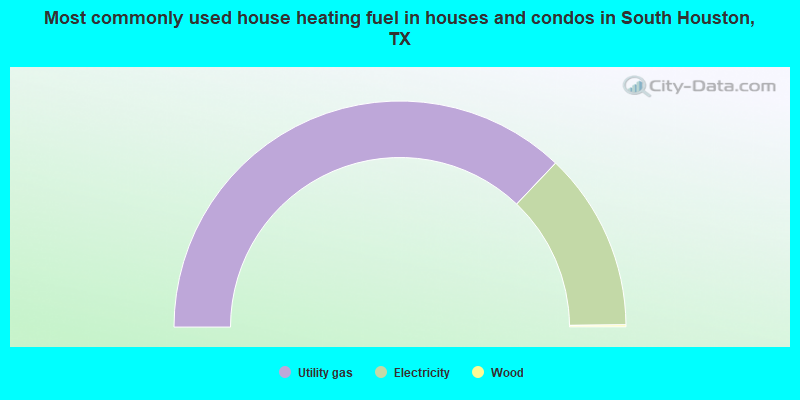
House heating fuel used in houses and condos - Utility gas (%)
House heating fuel used in houses and condos - Bottled, tank, or LP gas (%)
House heating fuel used in houses and condos - Electricity (%)
House heating fuel used in houses and condos - Fuel oil, kerosene, etc. (%)
House heating fuel used in houses and condos - Coal or coke (%)
House heating fuel used in houses and condos - Wood (%)
House heating fuel used in houses and condos - Solar energy (%)
House heating fuel used in houses and condos - Other fuel (%)
House heating fuel used in houses and condos - No fuel used (%)
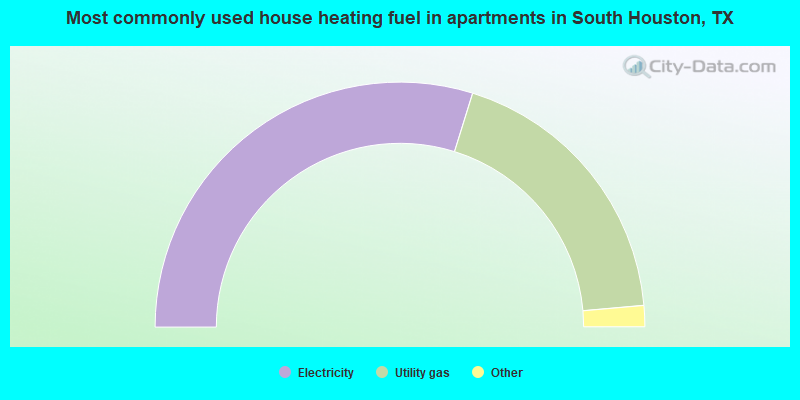
House heating fuel used in apartments - Utility gas (%)
House heating fuel used in apartments - Bottled, tank, or LP gas (%)
House heating fuel used in apartments - Electricity (%)
House heating fuel used in apartments - Fuel oil, kerosene, etc. (%)
House heating fuel used in apartments - Coal or coke (%)
House heating fuel used in apartments - Wood (%)
House heating fuel used in apartments - Solar energy (%)
House heating fuel used in apartments - Other fuel (%)
House heating fuel used in apartments - No fuel used (%)
Armed forces status - In Armed Forces (%)
Armed forces status - Civilian (%)
Armed forces status - Civilian - Veteran (%)
Armed forces status - Civilian - Nonveteran (%)
Fatal accidents locations in years 2005-2021
Fatal accidents locations in 2005
Fatal accidents locations in 2006
Fatal accidents locations in 2007
Fatal accidents locations in 2008
Fatal accidents locations in 2009
Fatal accidents locations in 2010
Fatal accidents locations in 2011
Fatal accidents locations in 2012
Fatal accidents locations in 2013
Fatal accidents locations in 2014
Fatal accidents locations in 2015
Fatal accidents locations in 2016
Fatal accidents locations in 2017
Fatal accidents locations in 2018
Fatal accidents locations in 2019
Fatal accidents locations in 2020
Fatal accidents locations in 2021
Alcohol use - People drinking some alcohol every month (%)
Alcohol use - People not drinking at all (%)
Alcohol use - Average days/month drinking alcohol
Alcohol use - Average drinks/week
Alcohol use - Average days/year people drink much
Audiometry - Average condition of hearing (%)
Audiometry - People that can hear a whisper from across a quiet room (%)
Audiometry - People that can hear normal voice from across a quiet room (%)
Audiometry - Ears ringing, roaring, buzzing (%)
Audiometry - Had a job exposure to loud noise (%)
Audiometry - Had off-work exposure to loud noise (%)
Blood Pressure & Cholesterol - Has high blood pressure (%)
Blood Pressure & Cholesterol - Checking blood pressure at home (%)
Blood Pressure & Cholesterol - Frequently checking blood cholesterol (%)
Blood Pressure & Cholesterol - Has high cholesterol level (%)
Consumer Behavior - Money monthly spent on food at supermarket/grocery store
Consumer Behavior - Money monthly spent on food at other stores
Consumer Behavior - Money monthly spent on eating out
Consumer Behavior - Money monthly spent on carryout/delivered foods
Consumer Behavior - Income spent on food at supermarket/grocery store (%)
Consumer Behavior - Income spent on food at other stores (%)
Consumer Behavior - Income spent on eating out (%)
Consumer Behavior - Income spent on carryout/delivered foods (%)
Current Health Status - General health condition (%)
Current Health Status - Blood donors (%)
Current Health Status - Has blood ever tested for HIV virus (%)
Current Health Status - Left-handed people (%)
Dermatology - People using sunscreen (%)
Diabetes - Diabetics (%)
Diabetes - Had a blood test for high blood sugar (%)
Diabetes - People taking insulin (%)
Diet Behavior & Nutrition - Diet health (%)
Diet Behavior & Nutrition - Milk product consumption (# of products/month)
Diet Behavior & Nutrition - Meals not home prepared (#/week)
Diet Behavior & Nutrition - Meals from fast food or pizza place (#/week)
Diet Behavior & Nutrition - Ready-to-eat foods (#/month)
Diet Behavior & Nutrition - Frozen meals/pizza (#/month)
Drug Use - People that ever used marijuana or hashish (%)
Drug Use - Ever used hard drugs (%)
Drug Use - Ever used any form of cocaine (%)
Drug Use - Ever used heroin (%)
Drug Use - Ever used methamphetamine (%)
Health Insurance - People covered by health insurance (%)
Kidney Conditions-Urology - Avg. # of times urinating at night
Medical Conditions - People with asthma (%)
Medical Conditions - People with anemia (%)
Medical Conditions - People with psoriasis (%)
Medical Conditions - People with overweight (%)
Medical Conditions - Elderly people having difficulties in thinking or remembering (%)
Medical Conditions - People who ever received blood transfusion (%)
Medical Conditions - People having trouble seeing even with glass/contacts (%)
Medical Conditions - People with arthritis (%)
Medical Conditions - People with gout (%)
Medical Conditions - People with congestive heart failure (%)
Medical Conditions - People with coronary heart disease (%)
Medical Conditions - People with angina pectoris (%)
Medical Conditions - People who ever had heart attack (%)
Medical Conditions - People who ever had stroke (%)
Medical Conditions - People with emphysema (%)
Medical Conditions - People with thyroid problem (%)
Medical Conditions - People with chronic bronchitis (%)
Medical Conditions - People with any liver condition (%)
Medical Conditions - People who ever had cancer or malignancy (%)
Mental Health - People who have little interest in doing things (%)
Mental Health - People feeling down, depressed, or hopeless (%)
Mental Health - People who have trouble sleeping or sleeping too much (%)
Mental Health - People feeling tired or having little energy (%)
Mental Health - People with poor appetite or overeating (%)
Mental Health - People feeling bad about themself (%)
Mental Health - People who have trouble concentrating on things (%)
Mental Health - People moving or speaking slowly or too fast (%)
Mental Health - People having thoughts they would be better off dead (%)
Oral Health - Average years since last visit a dentist
Oral Health - People embarrassed because of mouth (%)
Oral Health - People with gum disease (%)
Oral Health - General health of teeth and gums (%)
Oral Health - Average days a week using dental floss/device
Oral Health - Average days a week using mouthwash for dental problem
Oral Health - Average number of teeth
Pesticide Use - Households using pesticides to control insects (%)
Pesticide Use - Households using pesticides to kill weeds (%)
Physical Activity - People doing vigorous-intensity work activities (%)
Physical Activity - People doing moderate-intensity work activities (%)
Physical Activity - People walking or bicycling (%)
Physical Activity - People doing vigorous-intensity recreational activities (%)
Physical Activity - People doing moderate-intensity recreational activities (%)
Physical Activity - Average hours a day doing sedentary activities
Physical Activity - Average hours a day watching TV or videos
Physical Activity - Average hours a day using computer
Physical Functioning - People having limitations keeping them from working (%)
Physical Functioning - People limited in amount of work they can do (%)
Physical Functioning - People that need special equipment to walk (%)
Physical Functioning - People experiencing confusion/memory problems (%)
Physical Functioning - People requiring special healthcare equipment (%)
Prescription Medications - Average number of prescription medicines taking
Preventive Aspirin Use - Adults 40+ taking low-dose aspirin (%)
Reproductive Health - Vaginal deliveries (%)
Reproductive Health - Cesarean deliveries (%)
Reproductive Health - Deliveries resulted in a live birth (%)
Reproductive Health - Pregnancies resulted in a delivery (%)
Reproductive Health - Women breastfeeding newborns (%)
Reproductive Health - Women that had a hysterectomy (%)
Reproductive Health - Women that had both ovaries removed (%)
Reproductive Health - Women that have ever taken birth control pills (%)
Reproductive Health - Women taking birth control pills (%)
Reproductive Health - Women that have ever used Depo-Provera or injectables (%)
Reproductive Health - Women that have ever used female hormones (%)
Sexual Behavior - People 18+ that ever had sex (vaginal, anal, or oral) (%)
Sexual Behavior - Males 18+ that ever had vaginal sex with a woman (%)
Sexual Behavior - Males 18+ that ever performed oral sex on a woman (%)
Sexual Behavior - Males 18+ that ever had anal sex with a woman (%)
Sexual Behavior - Males 18+ that ever had any sex with a man (%)
Sexual Behavior - Females 18+ that ever had vaginal sex with a man (%)
Sexual Behavior - Females 18+ that ever performed oral sex on a man (%)
Sexual Behavior - Females 18+ that ever had anal sex with a man (%)
Sexual Behavior - Females 18+ that ever had any kind of sex with a woman (%)
Sexual Behavior - Average age people first had sex
Sexual Behavior - Average number of female sex partners in lifetime (males 18+)
Sexual Behavior - Average number of female vaginal sex partners in lifetime (males 18+)
Sexual Behavior - Average age people first performed oral sex on a woman (18+)
Sexual Behavior - Average number of woman performed oral sex on in lifetime (18+)
Sexual Behavior - Average number of male sex partners in lifetime (males 18+)
Sexual Behavior - Average number of male anal sex partners in lifetime (males 18+)
Sexual Behavior - Average age people first performed oral sex on a man (18+)
Sexual Behavior - Average number of male oral sex partners in lifetime (18+)
Sexual Behavior - People using protection when performing oral sex (%)
Sexual Behavior - Average number of times people have vaginal or anal sex a year
Sexual Behavior - People having sex without condom (%)
Sexual Behavior - Average number of male sex partners in lifetime (females 18+)
Sexual Behavior - Average number of male vaginal sex partners in lifetime (females 18+)
Sexual Behavior - Average number of female sex partners in lifetime (females 18+)
Sexual Behavior - Circumcised males 18+ (%)
Sleep Disorders - Average hours sleeping at night
Sleep Disorders - People that has trouble sleeping (%)
Smoking-Cigarette Use - People smoking cigarettes (%)
Taste & Smell - People 40+ having problems with smell (%)
Taste & Smell - People 40+ having problems with taste (%)
Taste & Smell - People 40+ that ever had wisdom teeth removed (%)
Taste & Smell - People 40+ that ever had tonsils teeth removed (%)
Taste & Smell - People 40+ that ever had a loss of consciousness because of a head injury (%)
Taste & Smell - People 40+ that ever had a broken nose or other serious injury to face or skull (%)
Taste & Smell - People 40+ that ever had two or more sinus infections (%)
Weight - Average height (inches)
Weight - Average weight (pounds)
Weight - Average BMI
Weight - People that are obese (%)
Weight - People that ever were obese (%)
Weight - People trying to lose weight (%)
According to our research of Texas and other state lists, there were 19 registered sex offenders living in South Houston, Texas as of April 27, 2024 . The ratio of all residents to sex offenders in South Houston is 952 to 1.The ratio of registered sex offenders to all residents in this city is lower than the state average.
Officers per 1,000 residents here:
1.37Texas average:
2.07
Latest news from South Houston, TX collected exclusively by city-data.com from local newspapers, TV, and radio stations
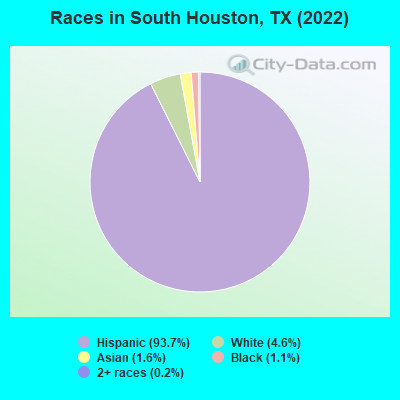
Ancestries: African (1.1%).
Current Local Time:
Land area: 3.03 square miles.
Population density: 5,240 people per square mile (average).
4,652 residents are foreign born (27.1% Latin America ).
This city:
28.4%Texas:
17.1%
Median real estate property taxes paid for housing units with mortgages in 2022: $4,308 (2.2%)Median real estate property taxes paid for housing units with no mortgage in 2022: $2,191 (1.6%)
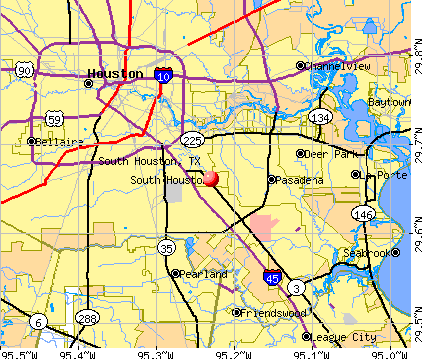
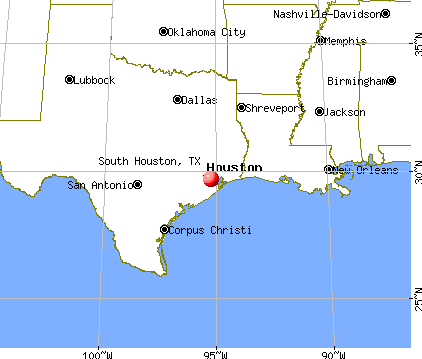
Nearest city with pop. 50,000+: Pasadena, TX
Nearest city with pop. 200,000+: Houston, TX
Nearest cities:
Latitude: 29.66 N, Longitude: 95.23 W
Daytime population change due to commuting: -759 (-4.6%)Workers who live and work in this city: 1,012 (14.4%)
Property values in South Houston, TX
Single-family new house construction building permits:
2022: 26 buildings , average cost: $167,8002021: 30 buildings , average cost: $146,6002020: 17 buildings , average cost: $116,4002019: 12 buildings , average cost: $121,3002018: 21 buildings , average cost: $133,6002017: 10 buildings , average cost: $112,5002016: 12 buildings , average cost: $109,3002015: 12 buildings , average cost: $93,5002014: 9 buildings , average cost: $86,3002013: 6 buildings , average cost: $85,7002012: 13 buildings , average cost: $96,2002011: 16 buildings , average cost: $86,1002010: 9 buildings , average cost: $72,8002009: 7 buildings , average cost: $78,6002008: 15 buildings , average cost: $83,2002007: 19 buildings , average cost: $86,9002006: 19 buildings , average cost: $74,1002005: 21 buildings , average cost: $68,1002004: 29 buildings , average cost: $59,5002003: 27 buildings , average cost: $61,7002002: 40 buildings , average cost: $66,0002001: 30 buildings , average cost: $54,6002000: 18 buildings , average cost: $42,5001999: 20 buildings , average cost: $43,4001998: 10 buildings , average cost: $37,9001997: 14 buildings , average cost: $49,400Unemployment in December 2023:
Population change in the 1990s: +1,382 (+9.6%).
Most common occupations in South Houston, TX (%)
Both Males Females
Building and grounds cleaning and maintenance occupations (4.8%)
Construction laborers (4.8%)
Metal workers and plastic workers (4.5%)
Retail sales workers, except cashiers (4.2%)
Construction traders workers except carpenters, electricians, painters, plumbers, and construction laborers (4.1%)
Material recording, scheduling, dispatching, and distributing workers (4.1%)
Carpenters (3.8%)
Construction laborers (7.3%)
Metal workers and plastic workers (7.2%)
Construction traders workers except carpenters, electricians, painters, plumbers, and construction laborers (6.6%)
Carpenters (5.8%)
Electrical equipment mechanics and other installation, maintenance, and repair workers, including supervisors (5.5%)
Driver/sales workers and truck drivers (5.4%)
Vehicle and mobile equipment mechanics, installers, and repairers (5.1%)
Building and grounds cleaning and maintenance occupations (7.2%)
Other office and administrative support workers, including supervisors (6.9%)
Secretaries and administrative assistants (6.6%)
Cashiers (6.6%)
Material recording, scheduling, dispatching, and distributing workers (6.6%)
Cooks and food preparation workers (6.1%)
Information and record clerks, except customer service representatives (4.8%)
Tornado activity:
South Houston-area historical tornado activity is slightly above Texas state average. It is 85% greater than the overall U.S. average.
On 11/21/1992, a category F4 (max. wind speeds 207-260 mph) tornado 5.6 miles away from the South Houston city center injured 16 people and caused between $50,000,000 and $500,000,000 in damages.
On 9/8/1969, a category F3 (max. wind speeds 158-206 mph) tornado 2.8 miles away from the city center caused between $5000 and $50,000 in damages.
Earthquake activity:
South Houston-area historical earthquake activity is significantly above Texas state average. It is 38% smaller than the overall U.S. average. On 5/17/2012 at 08:12:00, a magnitude 4.8 (4.8 MW, Depth: 3.1 mi, Class: Light, Intensity: IV - V) earthquake occurred 164.8 miles away from the city center On 10/20/2011 at 12:24:41, a magnitude 4.8 (4.8 MW, Depth: 3.1 mi) earthquake occurred 180.5 miles away from the city center On 9/2/2013 at 23:51:15, a magnitude 4.3 (4.3 MW, Depth: 2.9 mi) earthquake occurred 162.7 miles away from the city center On 9/2/2013 at 21:52:38, a magnitude 4.2 (4.2 MW, Depth: 3.0 mi) earthquake occurred 164.8 miles away from the city center On 4/9/1993 at 12:29:19, a magnitude 4.3 (4.1 MB, 4.3 LG, Depth: 3.1 mi) earthquake occurred 184.3 miles away from the city center On 1/25/2013 at 07:01:19, a magnitude 4.1 (4.1 MB, Depth: 3.1 mi) earthquake occurred 160.8 miles away from the city center Magnitude types: regional Lg-wave magnitude (LG), body-wave magnitude (MB), moment magnitude (MW) Natural disasters: The number of natural disasters in Harris County (32) is a lot greater than the US average (15).Major Disasters (Presidential) Declared: 22Emergencies Declared: 6Storms: 16, Floods: 15, Hurricanes: 9, Tornadoes: 7, Tropical Storms: 4, Fires: 2, Winds: 2, Other: 1 (Note: some incidents may be assigned to more than one category). Hospitals and medical centers near South Houston: SAN JACINTO LIVING CENTER (Hospital, about 2 miles away; PASADENA, TX)
RAVENHEAD LIVING CENTER (Hospital, about 2 miles away; HOUSTON, TX)
GULF COAST NURSING SERVICES INC (Home Health Center, about 2 miles away; HOUSTON, TX)
HOMECARE HORIZONS INC (Home Health Center, about 2 miles away; HOUSTON, TX)
UNITY HOMECARE (Home Health Center, about 2 miles away; HOUSTON, TX)
ST. JOHN'S SPECIALTY CARE, LLC (Home Health Center, about 2 miles away; HOUSTON, TX)
SOUTHFIELD HEALTHCARE CENTER (Nursing Home, about 2 miles away; PASADENA, TX)
Amtrak station: SOUTH HOUSTON (1546 COLLEGE) - Bus Station
College/University in South Houston: American National College Full-time enrollment: 65; Location: 1611 Spencer Hwy Suite E; Private, for-profit; Website: WWW.AMNC.EDU)
Colleges/universities with over 2000 students nearest to South Houston:
San Jacinto Community College (about 7 miles; Pasadena, TX ; Full-time enrollment: 13,517)
University of Houston (about 9 miles; Houston, TX ; FT enrollment: 31,888)
Texas Southern University (about 10 miles; Houston, TX ; FT enrollment: 7,053)
University of Houston-Clear Lake (about 10 miles; Houston, TX ; FT enrollment: 5,833)
Houston Community College (about 11 miles; Houston, TX ; FT enrollment: 38,303)
University of Houston-Downtown (about 11 miles; Houston, TX ; FT enrollment: 10,122)
The University of Texas Health Science Center at Houston (about 11 miles; Houston, TX ; FT enrollment: 3,023)
Public elementary/middle school in South Houston: MATTHYS EL Location: 1500 MAIN ST, Grades: PK-4)
Notable locations in South Houston: (A) , South Houston Police Department (B) , South Houston Fire Station (C) , South Houston Police Station (D) , South Houston Public Library (E) , South Houston Volunteer Fire Department Station 2 (F) . Display/hide their locations on the map
Shopping Center: (1) . Display/hide its location on the map
Churches in South Houston include: (A) , Saint Crispin Charismatic Episcopal Church (B) , Templo Bautista (C) , Templo Jerusalem Asamblea de Dios (D) , Vietnamese Buddhist Pagoda Phat-Quang (E) , South Houston Church of Christ (F) , The Indian Pentecostal Church (G) , South Houston Bible Chapel Church (H) , Apostolic Assembly of Love Church (I) . Display/hide their locations on the map
Parks in South Houston include: (1) , Cristy Park (2) , City Park (3) . Display/hide their locations on the map
Harris County has a predicted average indoor radon screening level less than 2 pCi/L (pico curies per liter) - Low Potential Average household size: This city:
3.5 peopleTexas:
2.8 people
Percentage of family households: This city:
80.9%Whole state:
69.9%
Percentage of households with unmarried partners: This city:
7.5%Whole state:
6.0%
Likely homosexual households (counted as self-reported same-sex unmarried-partner households)
Lesbian couples: 0.4% of all households Gay men: 0.2% of all households
4 people in local jails and other municipal confinement facilities in 2010people in other noninstitutional group quarters in 2000
Banks with branches in South Houston (2011 data):
First National Bank Texas: Telephone Road Banking Center - Rc 8 at 6322 Telephone Road, branch established on 2003/08/13; Pasadena Banking Center Rc-647 at 1603 Spencer Highway, branch established on 2011/08/31. Info updated 2006/11/03: Bank assets: $944.3 mil, Deposits: $815.9 mil, headquarters in Killeen, TX, positive income , Mortgage Lending Specialization, 250 total offices , Holding Company: First Community Bancshares, Inc.
JPMorgan Chase Bank, National Association: Spencer Highway Banking Center Branc at 1618 Spencer Highway, Suite A, branch established on 2003/12/02. Info updated 2011/11/10: Bank assets: $1,811,678.0 mil, Deposits: $1,190,738.0 mil, headquarters in Columbus, OH, positive income , International Specialization, 5577 total offices , Holding Company: Jpmorgan Chase & Co.
Bank of America, National Association: Spencer And Shaver Branch at 1627 Spencer Highway, branch established on 2008/12/29. Info updated 2009/11/18: Bank assets: $1,451,969.3 mil, Deposits: $1,077,176.8 mil, headquarters in Charlotte, NC, positive income , 5782 total offices , Holding Company: Bank Of America Corporation
International Bank of Commerce: Heb Instore Spencer Hwy Branch at 1630 Spencer Hwy, branch established on 2007/04/25. Info updated 2007/03/28: Bank assets: $9,621.9 mil, Deposits: $6,548.8 mil, headquarters in Laredo, TX, positive income , Commercial Lending Specialization, 197 total offices , Holding Company: International Bancshares Corporation
Compass Bank: South Houston Branch at 1218 Spencer Highway, branch established on 1999/02/12. Info updated 2011/02/24: Bank assets: $63,107.0 mil, Deposits: $46,232.4 mil, headquarters in Birmingham, AL, negative income in the last year , Commercial Lending Specialization, 720 total offices , Holding Company: Banco Bilbao Vizcaya Argentaria, S.A.
Regions Bank: Houston Pasadena at 1111 Spencer Highway, branch established on 1956/08/03. Info updated 2011/02/24: Bank assets: $123,368.2 mil, Deposits: $98,301.3 mil, headquarters in Birmingham, AL, positive income , Commercial Lending Specialization, 1778 total offices , Holding Company: Regions Financial Corporation
Prosperity Bank: Pasadena at 3100 South Shaver, branch established on 1999/04/19. Info updated 2012/01/05: Bank assets: $9,816.2 mil, Deposits: $8,064.8 mil, headquarters in El Campo, TX, positive income , Mortgage Lending Specialization, 187 total offices , Holding Company: Prosperity Bancshares, Inc.
For population 15 years and over in South Houston:
Never married: 39.7%Now married: 42.7%Separated: 5.0%Widowed: 4.4%Divorced: 8.1% For population 25 years and over in South Houston:
High school or higher: 60.1%Bachelor's degree or higher: 8.8%Graduate or professional degree: 1.5%Unemployed: 8.4%Mean travel time to work (commute): 28.7 minutes
Education Gini index (Inequality in education) Here:
19.0Texas average:
14.0
Religion statistics for South Houston, TX (based on Harris County data)
Religion Adherents Congregations Evangelical Protestant 1,077,287 2,102 Catholic 741,896 109 Mainline Protestant 278,855 288 Other 213,212 296 Black Protestant 65,641 211 Orthodox 12,884 25 None 1,702,684 -
Source: Clifford Grammich, Kirk Hadaway, Richard Houseal, Dale E.Jones, Alexei Krindatch, Richie Stanley and Richard H.Taylor. 2012. 2010 U.S.Religion Census: Religious Congregations & Membership Study. Association of Statisticians of American Religious Bodies. Jones, Dale E., et al. 2002. Congregations and Membership in the United States 2000. Nashville, TN: Glenmary Research Center. Graphs represent county-level data
Food Environment Statistics: Number of grocery stores : 737This county :
1.88 / 10,000 pop.Texas :
1.47 / 10,000 pop.
Number of supercenters and club stores : 41This county :
0.10 / 10,000 pop.Texas :
0.14 / 10,000 pop.
Number of convenience stores (no gas) : 530Harris County :
1.35 / 10,000 pop.Texas :
1.11 / 10,000 pop.
Number of convenience stores (with gas) : 1,321This county :
3.38 / 10,000 pop.Texas :
3.95 / 10,000 pop.
Number of full-service restaurants : 2,302Harris County :
5.88 / 10,000 pop.Texas :
6.13 / 10,000 pop.
Adult diabetes rate : This county :
8.9%Texas :
8.9%
Adult obesity rate : Harris County :
26.0%State :
26.6%
Low-income preschool obesity rate : This county :
17.1%State :
15.7%
Health and Nutrition: Healthy diet rate : This city:
45.4%Texas:
48.6%
Average overall health of teeth and gums : Average BMI : South Houston:
28.5State:
28.5
People feeling badly about themselves : South Houston:
23.5%Texas:
20.6%
People not drinking alcohol at all : South Houston:
10.6%State:
10.3%
Average hours sleeping at night : Overweight people : South Houston:
31.0%Texas:
33.1%
General health condition : South Houston:
52.9%Texas:
56.2%
Average condition of hearing : More about Health and Nutrition of South Houston, TX Residents
Local government employment and payroll (March 2022)
Function
Full-time employees
Monthly full-time payroll
Average yearly full-time wage
Part-time employees
Monthly part-time payroll
Police Protection - Officers
33 $196,363 $71,405 0 $0 Water Supply
13 $57,481 $53,059 0 $0 Other and Unallocable
11 $39,656 $43,261 0 $0 Health
9 $34,742 $46,323 7 $12,506 Streets and Highways
9 $29,461 $39,281 0 $0 Police - Other
8 $29,973 $44,960 0 $0 Sewerage
8 $30,338 $45,507 0 $0 Parks and Recreation
8 $23,739 $35,609 0 $0 Other Government Administration
6 $21,244 $42,488 5 $5,000 Solid Waste Management
4 $11,368 $34,104 0 $0 Financial Administration
3 $13,791 $55,164 0 $0 Judicial and Legal
2 $6,718 $40,308 2 $4,260 Firefighters
0 $0 6 $2,692
Totals for Government
114 $494,873 $52,092 20 $24,459
South Houston government finances - Expenditure in 2017 (per resident):
Construction - Regular Highways: $188,000 ($11.85)
General - Other: $64,000 ($4.04)Judicial and Legal Services: $3,000 ($0.19)Current Operations - Correctional Institutions: $647,000 ($40.79)
Judicial and Legal Services: $531,000 ($33.48)Corrections - Other: $434,000 ($27.36)Police Protection: $389,000 ($24.53)General - Other: $285,000 ($17.97)Regular Highways: $281,000 ($17.72)Financial Administration: $113,000 ($7.12)General Public Buildings: $60,000 ($3.78)Local Fire Protection: $28,000 ($1.77)Central Staff Services: $27,000 ($1.70)Public Welfare, Vendor Payments for Medical Care: $22,000 ($1.39)Public Welfare - Other: $19,000 ($1.20)Natural Resources - Other: $8,000 ($0.50)Solid Waste Management: $8,000 ($0.50)General - Interest on Debt: $37,000 ($2.33)
Other Capital Outlay - General - Other: $42,000 ($2.65)
Corrections - Other: $16,000 ($1.01)Correctional Institutions: $7,000 ($0.44)Judicial and Legal Services: $3,000 ($0.19)Central Staff Services: $1,000 ($0.06)
South Houston government finances - Revenue in 2017 (per resident):
Charges - Other: $333,000 ($21.00)
Regular Highways: $8,000 ($0.50)Federal Intergovernmental - Other: $21,000 ($1.32)
Local Intergovernmental - Other: $38,000 ($2.40)
Miscellaneous - General Revenue - Other: $115,000 ($7.25)
Fines and Forfeits: $51,000 ($3.22)Interest Earnings: $10,000 ($0.63)Rents: $3,000 ($0.19)Sale of Property: $1,000 ($0.06)Donations From Private Sources: $1,000 ($0.06)State Intergovernmental - Other: $131,000 ($8.26)
General Local Government Support: $20,000 ($1.26)Highways: $4,000 ($0.25)Tax - Property: $1,983,000 ($125.03)
General Sales and Gross Receipts: $632,000 ($39.85)Motor Vehicle License: $125,000 ($7.88)Other Selective Sales: $76,000 ($4.79)Amusements Sales: $3,000 ($0.19)
South Houston government finances - Debt in 2017 (per resident):
Long Term Debt - Beginning Outstanding - Unspecified Public Purpose: $1,012,000 ($63.81)
Outstanding Unspecified Public Purpose: $883,000 ($55.67)Retired Unspecified Public Purpose: $129,000 ($8.13)
South Houston government finances - Cash and Securities in 2017 (per resident):
Bond Funds - Cash and Securities: $45,000 ($2.84)
Other Funds - Cash and Securities: $1,962,000 ($123.71)
Sinking Funds - Cash and Securities: $61,000 ($3.85)
5.26% of this county's 2021 resident taxpayers lived in other counties in 2020 ($67,872 average adjusted gross income )
Here:
5.26%Texas average:
8.12%
0.02% of residents moved from foreign countries ($158 average AGI )Harris County:
0.02%Texas average:
0.04%
Top counties from which taxpayers relocated into this county between 2020 and 2021:
5.91% of this county's 2020 resident taxpayers moved to other counties in 2021 ($76,622 average adjusted gross income )
Here:
5.91%Texas average:
7.40%
0.01% of residents moved to foreign countries ($155 average AGI )Harris County:
0.01%Texas average:
0.03%
Top counties to which taxpayers relocated from this county between 2020 and 2021:
Businesses in South Houston, TX
Name Count Name Count
Burger King 1 McDonald's 1 Church's Chicken 1 Payless 1 Cricket Wireless 6 U-Haul 1 DHL 1 Vans 1 Domino's Pizza 1 Wendy's 1 GameStop 1
Strongest AM radio stations in South Houston:
KLVL (1480 AM; 3 kW; PASADENA, TX; Owner: SIGA BROADCASTING CORP.)
KXYZ (1320 AM; 5 kW; HOUSTON, TX; Owner: BLAYA INC.)
KTRH (740 AM; 50 kW; HOUSTON, TX; Owner: AMFM TEXAS LICENSES LIMITED PARTNERSHIP)
KCOH (1430 AM; 5 kW; HOUSTON, TX; Owner: KCOH, INC.)
KPRC (950 AM; 5 kW; HOUSTON, TX; Owner: CCB TEXAS LICENSES, L.P.)
KGOL (1180 AM; 50 kW; HUMBLE, TX; Owner: ENTRAVISION HOLDINGS, LLC)
KILE (1560 AM; 50 kW; BELLAIRE, TX; Owner: THE RAFTT CORPORATION)
KLAT (1010 AM; 10 kW; HOUSTON, TX; Owner: TICHENOR LICENSE CORPORATION ("TLC"))
KIKK (650 AM; daytime; 0 kW; PASADENA, TX; Owner: TEXAS INFINITY BROADCASTING L.P.)
KILT (610 AM; 5 kW; HOUSTON, TX; Owner: TEXAS INFINITY BROADCASTING L.P.)
KWWJ (1360 AM; 5 kW; BAYTOWN, TX; Owner: SALT OF THE EARTH BROADCASTING, INC.)
KEYH (850 AM; 10 kW; HOUSTON, TX; Owner: LIBERMAN BROADCASTING OF HOUSTON LICENSE CORP.)
KKHT (1070 AM; 10 kW; HOUSTON, TX; Owner: SOUTH TEXAS BROADCASTING, INC.)
Strongest FM radio stations in South Houston:
KMJQ (102.1 FM; HOUSTON, TX; Owner: RADIO ONE LICENSES, LLC)
KLTN (102.9 FM; HOUSTON, TX; Owner: HBC HOUSTON LICENSE CORPORATION)
KUHF (88.7 FM; HOUSTON, TX; Owner: UNIVERSITY OF HOUSTON SYSTEM)
KBXX (97.9 FM; HOUSTON, TX; Owner: RADIO ONE LICENSES, LLC)
KHJZ-FM (95.7 FM; HOUSTON, TX; Owner: TEXAS INFINITY BROADCASTING L.P.)
KHMX (96.5 FM; HOUSTON, TX; Owner: CITICASTERS LICENSES, L.P.)
KILT-FM (100.3 FM; HOUSTON, TX; Owner: TEXAS INFINITY BROADCASTING L.P.)
KKBQ-FM (92.9 FM; PASADENA, TX; Owner: CXR HOLDINGS, INC.)
KLOL (101.1 FM; HOUSTON, TX; Owner: AMFM TEXAS LICENSES LIMITED PARTNERSHIP)
KODA (99.1 FM; HOUSTON, TX; Owner: AMFM TEXAS LICENSES LIMITED PARTNERSHIP)
KTBZ-FM (94.5 FM; HOUSTON, TX; Owner: AMFM TEXAS LICENSES LIMITED PARTNERSHIP)
KRBE (104.1 FM; HOUSTON, TX; Owner: KRBE LICO, INC.)
KKRW (93.7 FM; HOUSTON, TX; Owner: CAPSTAR TX LIMITED PARTNERSHIP)
KHCB-FM (105.7 FM; HOUSTON, TX; Owner: HOUSTON CHRISTIAN BROADCASTERS, INC.)
KPTY (104.9 FM; MISSOURI CITY, TX; Owner: TICHENOR LICENSE CORPORATION ("TLC"))
KLDE (107.5 FM; LAKE JACKSON, TX; Owner: CXR HOLDINGS, INC.)
KFTG (88.1 FM; PASADENA, TX; Owner: ALELUYA CHRISTIAN BROADCASTING, INC.)
KOVE-FM (106.5 FM; GALVESTON, TX; Owner: HBC LICENSE CORPORATION)
KTSU (90.9 FM; HOUSTON, TX; Owner: TEXAS SOUTHERN UNIVERSITY)
KPFT (90.1 FM; HOUSTON, TX; Owner: PACIFICA FOUNDATION, INC.)
TV broadcast stations around South Houston:
KJIB-LP (Channel 5; CLEAR LAKE CITY, TX; Owner: FAR EASTERN TELECASTERS)
KTMD (Channel 48; GALVESTON, TX; Owner: TELEMUNDO OF TEXAS PARTNERSHIP, LP)
KPRC-TV (Channel 2; HOUSTON, TX; Owner: POST-NEWSWEEK STATIONS, HOUSTON, LP)
KHOU-TV (Channel 11; HOUSTON, TX; Owner: KHOU-TV, L.P.)
KRIV (Channel 26; HOUSTON, TX; Owner: FOX TELEVISION STATIONS, INC.)
KTRK-TV (Channel 13; HOUSTON, TX; Owner: KTRK TELEVISION, INC.)
KHWB (Channel 39; HOUSTON, TX; Owner: KHWB, INC.)
KVVV-LP (Channel 53; HOUSTON, TX; Owner: KAZH LICENSE, LLC)
KUHT (Channel 8; HOUSTON, TX; Owner: UNIVERSITY OF HOUSTON SYSTEM)
KNWS-TV (Channel 51; KATY, TX; Owner: JOHNSON BROADCASTING, INC.)
KPXB (Channel 49; CONROE, TX; Owner: PAXSON HOUSTON LICENSE, INC.)
KXLN-TV (Channel 45; ROSENBERG, TX; Owner: KXLN LICENSE PARTNERSHIP, L.P.)
KFTH (Channel 67; ALVIN, TX; Owner: TELEFUTURA HOUSTON LLC)
KVQT-LP (Channel 24; HOUSTON, TX; Owner: C. DOWEN JOHNSON)
KTBU (Channel 55; CONROE, TX; Owner: HUMANITY INTERESTED MEDIA, INC.)
KTXH (Channel 20; HOUSTON, TX; Owner: FOX TELEVISION STATIONS, INC.)
KZJL (Channel 61; HOUSTON, TX; Owner: KZJL LICENSE CORP.)
KETH (Channel 14; HOUSTON, TX; Owner: COMMUNITY EDUCATIONAL TV, INC.)
KVDO-LP (Channel 69; CLEAR LAKE, TX; Owner: FAR EASTERN TELECASTERS)
KLTJ (Channel 22; GALVESTON, TX; Owner: WORD OF GOD FELLOWSHIP, INC.)
KBPX-LP (Channel 33; HOUSTON, TX; Owner: PAXSON COMMUNICATIONS LPTV, INC.)
KHMV-LP (Channel 28; HOUSTON, TX; Owner: PAPPAS TELECASTING OF THE GULF COAST, A CALIFORNIA LP)
KAZH (Channel 57; BAYTOWN, TX; Owner: KAZH LICENSE, LLC)
KHLM-LP (Channel 43; HOUSTON, TX; Owner: U.S. INTERACTIVE, L.L.C.)
KVIT-LP (Channel 28; VICTORIA, TX; Owner: CLUB COMMUNICATIONS)
National Bridge Inventory (NBI) Statistics 14 Number of bridges105ft / 31.6m Total length $390,000 Total costs115,963 Total average daily traffic2,274 Total average daily truck traffic160,630 Total future (year 2031) average daily traffic
New bridges - historical statistics
2 1960-1969 2 1970-1979 2 1980-1989 8 1990-1999
See full National Bridge Inventory statistics for South Houston, TX
FCC Registered Antenna Towers: 85 (
See the full list of FCC Registered Antenna Towers in South Houston )
FCC Registered Broadcast Land Mobile Towers: 9 (
See the full list of FCC Registered Broadcast Land Mobile Towers in South Houston, TX )
FCC Registered Microwave Towers: 17 (
See the full list of FCC Registered Microwave Towers in this town )
FCC Registered Amateur Radio Licenses: 23 (
See the full list of FCC Registered Amateur Radio Licenses in South Houston )
FAA Registered Aircraft: 2
Aircraft: MAULE MX-7-180A (Category: Land, Seats: 5, Weight: Up to 12,499 Pounds), Engine: LYCOMING O&VO-360 SER (180 HP) (Reciprocating)N-Number: 897DC, N897DC, N-897DC, Serial Number: 20012C, Airworthiness Date: 10/28/1993, Certificate Issue Date: 01/09/2019Registrant (LLC): Pullen Endeavors LLC, 110 Indiana St, South Houston, TX 77587Aircraft: CONSOLIDATED VULTEE BT-13B (SNV-2) (Category: Land, Seats: 2, Weight: Up to 12,499 Pounds, Speed: 108 mph), Engine: P&W R-985 SERIES (450 HP) (Reciprocating)N-Number: 59332, N59332, N-59332, Serial Number: 791675, Year manufactured: 1944Registrant (Individual): John G Wesney, Box 154, South Houston, TX 77587Deregistered: Cancel Date: 01/21/2020
Home Mortgage Disclosure Act Aggregated Statistics For Year 2009(Based on 3 full tracts) A) FHA, FSA/RHS & VA B) Conventional C) Refinancings D) Home Improvement Loans F) Non-occupant Loans on G) Loans On Manufactured Number Average Value Number Average Value Number Average Value Number Average Value Number Average Value Number Average Value
LOANS ORIGINATED 19 $82,263 11 $79,455 25 $68,480 7 $49,143 6 $55,000 2 $49,000 APPLICATIONS APPROVED, NOT ACCEPTED 4 $77,000 1 $76,000 3 $56,667 1 $4,000 1 $76,000 0 $0 APPLICATIONS DENIED 6 $86,500 6 $65,333 49 $66,224 30 $26,333 7 $68,714 0 $0 APPLICATIONS WITHDRAWN 4 $91,750 0 $0 12 $75,333 4 $92,250 0 $0 0 $0 FILES CLOSED FOR INCOMPLETENESS 2 $71,000 0 $0 2 $61,500 1 $68,000 0 $0 0 $0
Aggregated Statistics For Year 2008(Based on 3 full tracts) A) FHA, FSA/RHS & VA B) Conventional C) Refinancings D) Home Improvement Loans E) Loans on Dwellings For 5+ Families F) Non-occupant Loans on G) Loans On Manufactured Number Average Value Number Average Value Number Average Value Number Average Value Number Average Value Number Average Value Number Average Value
LOANS ORIGINATED 19 $92,421 34 $86,029 45 $70,778 20 $38,100 1 $204,000 8 $60,000 1 $64,000 APPLICATIONS APPROVED, NOT ACCEPTED 1 $66,000 4 $107,000 10 $63,100 2 $33,000 0 $0 0 $0 0 $0 APPLICATIONS DENIED 7 $106,429 16 $85,688 109 $81,284 41 $30,780 1 $535,000 7 $87,286 3 $39,000 APPLICATIONS WITHDRAWN 3 $89,667 2 $84,000 17 $83,176 5 $55,800 0 $0 2 $84,000 0 $0 FILES CLOSED FOR INCOMPLETENESS 0 $0 3 $61,000 9 $81,778 1 $10,000 0 $0 1 $85,000 1 $52,000
Aggregated Statistics For Year 2007(Based on 3 full tracts) A) FHA, FSA/RHS & VA B) Conventional C) Refinancings D) Home Improvement Loans E) Loans on Dwellings For 5+ Families F) Non-occupant Loans on G) Loans On Manufactured Number Average Value Number Average Value Number Average Value Number Average Value Number Average Value Number Average Value Number Average Value
LOANS ORIGINATED 3 $80,000 97 $74,619 87 $73,885 30 $35,967 1 $2,288,000 27 $74,630 2 $54,000 APPLICATIONS APPROVED, NOT ACCEPTED 0 $0 10 $79,000 21 $80,000 8 $24,375 0 $0 1 $22,000 0 $0 APPLICATIONS DENIED 0 $0 35 $97,486 156 $77,833 58 $33,759 0 $0 17 $60,176 3 $73,333 APPLICATIONS WITHDRAWN 0 $0 11 $63,818 48 $73,208 4 $46,500 2 $400,500 2 $48,000 1 $100,000 FILES CLOSED FOR INCOMPLETENESS 0 $0 2 $91,000 12 $96,917 4 $40,250 1 $2,850,000 0 $0 0 $0
Aggregated Statistics For Year 2006(Based on 3 full tracts) A) FHA, FSA/RHS & VA B) Conventional C) Refinancings D) Home Improvement Loans E) Loans on Dwellings For 5+ Families F) Non-occupant Loans on G) Loans On Manufactured Number Average Value Number Average Value Number Average Value Number Average Value Number Average Value Number Average Value Number Average Value
LOANS ORIGINATED 5 $101,200 99 $72,889 108 $77,593 28 $33,536 0 $0 17 $74,235 4 $32,500 APPLICATIONS APPROVED, NOT ACCEPTED 0 $0 27 $64,111 22 $83,273 11 $34,455 1 $370,000 3 $52,333 4 $42,000 APPLICATIONS DENIED 1 $88,000 74 $60,959 160 $74,212 50 $33,860 0 $0 20 $56,550 10 $36,400 APPLICATIONS WITHDRAWN 1 $115,000 17 $162,176 71 $77,817 5 $53,800 0 $0 6 $55,667 0 $0 FILES CLOSED FOR INCOMPLETENESS 0 $0 7 $88,571 20 $85,700 2 $46,000 0 $0 1 $65,000 0 $0
Aggregated Statistics For Year 2005(Based on 3 full tracts) A) FHA, FSA/RHS & VA B) Conventional C) Refinancings D) Home Improvement Loans E) Loans on Dwellings For 5+ Families F) Non-occupant Loans on G) Loans On Manufactured Number Average Value Number Average Value Number Average Value Number Average Value Number Average Value Number Average Value Number Average Value
LOANS ORIGINATED 8 $70,375 126 $66,198 125 $69,912 25 $67,400 5 $784,200 19 $89,000 2 $22,000 APPLICATIONS APPROVED, NOT ACCEPTED 0 $0 42 $63,524 31 $75,935 4 $34,750 0 $0 8 $79,250 6 $22,333 APPLICATIONS DENIED 2 $86,000 64 $68,484 215 $66,944 63 $27,508 1 $2,200,000 17 $55,059 2 $18,000 APPLICATIONS WITHDRAWN 1 $79,000 27 $89,519 66 $88,833 12 $333,083 0 $0 5 $113,200 0 $0 FILES CLOSED FOR INCOMPLETENESS 0 $0 6 $63,667 20 $92,450 0 $0 0 $0 1 $81,000 0 $0
Aggregated Statistics For Year 2004(Based on 3 full tracts) A) FHA, FSA/RHS & VA B) Conventional C) Refinancings D) Home Improvement Loans E) Loans on Dwellings For 5+ Families F) Non-occupant Loans on G) Loans On Manufactured Number Average Value Number Average Value Number Average Value Number Average Value Number Average Value Number Average Value Number Average Value
LOANS ORIGINATED 11 $77,818 121 $63,149 169 $64,107 27 $36,704 1 $103,000 17 $52,647 4 $55,750 APPLICATIONS APPROVED, NOT ACCEPTED 0 $0 55 $62,564 36 $62,639 13 $33,692 0 $0 5 $76,200 5 $27,800 APPLICATIONS DENIED 5 $76,600 51 $66,000 196 $61,878 76 $26,921 0 $0 16 $50,938 8 $37,500 APPLICATIONS WITHDRAWN 5 $79,000 10 $80,400 69 $66,348 7 $61,286 0 $0 2 $59,000 0 $0 FILES CLOSED FOR INCOMPLETENESS 0 $0 14 $79,071 29 $73,138 0 $0 0 $0 2 $67,000 0 $0
Aggregated Statistics For Year 2003(Based on 3 full tracts) A) FHA, FSA/RHS & VA B) Conventional C) Refinancings D) Home Improvement Loans E) Loans on Dwellings For 5+ Families F) Non-occupant Loans on Number Average Value Number Average Value Number Average Value Number Average Value Number Average Value Number Average Value
LOANS ORIGINATED 20 $80,100 109 $66,046 199 $59,759 24 $26,792 1 $204,000 19 $57,947 APPLICATIONS APPROVED, NOT ACCEPTED 2 $47,500 25 $68,320 31 $57,806 5 $91,600 0 $0 6 $56,500 APPLICATIONS DENIED 4 $66,750 56 $60,696 186 $55,183 43 $15,395 0 $0 20 $59,300 APPLICATIONS WITHDRAWN 7 $75,143 13 $66,154 77 $60,260 2 $47,500 0 $0 11 $57,636 FILES CLOSED FOR INCOMPLETENESS 2 $98,500 13 $69,769 11 $61,545 0 $0 0 $0 1 $70,000
Aggregated Statistics For Year 1999(Based on 2 full tracts) A) FHA, FSA/RHS & VA B) Conventional C) Refinancings D) Home Improvement Loans E) Loans on Dwellings For 5+ Families F) Non-occupant Loans on Number Average Value Number Average Value Number Average Value Number Average Value Number Average Value Number Average Value
LOANS ORIGINATED 32 $64,798 72 $49,252 76 $42,736 27 $13,019 3 $489,727 12 $36,558 APPLICATIONS APPROVED, NOT ACCEPTED 0 $0 25 $43,279 21 $41,644 15 $9,926 0 $0 3 $31,667 APPLICATIONS DENIED 6 $60,862 96 $44,460 34 $39,613 48 $11,850 0 $0 14 $50,166 APPLICATIONS WITHDRAWN 1 $71,450 13 $57,538 24 $40,682 1 $19,580 0 $0 0 $0 FILES CLOSED FOR INCOMPLETENESS 1 $48,940 7 $57,216 9 $31,888 1 $24,510 0 $0 2 $21,535
Detailed HMDA statistics for the following Tracts:
3208.00
, 3214.00 , 3215.00
Private Mortgage Insurance Companies Aggregated Statistics For Year 2009(Based on 1 full tract) A) Conventional B) Refinancings Number Average Value Number Average Value
LOANS ORIGINATED 1 $102,000 0 $0 APPLICATIONS APPROVED, NOT ACCEPTED 2 $66,000 1 $83,000 APPLICATIONS DENIED 0 $0 0 $0 APPLICATIONS WITHDRAWN 0 $0 0 $0 FILES CLOSED FOR INCOMPLETENESS 1 $78,000 0 $0
Aggregated Statistics For Year 2008(Based on 3 full tracts) A) Conventional B) Refinancings C) Non-occupant Loans on Number Average Value Number Average Value Number Average Value
LOANS ORIGINATED 22 $89,636 5 $101,600 2 $48,500 APPLICATIONS APPROVED, NOT ACCEPTED 15 $88,867 2 $104,500 2 $94,000 APPLICATIONS DENIED 1 $138,000 0 $0 0 $0 APPLICATIONS WITHDRAWN 3 $102,333 4 $109,000 0 $0 FILES CLOSED FOR INCOMPLETENESS 1 $80,000 0 $0 0 $0
Aggregated Statistics For Year 2007(Based on 3 full tracts) A) Conventional B) Refinancings C) Non-occupant Loans on Number Average Value Number Average Value Number Average Value
LOANS ORIGINATED 48 $90,708 6 $92,167 3 $61,333 APPLICATIONS APPROVED, NOT ACCEPTED 6 $103,167 1 $88,000 0 $0 APPLICATIONS DENIED 2 $114,000 0 $0 0 $0 APPLICATIONS WITHDRAWN 2 $104,000 0 $0 0 $0 FILES CLOSED FOR INCOMPLETENESS 0 $0 0 $0 0 $0
Aggregated Statistics For Year 2006(Based on 3 full tracts) A) Conventional B) Refinancings Number Average Value Number Average Value
LOANS ORIGINATED 18 $88,278 5 $80,400 APPLICATIONS APPROVED, NOT ACCEPTED 0 $0 1 $108,000 APPLICATIONS DENIED 0 $0 0 $0 APPLICATIONS WITHDRAWN 1 $66,000 0 $0 FILES CLOSED FOR INCOMPLETENESS 0 $0 0 $0
Aggregated Statistics For Year 2005(Based on 3 full tracts) A) Conventional B) Refinancings Number Average Value Number Average Value
LOANS ORIGINATED 24 $93,500 1 $66,000 APPLICATIONS APPROVED, NOT ACCEPTED 3 $94,333 0 $0 APPLICATIONS DENIED 1 $117,000 0 $0 APPLICATIONS WITHDRAWN 1 $95,000 0 $0 FILES CLOSED FOR INCOMPLETENESS 0 $0 0 $0
Aggregated Statistics For Year 2004(Based on 3 full tracts) A) Conventional B) Refinancings C) Non-occupant Loans on Number Average Value Number Average Value Number Average Value
LOANS ORIGINATED 26 $74,692 9 $82,444 2 $55,500 APPLICATIONS APPROVED, NOT ACCEPTED 3 $73,333 0 $0 0 $0 APPLICATIONS DENIED 1 $92,000 0 $0 0 $0 APPLICATIONS WITHDRAWN 0 $0 1 $75,000 0 $0 FILES CLOSED FOR INCOMPLETENESS 0 $0 0 $0 0 $0
Aggregated Statistics For Year 2003(Based on 3 full tracts) A) Conventional B) Refinancings Number Average Value Number Average Value
LOANS ORIGINATED 33 $83,212 9 $68,556 APPLICATIONS APPROVED, NOT ACCEPTED 7 $76,000 1 $83,000 APPLICATIONS DENIED 1 $88,000 0 $0 APPLICATIONS WITHDRAWN 2 $75,500 1 $95,000 FILES CLOSED FOR INCOMPLETENESS 0 $0 0 $0
Aggregated Statistics For Year 1999(Based on 2 full tracts) A) Conventional B) Refinancings C) Non-occupant Loans on Number Average Value Number Average Value Number Average Value
LOANS ORIGINATED 35 $57,089 5 $44,842 3 $46,983 APPLICATIONS APPROVED, NOT ACCEPTED 2 $39,680 1 $33,280 0 $0 APPLICATIONS DENIED 3 $60,033 0 $0 0 $0 APPLICATIONS WITHDRAWN 0 $0 0 $0 0 $0 FILES CLOSED FOR INCOMPLETENESS 1 $45,020 1 $75,480 0 $0
Detailed PMIC statistics for the following Tracts:
3208.00
, 3214.00 , 3215.00
Most common first names in South Houston, TX among deceased individuals Name Count Lived (average)
William 57 70.0 years Mary 51 75.1 years James 47 67.6 years John 46 71.2 years Charles 36 66.8 years Maria 27 75.9 years Robert 27 68.1 years George 21 67.8 years Juan 18 74.9 years Jose 18 71.7 years
Most common last names in South Houston, TX among deceased individuals Last name Count Lived (average)
Garcia 33 69.5 years Smith 31 72.8 years Rodriguez 21 65.2 years Martinez 17 67.9 years Johnson 16 74.3 years Lopez 15 74.2 years Williams 15 72.8 years Jones 14 74.3 years Sanchez 14 73.1 years Ramirez 13 68.1 years
South Houston compared to Texas state average:
Median house value below state average. Unemployed percentage below state average. Black race population percentage significantly below state average. Hispanic race population percentage above state average. Foreign-born population percentage above state average. Length of stay since moving in significantly above state average. House age above state average. Percentage of population with a bachelor's degree or higher significantly below state average. South Houston on our top lists :
#50 on the list of "Top 101 cities with the lowest percentage of workers working at home, population 5,000+"
#57 on the list of "Top 101 cities with largest percentage of males in occupations: construction and extraction occupations (population 5,000+)"
#91 on the list of "Top 100 least-educated cities (pop. 5,000+)"
#95 on the list of "Top 101 cities with the highest number of auto thefts per 100,000 residents, excludes tourist destinations and others with a lot of outsiders visiting based on city industries data (population 5,000+)"
#95 on the list of "Top 101 cities with largest percentage of males in industries: construction (population 5,000+)"
#1 on the list of "Top 101 counties with the most Mainline Protestant adherents"
#1 on the list of "Top 101 counties with the most Evangelical Protestant adherents"
#2 on the list of "Top 101 counties with the most Evangelical Protestant congregations"
#3 on the list of "Top 101 counties with the highest ground withdrawal of fresh water for public supply"
#6 on the list of "Top 101 counties with the most Mainline Protestant congregations (pop. 50,000+)"
Top Patent Applicants
Casey Sue (1)
Miguel Angel Salazar (1)
Total of 2 patent applications in 2008-2024.


 Recent articles from our blog. Our writers, many of them Ph.D. graduates or candidates, create easy-to-read articles on a wide variety of topics.

 (3.5 miles
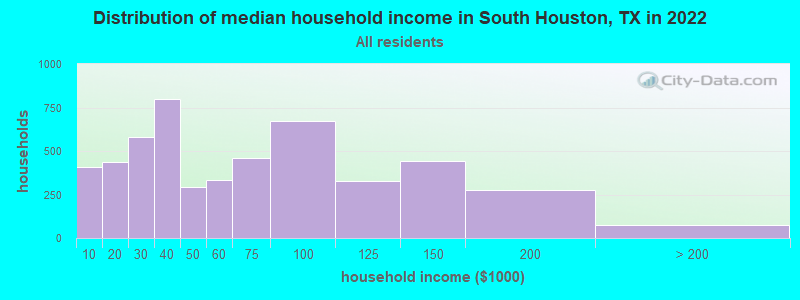
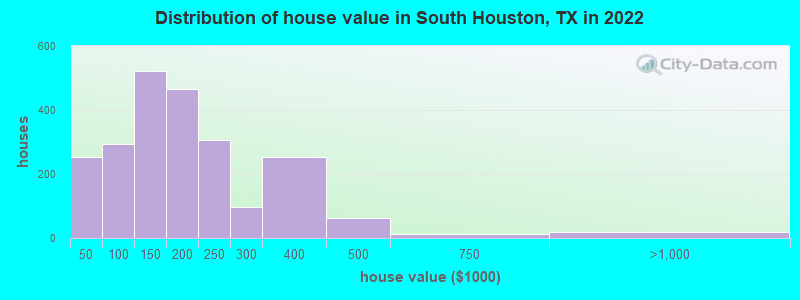
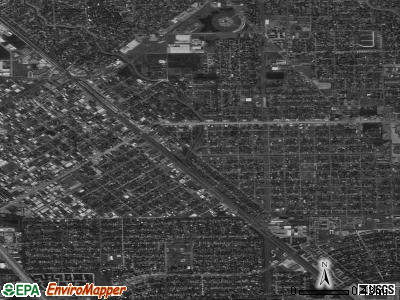
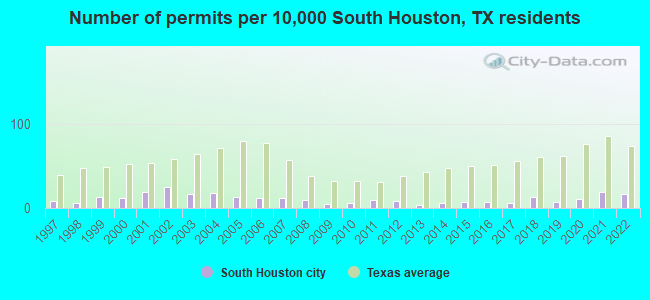
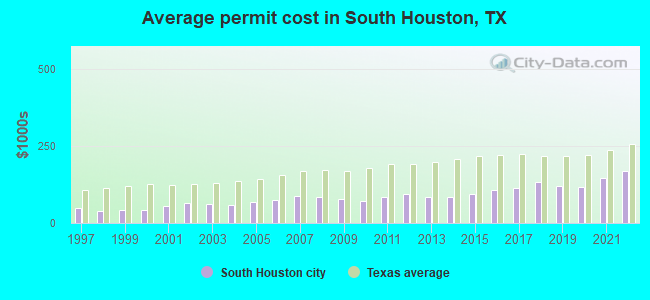
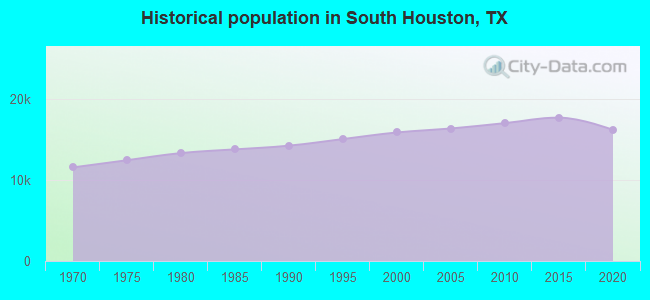
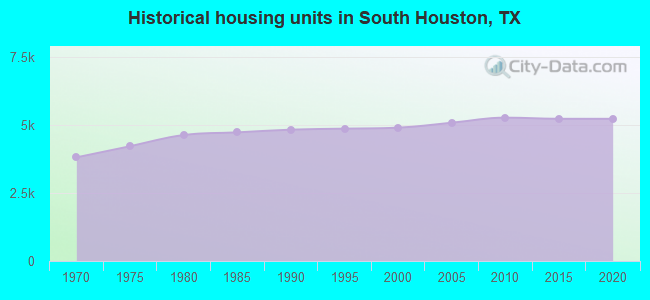
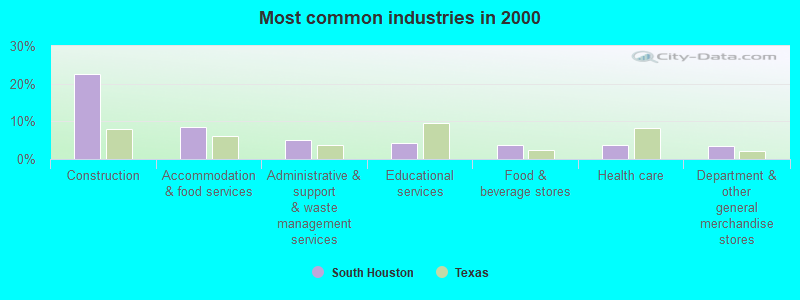
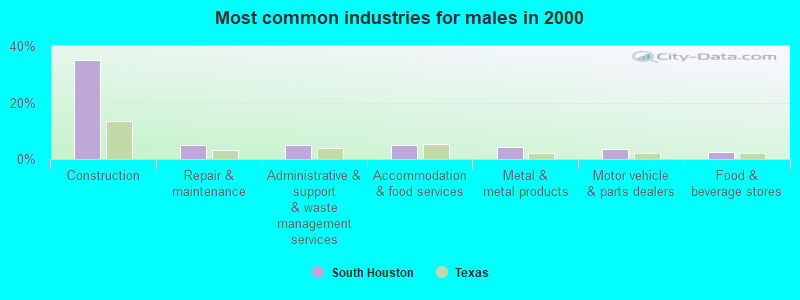
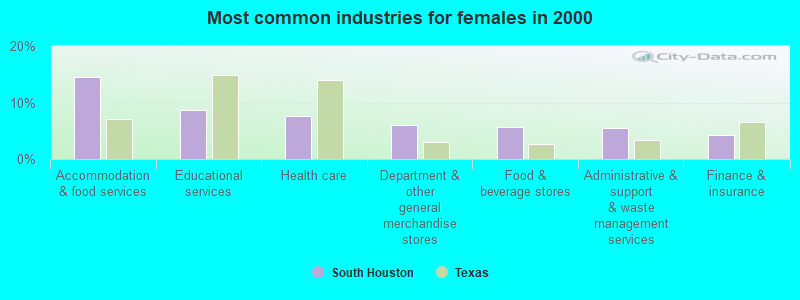
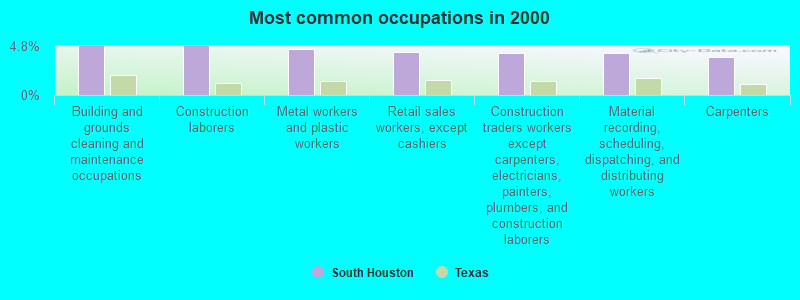
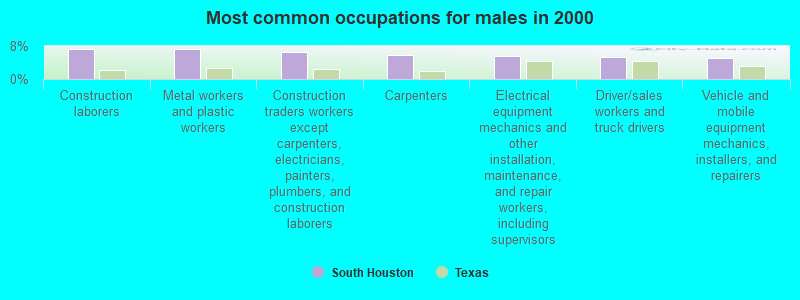
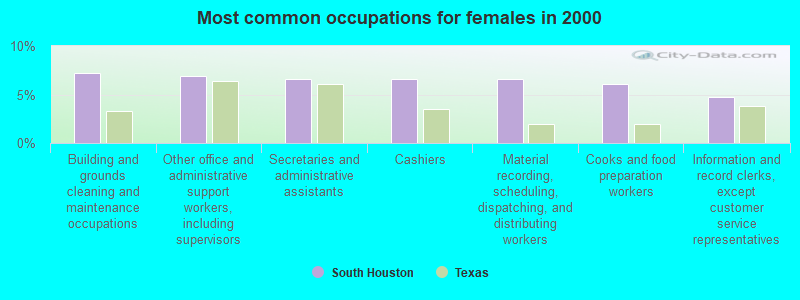
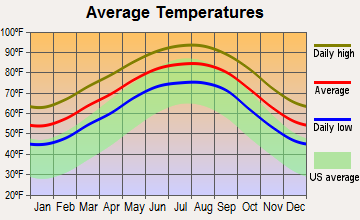
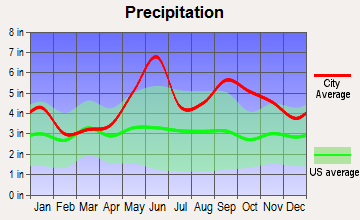
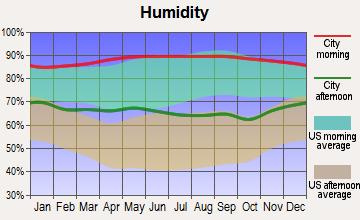
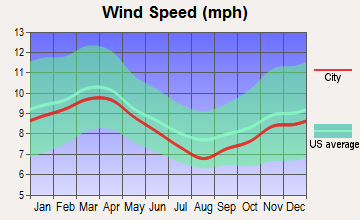
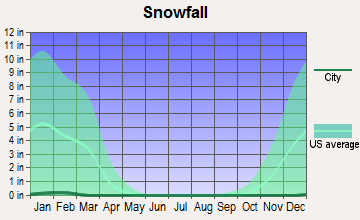
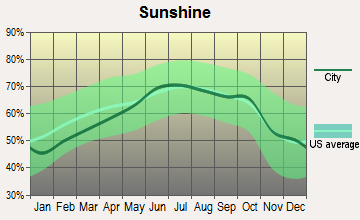
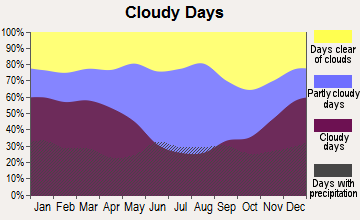
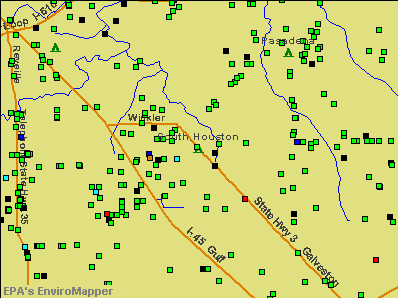

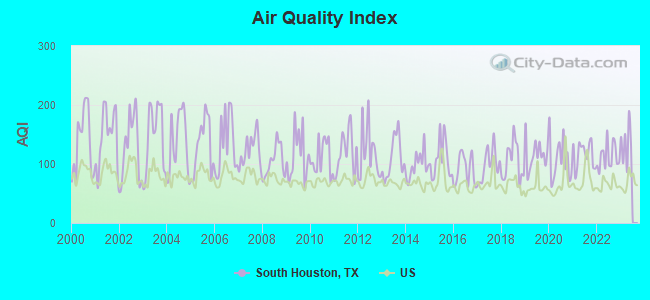
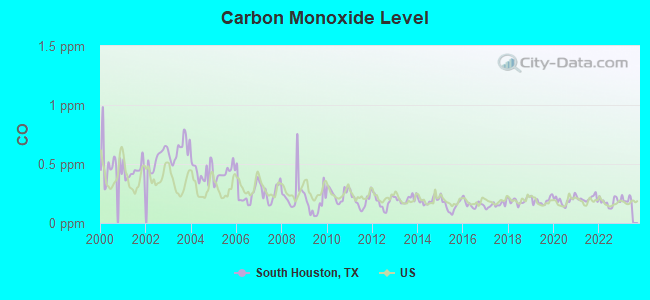
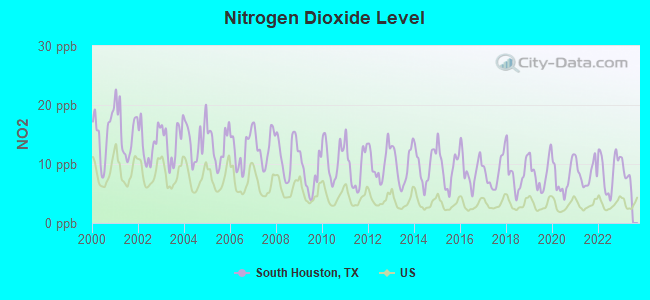
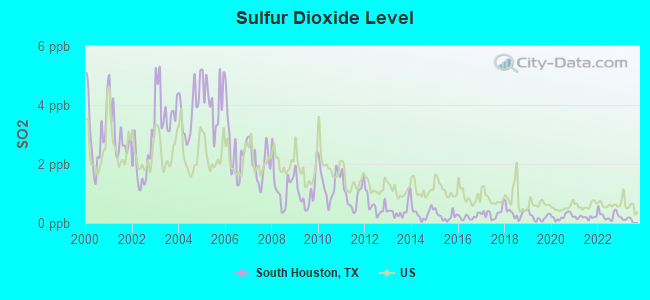
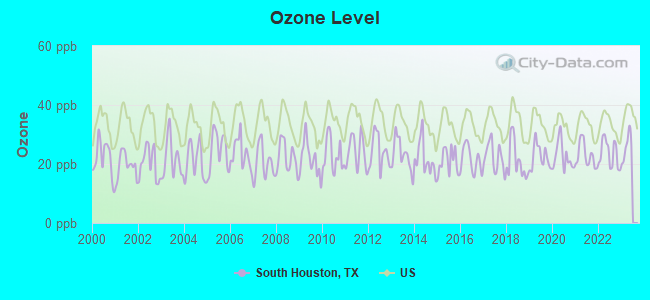
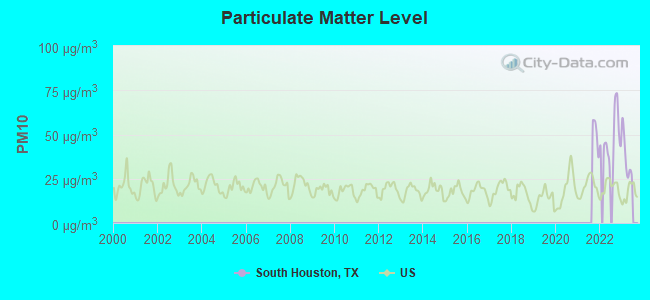
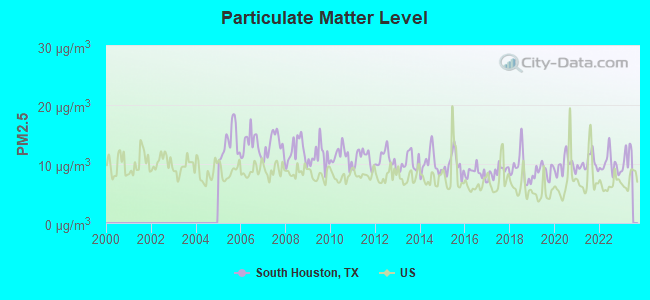
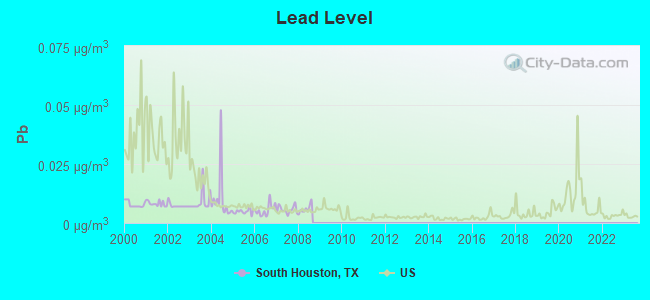
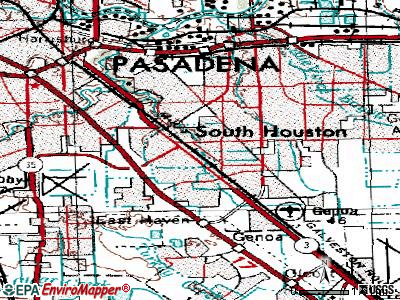
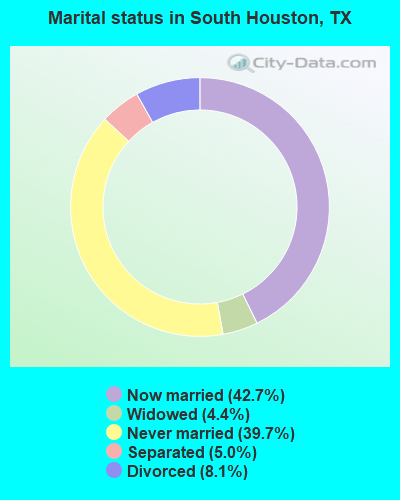
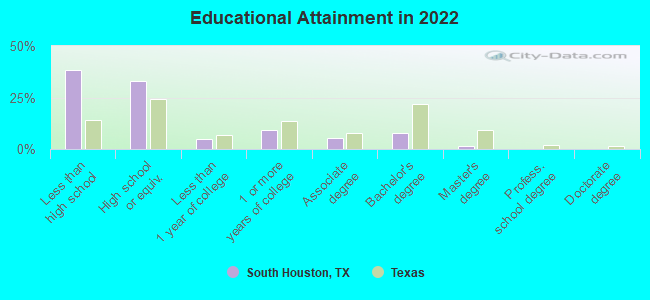
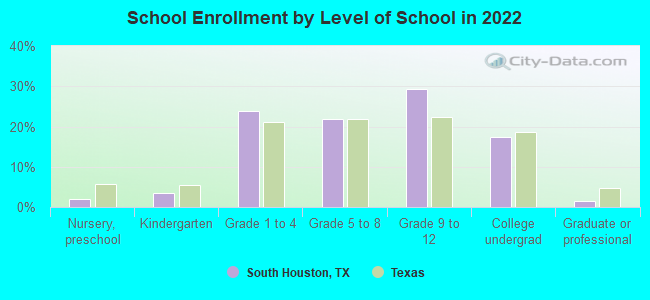
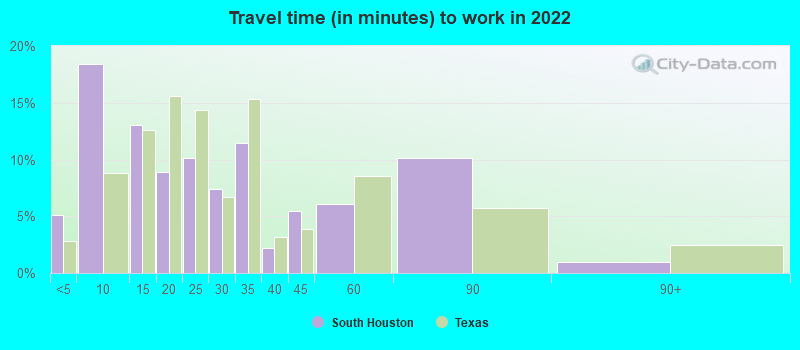
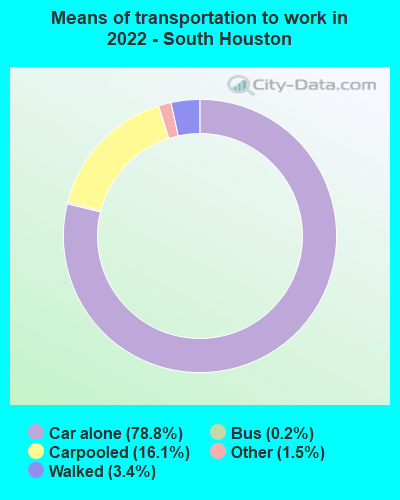
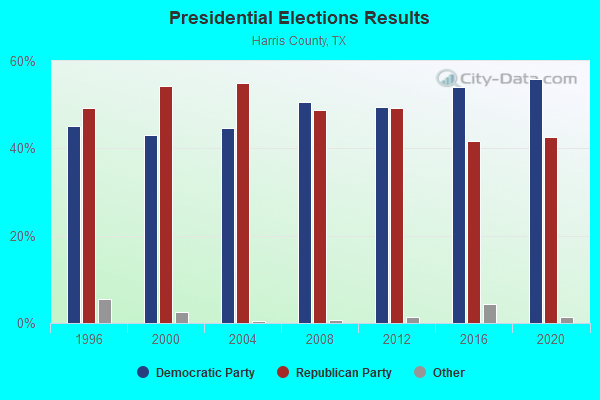
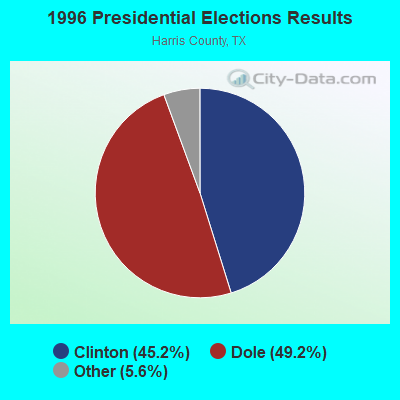
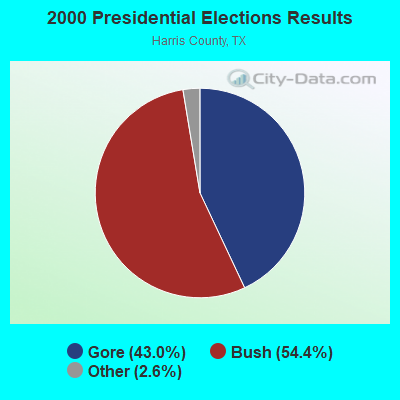
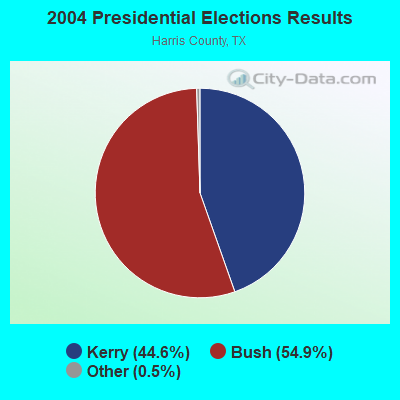
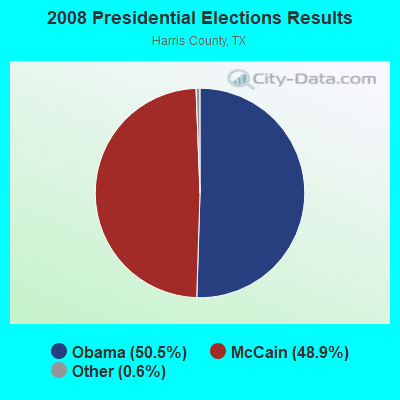
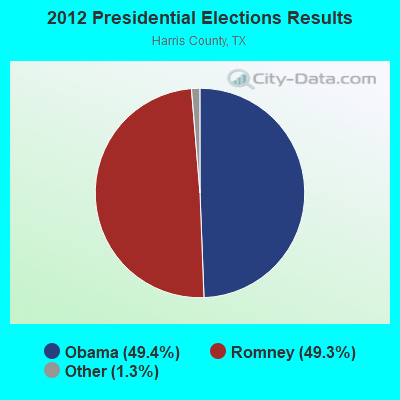
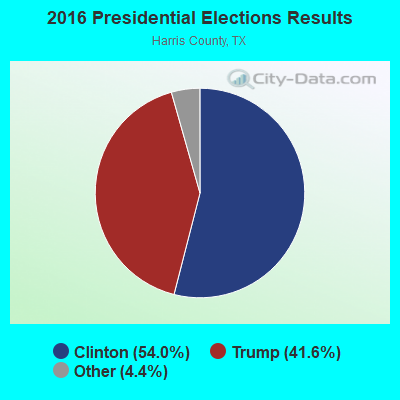
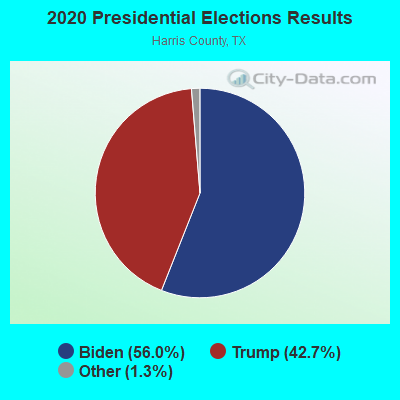
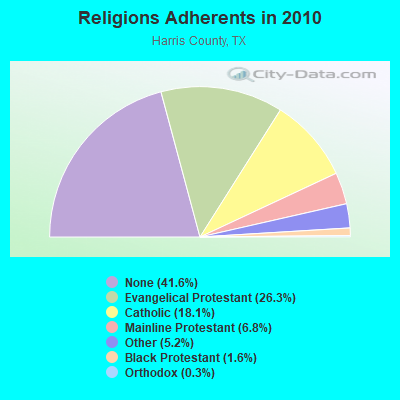
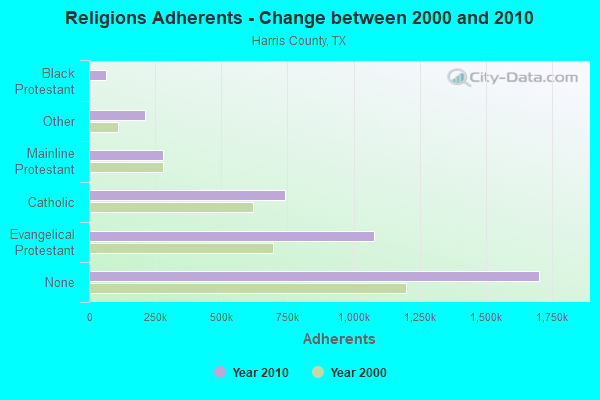
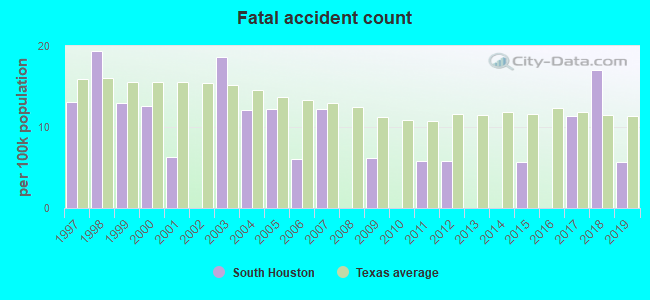
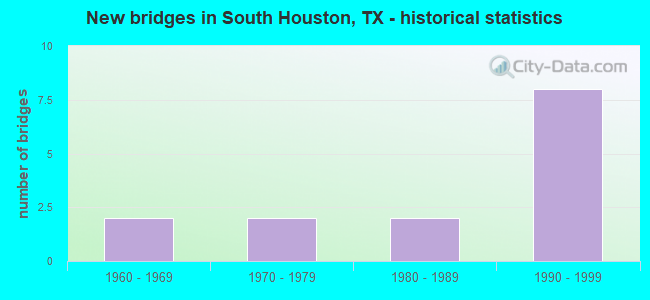
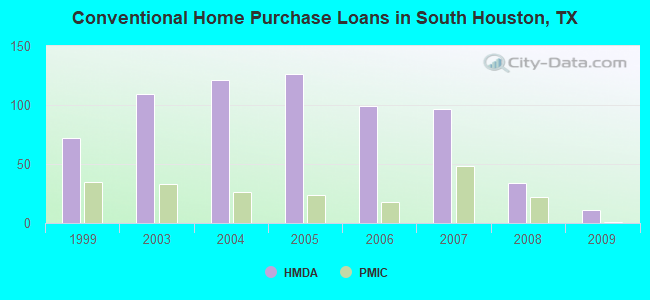
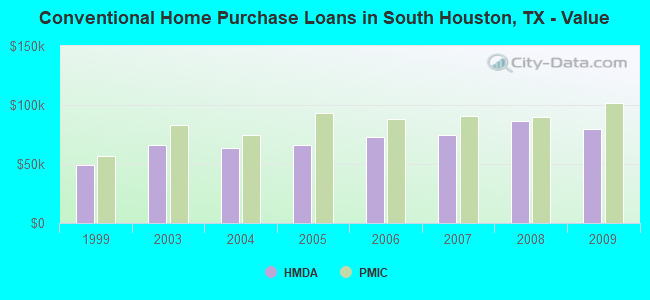
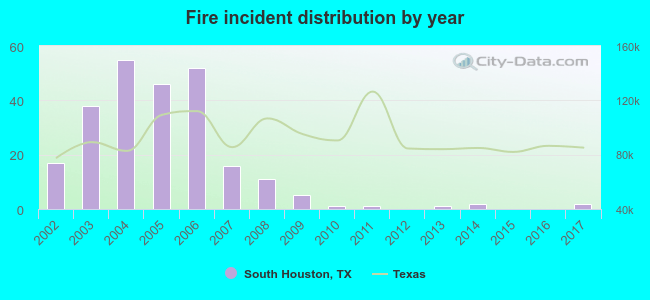 Based on the data from the years 2002 - 2017 the average number of fires per year is 15. The highest number of fires - 55 took place in 2004, and the least - 0 in 2012. The data has a declining trend.
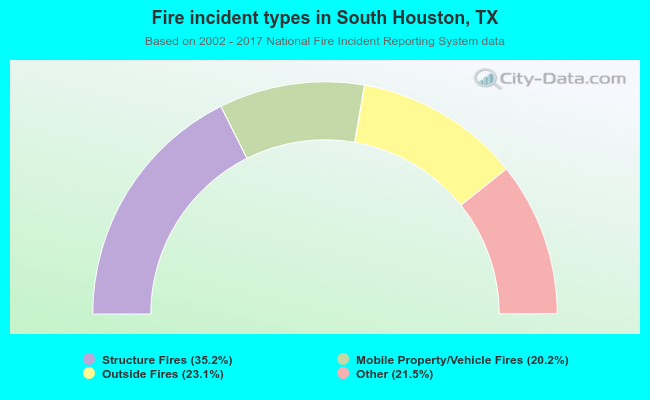 When looking into fire subcategories, the most incidents belonged to: Structure Fires (35.2%), and Outside Fires (23.1%).