Estimated zip code population in 2022: 34,001 Zip code population in 2010: 30,690 Zip code population in 2000: 28,635
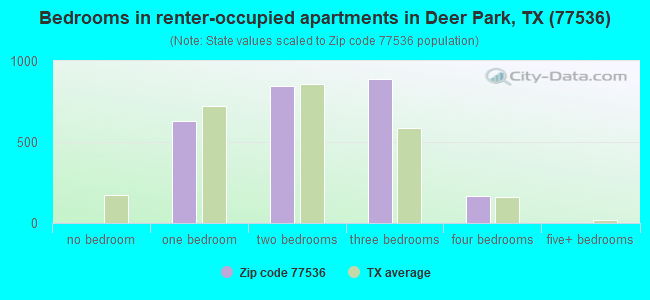
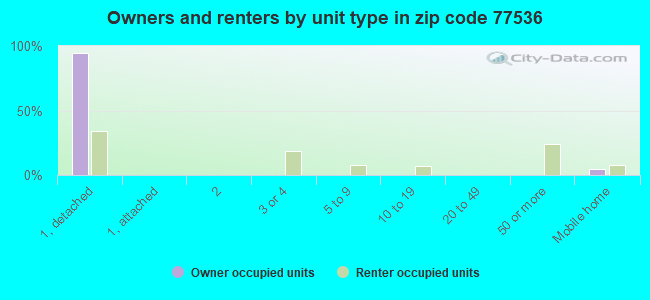
Houses and condos: 12,277 Renter-occupied apartments: 2,569
% of renters here:
22%
State:
38%
March 2022 cost of living index in zip code 77536: 95.6 (near average, U.S. average is 100)
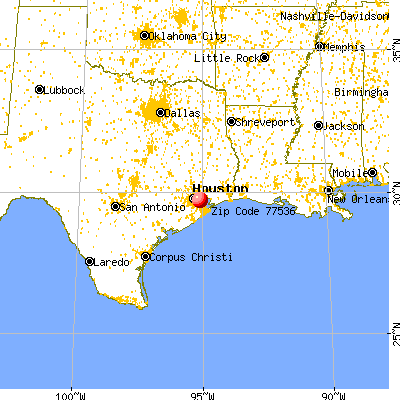
Land area: 12.5 sq. mi. Water area: 0.5 sq. mi.
Population density: 2,716 people per square mile
(average).
OSM Map
General Map
Google Map
MSN Map
OSM Map
General Map
Google Map
MSN Map
OSM Map
General Map
Google Map
MSN Map
OSM Map
General Map
Google Map
MSN Map
Please wait while loading the map...
Real estate property taxes paid for housing units in 2022:
This zip code:
1.5% ($3,862)
Texas:
1.5% ($4,050)
Median real estate property taxes paid for housing units with mortgages in 2022: $4,584 (1.7%) Median real estate property taxes paid for housing units with no mortgage in 2022: $2,687 (1.2%)
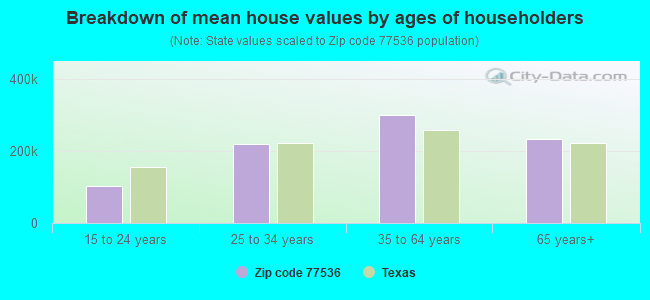
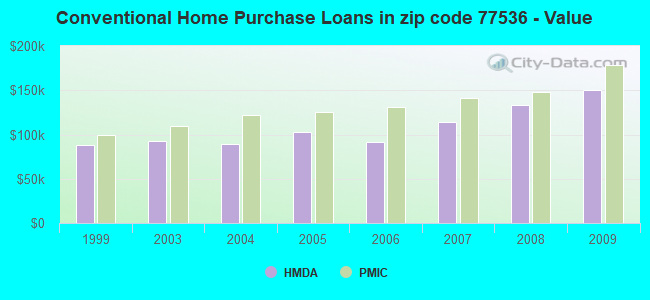
Estimated median house/condo value in 2022: $259,431
77536:
$259,431
Texas:
$275,400
According to our research of Texas and other state lists, there were 49 registered sex offenders living in 77536 zip code as of April 27, 2024. The ratio of all residents to sex offenders in zip code 77536 is 666 to 1. The ratio of registered sex offenders to all residents in this zip code is lower than the state average.
Median resident age:
This zip code:
37.9 years
Texas median age:
35.6 years
Average household size:
This zip code:
2.8 people
Texas:
2.6 people
Averages for the 2020 tax year for zip code 77536, filed in 2021:
Average Adjusted Gross Income (AGI) in 2020: $70,810 (Individual Income Tax Returns)
Here:
$70,810
State:
$77,054
Salary/wage: $64,955 (reported on 83.3% of returns)
Here:
$64,955
State:
$62,766
(% of AGI for various income ranges: 1076.6% for AGIs below $25k, 3367.3% for AGIs $25k-50k, 5992.5% for AGIs $50k-75k, 8772.8% for AGIs $75k-100k, 15914.5% for AGIs $100k-200k, 48567.5% for AGIs over 200k)
Taxable interest for individuals: $1,163 (reported on 25.9% of returns)
This zip code:
$1,163
Texas:
$2,665
(% of AGI for various income ranges: 9.9% for AGIs below $25k, 15.2% for AGIs $25k-50k, 27.4% for AGIs $50k-75k, 62.9% for AGIs $75k-100k, 53.8% for AGIs $100k-200k, 517.5% for AGIs over 200k)
Ordinary dividends: $4,063 (reported on 13.9% of returns)
Here:
$4,063
State:
$10,044
(% of AGI for various income ranges: 15.5% for AGIs below $25k, 27.4% for AGIs $25k-50k, 43.5% for AGIs $50k-75k, 73.8% for AGIs $75k-100k, 119.5% for AGIs $100k-200k, 1117.1% for AGIs over 200k)
Net capital gain/loss in AGI: +$10,214 (reported on 11.8% of returns)
Here:
+$10,214
State:
+$39,590
(% of AGI for various income ranges: 3.2% for AGIs below $25k, 16.3% for AGIs $25k-50k, 37.4% for AGIs $50k-75k, 69.2% for AGIs $75k-100k, 174.6% for AGIs $100k-200k, 4612.9% for AGIs over 200k)
Profit/loss from business: +$3,949 (reported on 16.5% of returns)
Here:
+$3,949
State:
+$10,888
(% of AGI for various income ranges: 72.9% for AGIs below $25k, 29.6% for AGIs $50k-75k, 17.2% for AGIs $75k-100k, 136.6% for AGIs $100k-200k, 1543.2% for AGIs over 200k)
Taxable individual retirement arrangement distribution: $26,518 (reported on 10.1% of returns)
77536:
$26,518
Texas:
$24,740
(% of AGI for various income ranges: 62.7% for AGIs below $25k, 128.0% for AGIs $25k-50k, 231.7% for AGIs $50k-75k, 504.9% for AGIs $75k-100k, 726.1% for AGIs $100k-200k, 3402.5% for AGIs over 200k)
Total itemized deductions: $33,779 (reported on 7.8% of returns)
Here:
$33,779
State:
$40,428
(% of AGI for various income ranges: 26.4% for AGIs below $25k, 135.7% for AGIs $25k-50k, 311.8% for AGIs $50k-75k, 453.8% for AGIs $75k-100k, 736.2% for AGIs $100k-200k, 3042.9% for AGIs over 200k)
Charity contributions: $11,935 (reported on 6.3% of returns)
Here:
$11,935
State:
$18,201
(% of AGI for various income ranges: 2.0% for AGIs below $25k, 22.4% for AGIs $25k-50k, 68.4% for AGIs $50k-75k, 98.9% for AGIs $75k-100k, 216.2% for AGIs $100k-200k, 1360.7% for AGIs over 200k)
Taxes paid: $7,526 (reported on 7.6% of returns)
77536:
$7,526
State:
$7,821
(% of AGI for various income ranges: 4.4% for AGIs below $25k, 24.7% for AGIs $25k-50k, 71.7% for AGIs $50k-75k, 107.4% for AGIs $75k-100k, 170.8% for AGIs $100k-200k, 574.3% for AGIs over 200k)
Earned income credit: $2,385 (reported on 14.0% of returns)
Here:
$2,385
State:
$2,584
(% of AGI for various income ranges: 91.3% for AGIs below $25k, 69.8% for AGIs $25k-50k, 0.9% for AGIs $50k-75k)
Percentage of individuals using paid preparers for their 2020 taxes: 92.8%
Here:
93%
State:
92%
(% for various income ranges: 92.4% for AGIs below $25k, 94.0% for AGIs $25k-50k, 93.5% for AGIs $50k-75k, 93.1% for AGIs $75k-100k, 92.5% for AGIs $100k-200k, 88.1% for AGIs over 200k)
Averages for the 2012 tax year for zip code 77536, filed in 2013:
Average Adjusted Gross Income (AGI) in 2012: $65,761 (Individual Income Tax Returns)
Here:
$65,761
State:
$65,384
Salary/wage: $60,727 (reported on 87.2% of returns)
Here:
$60,727
State:
$52,524
(% of AGI for various income ranges: 76.0% for AGIs below $25k, 82.0% for AGIs $25k-50k, 82.4% for AGIs $50k-75k, 83.6% for AGIs $75k-100k, 85.6% for AGIs $100k-200k, 62.5% for AGIs over 200k)
Taxable interest for individuals: $1,008 (reported on 33.7% of returns)
This zip code:
$1,008
Texas:
$2,372
(% of AGI for various income ranges: 1.1% for AGIs below $25k, 0.8% for AGIs $25k-50k, 0.4% for AGIs $50k-75k, 0.4% for AGIs $75k-100k, 0.3% for AGIs $100k-200k, 1.0% for AGIs over 200k)
Ordinary dividends: $3,790 (reported on 14.3% of returns)
Here:
$3,790
State:
$9,721
(% of AGI for various income ranges: 1.1% for AGIs below $25k, 0.8% for AGIs $25k-50k, 0.5% for AGIs $50k-75k, 0.6% for AGIs $75k-100k, 0.5% for AGIs $100k-200k, 2.0% for AGIs over 200k)
Net capital gain/loss in AGI: +$7,107 (reported on 10.8% of returns)
Here:
+$7,107
State:
+$35,319
(% of AGI for various income ranges: 0.4% for AGIs $75k-100k, 0.5% for AGIs $100k-200k, 6.4% for AGIs over 200k)
Profit/loss from business: +$8,669 (reported on 13.8% of returns)
Here:
+$8,669
State:
+$13,732
(% of AGI for various income ranges: 6.9% for AGIs below $25k, 1.8% for AGIs $25k-50k, 1.4% for AGIs $50k-75k, 1.0% for AGIs $75k-100k, 1.2% for AGIs $100k-200k, 3.0% for AGIs over 200k)
Taxable individual retirement arrangement distribution: $21,912 (reported on 10.1% of returns)
77536:
$21,912
Texas:
$19,511
(% of AGI for various income ranges: 3.6% for AGIs below $25k, 3.0% for AGIs $25k-50k, 3.5% for AGIs $50k-75k, 3.2% for AGIs $75k-100k, 3.2% for AGIs $100k-200k, 3.9% for AGIs over 200k)
Self-employment retirement plans: $16,833 (reported on 0.2% of returns)
77536:
$16,833
Texas:
$23,938
Total itemized deductions: $20,876 (19% of AGI, reported on 30.5% of returns)
Here:
$20,876
State:
$24,724
Here:
19.0% of AGI
State:
15.9% of AGI
(% of AGI for various income ranges: 6.8% for AGIs below $25k, 8.4% for AGIs $25k-50k, 10.9% for AGIs $50k-75k, 10.0% for AGIs $75k-100k, 9.5% for AGIs $100k-200k, 10.7% for AGIs over 200k)
Charity contributions: $5,097 (reported on 23.7% of returns)
Here:
$5,097
State:
$6,808
(% of AGI for various income ranges: 0.6% for AGIs below $25k, 1.1% for AGIs $25k-50k, 1.5% for AGIs $50k-75k, 1.8% for AGIs $75k-100k, 2.0% for AGIs $100k-200k, 2.8% for AGIs over 200k)
Taxes paid: $5,407 (reported on 29.8% of returns)
77536:
$5,407
State:
$6,921
(% of AGI for various income ranges: 1.1% for AGIs below $25k, 1.6% for AGIs $25k-50k, 2.6% for AGIs $50k-75k, 2.6% for AGIs $75k-100k, 2.8% for AGIs $100k-200k, 2.5% for AGIs over 200k)
Earned income credit: $2,225 (reported on 13.6% of returns)
Here:
$2,225
State:
$2,570
(% of AGI for various income ranges: 6.2% for AGIs below $25k, 1.1% for AGIs $25k-50k)
Percentage of individuals using paid preparers for their 2012 taxes: 49.1%
Here:
49%
State:
51%
(% for various income ranges: 42.7% for AGIs below $25k, 47.2% for AGIs $25k-50k, 51.9% for AGIs $50k-75k, 52.0% for AGIs $75k-100k, 54.9% for AGIs $100k-200k, 66.7% for AGIs over 200k)
Averages for the 2004 tax year for zip code 77536, filed in 2005:
Average Adjusted Gross Income (AGI) in 2004: $51,513 (Individual Income Tax Returns)
Here:
$51,513
State:
$47,881
Salary/wage: $49,301 (reported on 88.1% of returns)
Here:
$49,301
State:
$41,947
(% of AGI for various income ranges: 101.7% for AGIs below $10k, 78.4% for AGIs $10k-25k, 85.9% for AGIs $25k-50k, 85.6% for AGIs $50k-75k, 88.7% for AGIs $75k-100k, 80.4% for AGIs over 100k)
Taxable interest for individuals: $1,336 (reported on 41.4% of returns)
This zip code:
$1,336
Texas:
$2,255
(% of AGI for various income ranges: 4.3% for AGIs below $10k, 2.1% for AGIs $10k-25k, 0.9% for AGIs $25k-50k, 1.0% for AGIs $50k-75k, 0.7% for AGIs $75k-100k, 1.1% for AGIs over 100k)
Taxable dividends: $1,642 (reported on 19.2% of returns)
Here:
$1,642
State:
$4,261
(% of AGI for various income ranges: 2.1% for AGIs below $10k, 0.9% for AGIs $10k-25k, 0.5% for AGIs $25k-50k, 0.5% for AGIs $50k-75k, 0.4% for AGIs $75k-100k, 0.7% for AGIs over 100k)
Net capital gain/loss: +$4,363 (reported on 14.5% of returns)
Here:
+$4,363
State:
+$16,110
(% of AGI for various income ranges: -0.5% for AGIs below $10k, 0.0% for AGIs $10k-25k, 0.2% for AGIs $25k-50k, 0.4% for AGIs $50k-75k, 0.3% for AGIs $75k-100k, 3.0% for AGIs over 100k)
Profit/loss from business: +$6,593 (reported on 13.9% of returns)
Here:
+$6,593
State:
+$11,013
(% of AGI for various income ranges: -1.6% for AGIs below $10k, 4.8% for AGIs $10k-25k, 1.3% for AGIs $25k-50k, 1.4% for AGIs $50k-75k, 0.8% for AGIs $75k-100k, 2.4% for AGIs over 100k)
IRA payment deduction: $3,258 (reported on 1.8% of returns)
77536:
$3,258
Texas:
$3,120
(% of AGI for various income ranges: 0.1% for AGIs $10k-25k, 0.2% for AGIs $25k-50k, 0.1% for AGIs $50k-75k, 0.1% for AGIs $75k-100k, 0.1% for AGIs over 100k)
Self-employed pension: $15,123 (reported on 0.4% of returns)
Here:
$15,123
Texas:
$16,401
Total itemized deductions: $16,170 (20% of AGI, reported on 32.1% of returns)
Here:
$16,170
State:
$19,631
Here:
19.6% of AGI
State:
18.9% of AGI
(% of AGI for various income ranges: 6.9% for AGIs below $10k, 6.6% for AGIs $10k-25k, 10.2% for AGIs $25k-50k, 11.5% for AGIs $50k-75k, 10.9% for AGIs $75k-100k, 9.5% for AGIs over 100k)
Charity contributions deductions: $3,727 (4% of AGI, reported on 27.1% of returns)
Here:
$3,727
State:
$4,753
Here:
4.3% of AGI
State:
4.2% of AGI
(% of AGI for various income ranges: 0.5% for AGIs below $10k, 0.9% for AGIs $10k-25k, 1.4% for AGIs $25k-50k, 1.9% for AGIs $50k-75k, 2.2% for AGIs $75k-100k, 2.4% for AGIs over 100k)
Total tax: $7,408 (reported on 78.8% of returns)
77536:
$7,408
State:
$9,058
(% of AGI for various income ranges: 2.9% for AGIs below $10k, 4.1% for AGIs $10k-25k, 6.5% for AGIs $25k-50k, 9.0% for AGIs $50k-75k, 10.9% for AGIs $75k-100k, 16.7% for AGIs over 100k)
Earned income credit: $1,647 (reported on 11.8% of returns)
Here:
$1,647
State:
$2,024
Percentage of individuals using paid preparers for their 2004 taxes: 50.3%
Here:
50%
State:
57%
(% for various income ranges: 38.5% for AGIs below $10k, 52.5% for AGIs $10k-25k, 52.1% for AGIs $25k-50k, 55.3% for AGIs $50k-75k, 50.8% for AGIs $75k-100k, 53.1% for AGIs over 100k)
Likely homosexual households (counted as self-reported same-sex unmarried-partner households)
Lesbian couples: 0.3% of all households
Gay men: 0.0% of all households
Household received Food Stamps/SNAP in the past 12 months: 786 Household did not receive Food Stamps/SNAP in the past 12 months: 11,106
Women who had a birth in the past 12 months: 210 (161 now married, 50 unmarried) Women who did not have a birth in the past 12 months: 8,441 (4,189 now married, 4,237 unmarried)
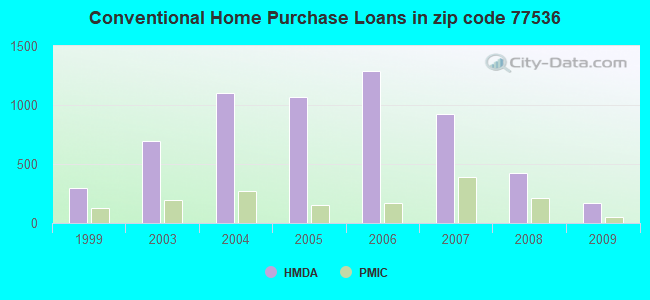
Housing units in zip code 77536 with a mortgage: 5,605 (238 second mortgage, 206 both second mortgage and home equity loan) Houses without a mortgage: 104
Median monthly owner costs for units with a mortgage: $1,888 Median monthly owner costs for units without a mortgage: $671
Residents with income below the poverty level in 2022:
This zip code:
6.6%
Whole state:
14.0%
Residents with income below 50% of the poverty level in 2022:
This zip code:
4.0%
Whole state:
7.4%
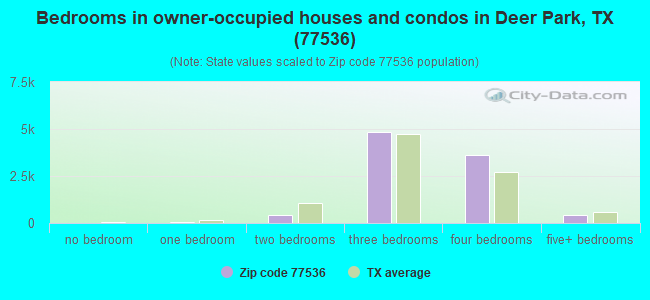
Median number of rooms in houses and condos:
Here:
6.4
State:
6.3
Median number of rooms in apartments:
Here:
4.2
State:
4.0
Notable locations in this zip code not listed on our city pages
Notable locations in zip code 77536: Deer Park Volunteer Fire Department (A), Deer Park Police Department - Investigation (B), City of Deer Park Fire Department (C), Deer Park Volunteer Fire Department / Ambulance Service Station 2 (D). Display/hide their locations on the map
Churches in zip code 77536 include: Central Baptist Churches (A), First Baptist Church of Deer Park (B), Glenwood Baptist Church (C), San Jacinto Church (D), Center Street Baptist Church (E), Deer Park Assembly of God Church (F), Deer Park United Methodist Church (G), Faithbridge Church (H), Saint Hyacinth Catholic Church (I). Display/hide their locations on the map
In group quarters: 157 (-1 institutionalized population)
Size of family households: 3,384 2-persons, 2,088 3-persons, 2,045 4-persons, 1,085 5-persons, 320 6-persons, 152 7-or-more-persons
Size of nonfamily households: 2,497 1-person, 255 2-persons, 29 3-persons
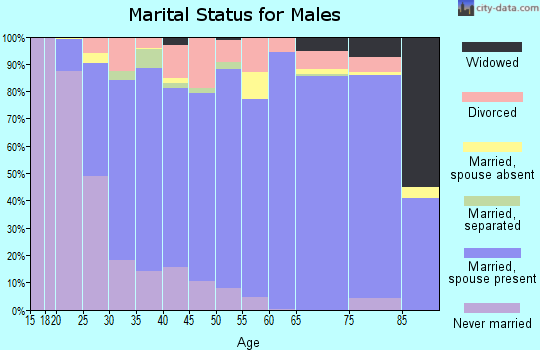
5,216 married couples with children.
1,173 single-parent households (341 men, 832 women).
79.6% of residents of 77536 zip code speak English at home.
19.3% of residents speak Spanish at home (67% very well, 13% well, 14% not well, 6% not at all).
0.5% of residents speak other Indo-European language at home (81% very well, 14% well, 6% not well).
0.4% of residents speak Asian or Pacific Island language at home (52% very well, 22% well, 26% not well).
0.1% of residents speak other language at home (100% well).
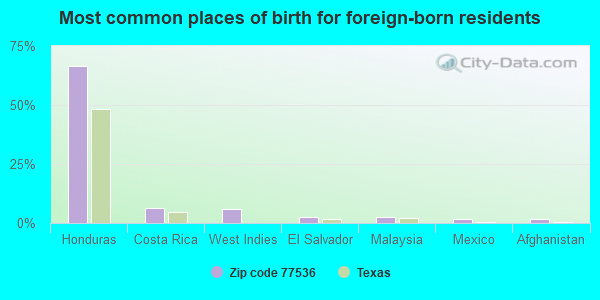
Foreign born population: 3,363 (9.9%) (43.2% of them are naturalized citizens)
This zip code:
9.9%
Whole state:
17.2%
66%Honduras
6%Costa Rica
6%West Indies
3%El Salvador
2%Malaysia
2%Mexico
2%Afghanistan
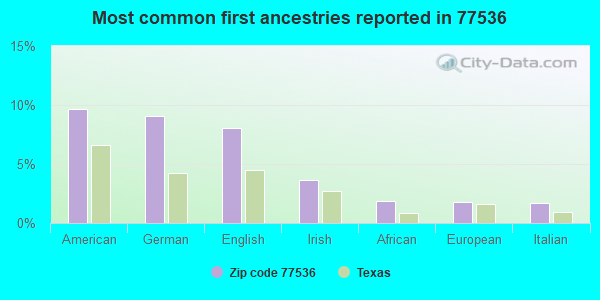
10%American
9%German
8%English
4%Irish
2%African
2%European
2%Italian
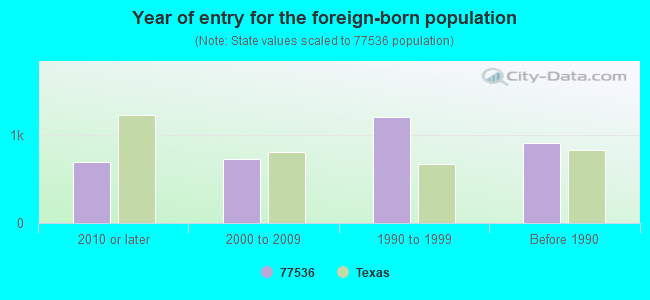
Year of entry for the foreign-born population
6942010 or later
7292000 to 2009
1,2051990 to 1999
908Before 1990
Facilities with environmental interests located in this zip code:
AKZO NOBEL CHEMICALS INCORPORATED (730 BATTLEGROUND RD. in DEER PARK, TX)
AIR MAJOR (AIRS/AFS) (Integrated Compliance Information System) - ICIS-06-1987-0510, FORMAL ENFORCEMENT ACTION, ICIS-06-1981-0019, National Pollutant Discharge Elimination System NON-MAJOR (Tracking pollutant discharge elimination systems) - permit HAZARDOUS WASTE BIENNIAL REPORTER (Resource Conservation and Recovery Act (tracking hazardous waste)) Large Quantity Generators, more that 1000 kg of hazardous waste/month (Resource Conservation and Recovery Act (tracking hazardous waste)) - notification TSD (Resource Conservation and Recovery Act (tracking hazardous waste)) - notification TRI REPORTER (Tracking of toxic chemicals releasing facilities) Business SIC classification: INDUSTRIAL INORGANIC CHEMICALS; INDUSTRIAL ORGANIC CHEMICALS Business NAICS classification: ALL OTHER BASIC ORGANIC CHEMICAL MANUFACTURING. Organizations: AKZO NOBEL POLYMER CHEMICALS LLC (CONTACT/OPERATOR)
, AKZO NOBEL CHEMICALS INC. AND (CONTACT/OWNER)
Alternative names: AKZO NOBEL POLYMER CHEMICALS L.L.C.
ATOFINA PETROCHEMICALS INCORPORATED (1818 BATTLEGROUND ROAD in DEER PARK, TX)
(Integrated Compliance Information System) - ICIS-06-1996-0510, FORMAL ENFORCEMENT ACTION CRITERIA AND HAZARDOUS AIR POLLUTANT INVENTORY (Inventory of air pollution sources) National Pollutant Discharge Elimination System MAJOR (Tracking pollutant discharge elimination systems) - permit HAZARDOUS WASTE BIENNIAL REPORTER (Resource Conservation and Recovery Act (tracking hazardous waste)) Large Quantity Generators, more that 1000 kg of hazardous waste/month (Resource Conservation and Recovery Act (tracking hazardous waste)) - notification TSD (Resource Conservation and Recovery Act (tracking hazardous waste)) - notification TRI REPORTER (Tracking of toxic chemicals releasing facilities) Business SIC classification: PLASTICS MATERIALS, SYNTHETIC RESINS, AND NONVULCANIZABLE ELASTOMERS; INDUSTRIAL ORGANIC CHEMICALS Business NAICS classification: PLASTICS MATERIAL AND RESIN MANUFACTURING.; PLASTICS MATERIAL AND RESIN MANUFACTURING. Organizations: TOTAL PETROCHEMICALS USA INC (CONTACT/OPERATOR)
Alternative names: FINA OIL & CHEMICAL CO, FINA OIL & CHEMICAL CO. LA PORTE PLANT, TOTAL PETROCHEMICALS USA INC
AQUA SOLUTIONS INCORPORATED (6913 B HIGHWAY 225 in DEER PARK, TX)
(Integrated Compliance Information System) - ICIS-06-1999-0572, FORMAL ENFORCEMENT ACTION COMPLIANCE ACTIVITY (Tracking inspections of insecticide, fungicide, and rodenticide, and toxic substances) Small Quantity Generators, between 100 kg and 1000 kg of hazardous waste/month (Resource Conservation and Recovery Act (tracking hazardous waste)) Business SIC classification: CHEMICALS AND CHEMICAL PREPARATIONS Business NAICS classification: ALL OTHER MISCELLANEOUS CHEMICAL PRODUCT AND PREPARATION MANUFACTURING. Organizations: THOMAS C BEDRORD (CONTACT/OPERATOR)
A L TAWAKOL INC (8109 SPENCER HWY in DEER PARK, TX)
(Resource Conservation and Recovery Act (tracking hazardous waste)) Alternative names: MOBIL OIL CORP SS# MDM
AIR LIQUIDE AMERICA LP (2300 TIDAL RD in DEER PARK, TX)
(Resource Conservation and Recovery Act (tracking hazardous waste)) Alternative names: DEER PARK HYDROGEN PLANT
BAKER PETROLITE CORPORATION (101 CENTER ST in DEER PARK, TX)
(Resource Conservation and Recovery Act (tracking hazardous waste)) Alternative names: BAKER PETROLITE DEER PARK
847 DEER PARK CITY GATE (480 W 13TH ST in DEER PARK, TX)
HAZARDOUS WASTE BIENNIAL REPORTER (Resource Conservation and Recovery Act (tracking hazardous waste)) Large Quantity Generators, more that 1000 kg of hazardous waste/month (Resource Conservation and Recovery Act (tracking hazardous waste)) Business NAICS classification: SUPPORT ACTIVITIES FOR OIL AND GAS OPERATIONS.
AIR LIQUIDE AMERICA CORP. (2300 TIDAL ROAD in DEER PARK, TX)
National Pollutant Discharge Elimination System NON-MAJOR (Tracking pollutant discharge elimination systems) - permit Business SIC classification: INDUSTRIAL GASES Organizations: AIR LIQUIDE LARGE INSUTRIES US (CONTACT/OWNER)
Housing units lacking complete plumbing facilities: 0.7% Housing units lacking complete kitchen facilities: 0.6%
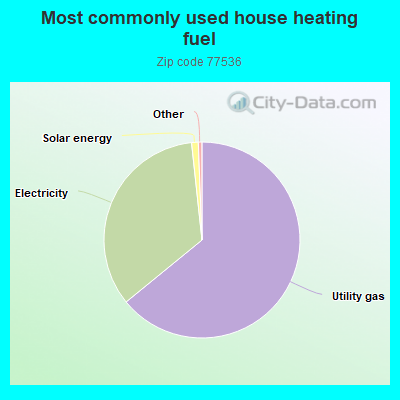
64.1%Utility gas
34.2%Electricity
1.1%Solar energy
Population in 1990: 25,806. Population change in the 1990s: +2,829 (+11.0%).
Place of birth for U.S.-born residents:
This state: 23,720
Northeast: 541
Midwest: 1,853
South: 3,025
West: 1,034
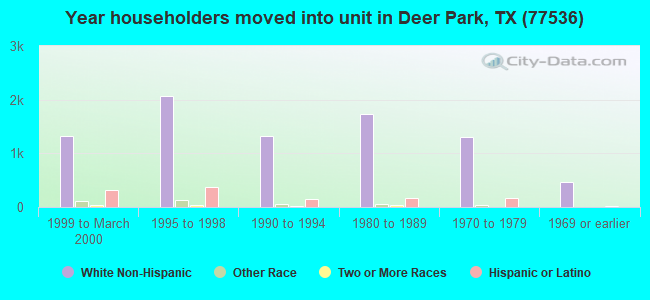
59% of the 77536 zip code residents lived in the same house 5 years ago. Out of people who lived in different houses, 80% lived in this county. Out of people who lived in different counties, 50% lived in Texas.
92% of the 77536 zip code residents lived in the same house 1 year ago. Out of people who lived in different houses, 53% moved from this county. Out of people who lived in different houses, 29% moved from different county within same state. Out of people who lived in different houses, 15% moved from different state. Out of people who lived in different houses, 4% moved from abroad.
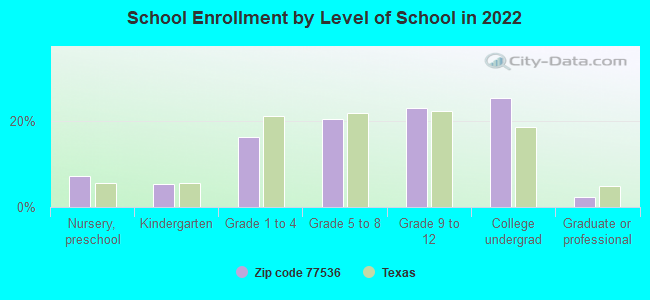
Private vs. public school enrollment:
Students in private schools in grades 1 to 8 (elementary and middle school): 84
Here:
2.5%
Texas:
8.8%
Students in private schools in grades 9 to 12 (high school): 144
Here:
6.8%
Texas:
8.0%
Students in private undergraduate colleges: 231
Here:
9.8%
Texas:
16.2%
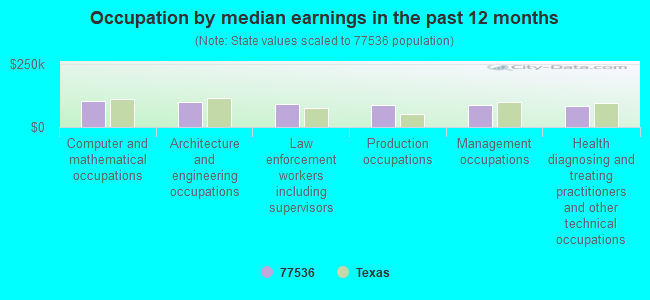
Occupation by median earnings in the past 12 months ($)
101,723Computer and mathematical occupations
100,301Architecture and engineering occupations
92,327Law enforcement workers including supervisors
86,374Production occupations
85,833Management occupations
81,512Health diagnosing and treating practitioners and other technical occupations
Companies with biggest federal contracts located in this zip code (DEER PARK, TX):
GNI GROUP INC (2525 BATTLEGROUND RD) : $2,884,040 in 29 contractsfrom 2000 to 2001
Contracts for Hazardous Substance Removal, Cleanup, and Disposal Services and Operational Support by Defense Logistics Agency Signed by year:2000: $1,790,602; 2001: $1,093,438; 2002: $0; 2003: $0; 2004: $0; 2005: $0; 2006: $0.
Biggest contracts:
$288,375 with Defense Logistics Agency for Hazardous Substance Removal, Cleanup, and Disposal Services and Operational Support. Taking place in WI. Signed on 2000-09-19. Completion date: 2000-09-19.
$281,690, same as above.Signed on 2000-10-20. Completion date: 2000-12-20.
$281,690, same as above.Signed on 2000-12-20. Completion date: 2001-01-20.
$281,690, same as above.Signed on 2001-07-29. Completion date: 2001-08-29.
MCCARTER MACHINE INC (1312 UNDERWOOD RD; small business) : $977,022 in 4 contractsfrom 2004 to 2006
$748,695 with Missile Defense Agency for Defense Missile and Space Systems -- Basic Research (R&D). Signed on 2006-04-27. Completion date: 2008-04-28.
$118,893 with Army for Defense Missile and Space Systems -- Advanced Development (R&D). Signed on 2005-02-16. Completion date: 2005-07-23.
$99,430 with Missile Defense Agency for Defense Missile and Space Systems -- Basic Research (R&D). Signed on 2006-04-07. Completion date: 2006-10-07.
$10,004 with NASA for . Signed on 2004-02-20. Completion date: 2004-04-02.
GNI GROUP INC (2525 BATTLEGROUND RD) : $754,573 in 10 contractsin 2000
Contracts for Hazardous Substance Removal, Cleanup, and Disposal Services and Operational Support by Defense Logistics Agency Signed by year:2000: $754,573; 2001: $0; 2002: $0; 2003: $0; 2004: $0; 2005: $0; 2006: $0.
Biggest contracts:
$290,475 with Defense Logistics Agency for Hazardous Substance Removal, Cleanup, and Disposal Services and Operational Support. Taking place in WI. Signed on 2000-08-17. Completion date: 2000-08-17.
$288,375, same as above.Signed on 2000-05-19. Completion date: 2000-05-19.
$288,375, same as above.Signed on 2000-07-20. Completion date: 2000-07-20.
$288,375, same as above.Signed on 2000-06-19. Completion date: 2000-07-19.
HYDROCHEM INDUSTRIAL SERVICES (900 GEORGIA AVE) : $175,121 in 5 contractsfrom 2001 to 2005
Contracts for Maintenance, Repair and Rebuilding of Equipment -- Bearings, Commercial and Industrial Gas Cylinders, Hazardous Substance Removal, Cleanup, and Disposal Services and Operational Support, Aircraft Landing Equipment by Navy, United States Coast Guard (disused code: now 7008) Signed by year:2000: $0; 2001: $33,000; 2002: $74,625; 2003: $0; 2004: $60,000; 2005: $7,496; 2006: $0.
Biggest contracts:
$74,625 with Navy for Maintenance, Repair and Rebuilding of Equipment -- Bearings. Taking place in CA. Signed on 2002-04-04. Completion date: 2002-06-02.
$60,000 with Navy for Commercial and Industrial Gas Cylinders. Taking place in VA. Signed on 2004-05-26. Completion date: 2004-08-06.
$33,000 with United States Coast Guard (disused code: now 7008) for Hazardous Substance Removal, Cleanup, and Disposal Services and Operational Support. Taking place in MD. Signed on 2001-05-15. Completion date: 2001-05-15.
$8,850 with Navy for Aircraft Landing Equipment. Signed on 2005-03-03. Completion date: 2005-03-04.
HERMETIC INC (4522 CENTER ST; small business) 500 employees, $0 revenue: $49,310 in 3 contractsin 2005
$17,760 with Navy for Liquid and Gas Flow, Liquid Level, and Mechanical Motion Measuring Instruments. Signed on 2005-01-04. Completion date: 2005-01-21.
$16,350 with Navy for Non-nuclear Ship Repair (West) Ship repair (including overhauls and conversions) performed on. non-nuclear propelled and nonpropelled ships west of the 108th meridian. Signed on 2005-03-11. Completion date: 2005-03-19.
$15,200 with Navy for Non-nuclear Ship Repair (West) Ship repair (including overhauls and conversions) performed on. non-nuclear propelled and nonpropelled ships west of the 108th meridian. Taking place in CA. Signed on 2005-01-20. Completion date: 2005-01-21.
FAB SHOP & EQUIPMENT INC (1218 WILDWOOD DR; small business)
$48,000 with Defense Logistics Agency for Miscellaneous Materials Handling Equipment. Signed on 2002-09-18. Completion date: 2002-12-30.
ELECTRONIC SAFETY OF HOUSTON (2323 CENTER ST; small business)
$40,106 with Navy for Liquid and Gas Flow, Liquid Level, and Mechanical Motion Measuring Instruments. Taking place in VA. Signed on 2004-12-23. Completion date: 2005-01-04.
FLEXITALLIC LP (6915 HIGHWAY 225) : $11,740 in 4 contractsfrom 2004 to 2005
$6,957 with Navy for Miscellaneous Fabricated Nonmetallic Materials. Signed on 2004-09-23. Completion date: 2004-09-17.
$4,604 with Navy for Packing and Gasket Materials. Signed on 2005-04-20. Completion date: 2005-10-17.
$95, same as above.Signed on 2005-07-19. Completion date: 2005-08-03.
$84, same as above.Signed on 2005-08-23. Completion date: 2005-09-08.
TEPSCO L P (1820 MILLER CUTOFF RD)
$10,000 with NASA for Maintenance, Repair or Alteration of Real Property -- Other Utilities. Signed on 2001-03-15. Completion date: 2007-06-15.
DOOLEY TACKABERRY INC (1515 W 13TH ST; small business) : $8,422 in 2 contractsfrom 2003 to 2005
$5,580 with Air Force for Miscellaneous Fire Control Equipment. Signed on 2005-07-28. Completion date: 2005-08-29.
$2,842 with Army for Miscellaneous Fire Control Equipment. Signed on 2003-03-13. Completion date: 2003-05-09.
Top industries in this zip code by the number of employees in 2005:
Construction: Oil and Gas Pipeline and Related Structures Construction (over 1000 employees: 1 establishment, 500-999 employees: 2 establishments, 10-19 employees: 1 establishment, 5-9 employees: 1 establishment)
Management of Companies and Enterprises: Corporate, Subsidiary, and Regional Managing Offices (500-999: 1, 50-99: 1)
2004 - 2018 National Fire Incident Reporting System (NFIRS) incidents
Based on the data from the years 2004 - 2018 the average number of fires per year is 59. The highest number of fires - 101 took place in 2011, and the least - 15 in 2004. The data has a rising trend.
When looking into fire subcategories, the most reports belonged to: Outside Fires (35.4%), and Structure Fires (28.9%).
Fire incident types reported to NFIRS in Zip Code 77536


 Nearest zip codes: 77503, 77505, 77571, 77506, 77502, 77015.


 Based on the data from the years 2004 - 2018 the average number of fires per year is 59. The highest number of fires - 101 took place in 2011, and the least - 15 in 2004. The data has a rising trend.
 When looking into fire subcategories, the most reports belonged to: Outside Fires (35.4%), and Structure Fires (28.9%).