Estimated zip code population in 2022: 27,351 Zip code population in 2010: 23,059 Zip code population in 2000: 19,650
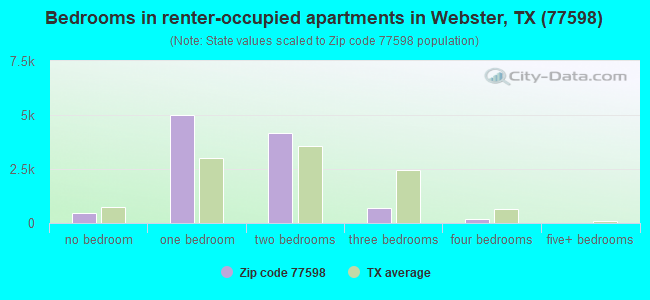
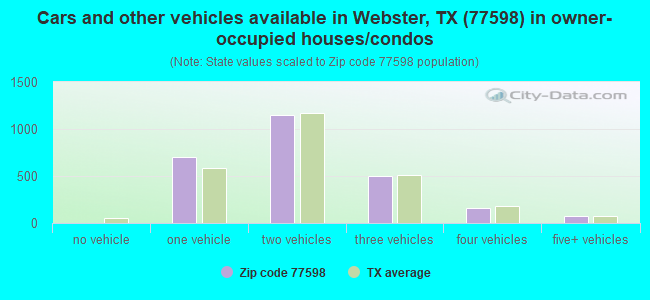
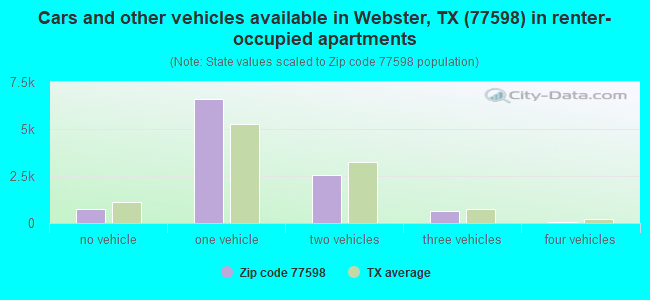
Houses and condos: 14,021 Renter-occupied apartments: 10,556
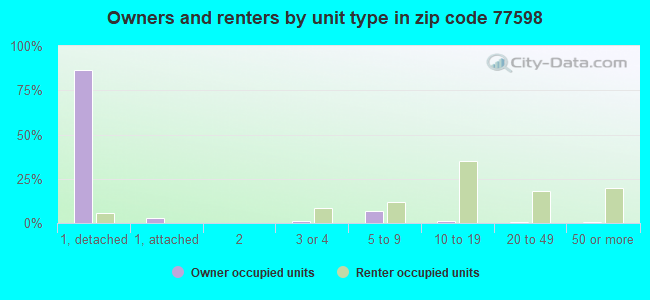
% of renters here:
80%
State:
38%
March 2022 cost of living index in zip code 77598: 97.0 (near average, U.S. average is 100)
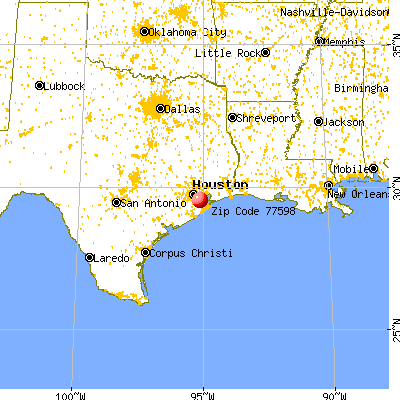
Land area: 12.1 sq. mi. Water area: 0.2 sq. mi.
Population density: 2,259 people per square mile
(low).
OSM Map
General Map
Google Map
MSN Map
OSM Map
General Map
Google Map
MSN Map
OSM Map
General Map
Google Map
MSN Map
OSM Map
General Map
Google Map
MSN Map
Please wait while loading the map...
Real estate property taxes paid for housing units in 2022:
This zip code:
1.5% ($3,501)
Texas:
1.5% ($4,050)
Median real estate property taxes paid for housing units with mortgages in 2022: $3,548 (1.5%) Median real estate property taxes paid for housing units with no mortgage in 2022: $3,394 (1.4%)
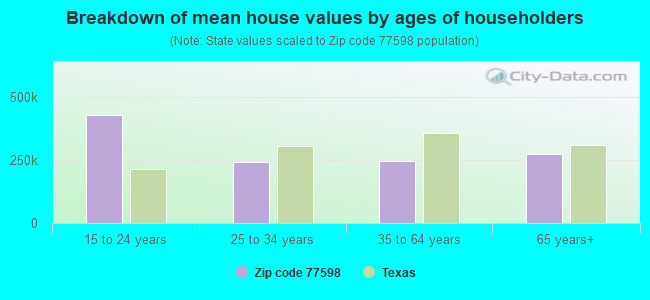
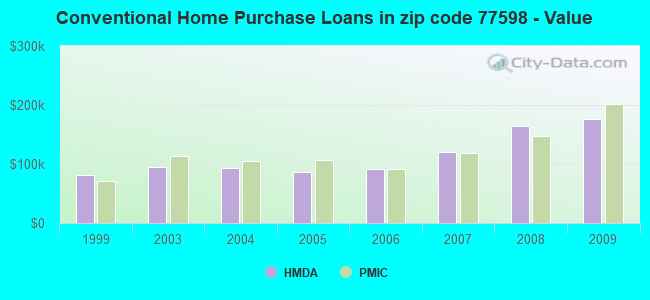
Estimated median house/condo value in 2022: $240,454
77598:
$240,454
Texas:
$275,400
According to our research of Texas and other state lists, there were 24 registered sex offenders living in 77598 zip code as of April 27, 2024. The ratio of all residents to sex offenders in zip code 77598 is 1,027 to 1. The ratio of registered sex offenders to all residents in this zip code is lower than the state average.
Median resident age:
This zip code:
34.9 years
Texas median age:
35.6 years
Average household size:
This zip code:
2.1 people
Texas:
2.6 people
Averages for the 2020 tax year for zip code 77598, filed in 2021:
Average Adjusted Gross Income (AGI) in 2020: $50,571 (Individual Income Tax Returns)
Here:
$50,571
State:
$77,054
Salary/wage: $46,646 (reported on 87.3% of returns)
Here:
$46,646
State:
$62,766
(% of AGI for various income ranges: 1266.8% for AGIs below $25k, 3668.5% for AGIs $25k-50k, 6586.8% for AGIs $50k-75k, 10053.4% for AGIs $75k-100k, 18174.5% for AGIs $100k-200k, 68008.9% for AGIs over 200k)
Taxable interest for individuals: $1,153 (reported on 14.4% of returns)
This zip code:
$1,153
Texas:
$2,665
(% of AGI for various income ranges: 4.8% for AGIs below $25k, 7.6% for AGIs $25k-50k, 15.1% for AGIs $50k-75k, 40.5% for AGIs $75k-100k, 84.4% for AGIs $100k-200k, 665.6% for AGIs over 200k)
Ordinary dividends: $4,285 (reported on 9.2% of returns)
Here:
$4,285
State:
$10,044
(% of AGI for various income ranges: 7.7% for AGIs below $25k, 11.6% for AGIs $25k-50k, 33.5% for AGIs $50k-75k, 66.7% for AGIs $75k-100k, 287.5% for AGIs $100k-200k, 1663.3% for AGIs over 200k)
Net capital gain/loss in AGI: +$9,571 (reported on 9.3% of returns)
Here:
+$9,571
State:
+$39,590
(% of AGI for various income ranges: 1.4% for AGIs below $25k, 10.2% for AGIs $25k-50k, 40.0% for AGIs $50k-75k, 112.1% for AGIs $75k-100k, 625.3% for AGIs $100k-200k, 5870.0% for AGIs over 200k)
Profit/loss from business: +$3,764 (reported on 17.5% of returns)
Here:
+$3,764
State:
+$10,888
(% of AGI for various income ranges: 69.7% for AGIs below $25k, 21.8% for AGIs $25k-50k, 57.1% for AGIs $50k-75k, 95.1% for AGIs $75k-100k, 392.0% for AGIs $100k-200k, 1123.3% for AGIs over 200k)
Taxable individual retirement arrangement distribution: $19,938 (reported on 4.7% of returns)
77598:
$19,938
Texas:
$24,740
(% of AGI for various income ranges: 23.3% for AGIs below $25k, 40.3% for AGIs $25k-50k, 134.6% for AGIs $50k-75k, 274.8% for AGIs $75k-100k, 634.9% for AGIs $100k-200k, 2038.9% for AGIs over 200k)
Total itemized deductions: $31,165 (reported on 4.6% of returns)
Here:
$31,165
State:
$40,428
(% of AGI for various income ranges: 23.2% for AGIs below $25k, 88.6% for AGIs $25k-50k, 209.7% for AGIs $50k-75k, 397.5% for AGIs $75k-100k, 877.6% for AGIs $100k-200k, 3390.0% for AGIs over 200k)
Charity contributions: $11,285 (reported on 3.4% of returns)
Here:
$11,285
State:
$18,201
(% of AGI for various income ranges: 2.1% for AGIs below $25k, 19.1% for AGIs $25k-50k, 35.9% for AGIs $50k-75k, 64.4% for AGIs $75k-100k, 302.9% for AGIs $100k-200k, 1296.7% for AGIs over 200k)
Taxes paid: $6,447 (reported on 4.2% of returns)
77598:
$6,447
State:
$7,821
(% of AGI for various income ranges: 4.5% for AGIs below $25k, 14.6% for AGIs $25k-50k, 37.5% for AGIs $50k-75k, 70.7% for AGIs $75k-100k, 175.8% for AGIs $100k-200k, 688.9% for AGIs over 200k)
Earned income credit: $2,403 (reported on 20.9% of returns)
Here:
$2,403
State:
$2,584
(% of AGI for various income ranges: 109.0% for AGIs below $25k, 66.6% for AGIs $25k-50k, 0.8% for AGIs $50k-75k)
Percentage of individuals using paid preparers for their 2020 taxes: 92.4%
Here:
92%
State:
92%
(% for various income ranges: 91.6% for AGIs below $25k, 93.7% for AGIs $25k-50k, 93.3% for AGIs $50k-75k, 91.8% for AGIs $75k-100k, 90.3% for AGIs $100k-200k, 90.5% for AGIs over 200k)
Averages for the 2012 tax year for zip code 77598, filed in 2013:
Average Adjusted Gross Income (AGI) in 2012: $43,080 (Individual Income Tax Returns)
Here:
$43,080
State:
$65,384
Salary/wage: $40,751 (reported on 91.3% of returns)
Here:
$40,751
State:
$52,524
(% of AGI for various income ranges: 86.1% for AGIs below $25k, 91.5% for AGIs $25k-50k, 89.4% for AGIs $50k-75k, 87.1% for AGIs $75k-100k, 84.1% for AGIs $100k-200k, 68.1% for AGIs over 200k)
Taxable interest for individuals: $772 (reported on 17.3% of returns)
This zip code:
$772
Texas:
$2,372
(% of AGI for various income ranges: 0.5% for AGIs below $25k, 0.2% for AGIs $25k-50k, 0.3% for AGIs $50k-75k, 0.3% for AGIs $75k-100k, 0.3% for AGIs $100k-200k, 0.5% for AGIs over 200k)
Ordinary dividends: $4,101 (reported on 9.1% of returns)
Here:
$4,101
State:
$9,721
(% of AGI for various income ranges: 0.8% for AGIs below $25k, 0.4% for AGIs $25k-50k, 0.4% for AGIs $50k-75k, 0.6% for AGIs $75k-100k, 1.1% for AGIs $100k-200k, 3.0% for AGIs over 200k)
Net capital gain/loss in AGI: +$2,103 (reported on 6.7% of returns)
Here:
+$2,103
State:
+$35,319
(% of AGI for various income ranges: 0.1% for AGIs $25k-50k, 0.2% for AGIs $50k-75k, 0.5% for AGIs $75k-100k, 0.6% for AGIs $100k-200k, 1.0% for AGIs over 200k)
Profit/loss from business: +$7,715 (reported on 13.1% of returns)
Here:
+$7,715
State:
+$13,732
(% of AGI for various income ranges: 6.4% for AGIs below $25k, 1.4% for AGIs $25k-50k, 0.9% for AGIs $50k-75k, 1.6% for AGIs $75k-100k, 2.0% for AGIs $100k-200k, 4.2% for AGIs over 200k)
Taxable individual retirement arrangement distribution: $15,134 (reported on 5.2% of returns)
77598:
$15,134
Texas:
$19,511
(% of AGI for various income ranges: 0.9% for AGIs below $25k, 1.0% for AGIs $25k-50k, 1.6% for AGIs $50k-75k, 2.3% for AGIs $75k-100k, 4.0% for AGIs $100k-200k)
Total itemized deductions: $17,736 (21% of AGI, reported on 14.9% of returns)
Here:
$17,736
State:
$24,724
Here:
20.9% of AGI
State:
15.9% of AGI
(% of AGI for various income ranges: 3.3% for AGIs below $25k, 5.2% for AGIs $25k-50k, 6.4% for AGIs $50k-75k, 7.5% for AGIs $75k-100k, 7.7% for AGIs $100k-200k, 6.6% for AGIs over 200k)
Charity contributions: $4,133 (reported on 11.1% of returns)
Here:
$4,133
State:
$6,808
(% of AGI for various income ranges: 0.3% for AGIs below $25k, 0.7% for AGIs $25k-50k, 0.9% for AGIs $50k-75k, 1.5% for AGIs $75k-100k, 1.7% for AGIs $100k-200k, 1.6% for AGIs over 200k)
Taxes paid: $4,056 (reported on 14.1% of returns)
77598:
$4,056
State:
$6,921
(% of AGI for various income ranges: 0.7% for AGIs below $25k, 0.8% for AGIs $25k-50k, 1.2% for AGIs $50k-75k, 1.5% for AGIs $75k-100k, 2.1% for AGIs $100k-200k, 2.1% for AGIs over 200k)
Earned income credit: $2,217 (reported on 22.3% of returns)
Here:
$2,217
State:
$2,570
(% of AGI for various income ranges: 6.9% for AGIs below $25k, 1.0% for AGIs $25k-50k)
Percentage of individuals using paid preparers for their 2012 taxes: 43.2%
Here:
43%
State:
51%
(% for various income ranges: 43.3% for AGIs below $25k, 41.4% for AGIs $25k-50k, 43.0% for AGIs $50k-75k, 45.2% for AGIs $75k-100k, 45.2% for AGIs $100k-200k, 63.6% for AGIs over 200k)
Averages for the 2004 tax year for zip code 77598, filed in 2005:
Average Adjusted Gross Income (AGI) in 2004: $37,059 (Individual Income Tax Returns)
Here:
$37,059
State:
$47,881
Salary/wage: $36,051 (reported on 91.5% of returns)
Here:
$36,051
State:
$41,947
(% of AGI for various income ranges: 104.5% for AGIs below $10k, 90.4% for AGIs $10k-25k, 93.1% for AGIs $25k-50k, 90.5% for AGIs $50k-75k, 91.1% for AGIs $75k-100k, 75.5% for AGIs over 100k)
Taxable interest for individuals: $937 (reported on 27.8% of returns)
This zip code:
$937
Texas:
$2,255
(% of AGI for various income ranges: 1.8% for AGIs below $10k, 0.9% for AGIs $10k-25k, 0.5% for AGIs $25k-50k, 0.6% for AGIs $50k-75k, 0.8% for AGIs $75k-100k, 0.7% for AGIs over 100k)
Taxable dividends: $1,765 (reported on 12.5% of returns)
Here:
$1,765
State:
$4,261
(% of AGI for various income ranges: 2.2% for AGIs below $10k, 0.4% for AGIs $10k-25k, 0.5% for AGIs $25k-50k, 0.5% for AGIs $50k-75k, 0.7% for AGIs $75k-100k, 0.8% for AGIs over 100k)
Net capital gain/loss: +$3,706 (reported on 10.1% of returns)
Here:
+$3,706
State:
+$16,110
(% of AGI for various income ranges: -0.9% for AGIs below $10k, -0.2% for AGIs $10k-25k, 0.2% for AGIs $25k-50k, 0.2% for AGIs $50k-75k, 0.5% for AGIs $75k-100k, 5.0% for AGIs over 100k)
Profit/loss from business: +$4,533 (reported on 12.4% of returns)
Here:
+$4,533
State:
+$11,013
(% of AGI for various income ranges: 7.6% for AGIs below $10k, 3.4% for AGIs $10k-25k, 1.1% for AGIs $25k-50k, 0.9% for AGIs $50k-75k, 0.4% for AGIs $75k-100k, 1.9% for AGIs over 100k)
IRA payment deduction: $2,794 (reported on 1.2% of returns)
77598:
$2,794
Texas:
$3,120
(% of AGI for various income ranges: 0.1% for AGIs $10k-25k, 0.1% for AGIs $25k-50k, 0.0% for AGIs $50k-75k, 0.1% for AGIs $75k-100k, 0.1% for AGIs over 100k)
Self-employed pension: $11,417 (reported on 0.1% of returns)
Here:
$11,417
Texas:
$16,401
Total itemized deductions: $13,991 (21% of AGI, reported on 18.0% of returns)
Here:
$13,991
State:
$19,631
Here:
20.7% of AGI
State:
18.9% of AGI
(% of AGI for various income ranges: 3.1% for AGIs below $10k, 3.5% for AGIs $10k-25k, 6.3% for AGIs $25k-50k, 7.6% for AGIs $50k-75k, 8.3% for AGIs $75k-100k, 8.0% for AGIs over 100k)
Charity contributions deductions: $3,241 (5% of AGI, reported on 14.2% of returns)
Here:
$3,241
State:
$4,753
Here:
4.6% of AGI
State:
4.2% of AGI
(% of AGI for various income ranges: 0.2% for AGIs below $10k, 0.3% for AGIs $10k-25k, 0.8% for AGIs $25k-50k, 1.2% for AGIs $50k-75k, 1.7% for AGIs $75k-100k, 2.4% for AGIs over 100k)
Total tax: $5,149 (reported on 74.2% of returns)
77598:
$5,149
State:
$9,058
(% of AGI for various income ranges: 3.1% for AGIs below $10k, 3.9% for AGIs $10k-25k, 7.5% for AGIs $25k-50k, 10.8% for AGIs $50k-75k, 12.2% for AGIs $75k-100k, 18.2% for AGIs over 100k)
Earned income credit: $1,775 (reported on 19.5% of returns)
Here:
$1,775
State:
$2,024
Percentage of individuals using paid preparers for their 2004 taxes: 45.6%
Here:
46%
State:
57%
(% for various income ranges: 42.6% for AGIs below $10k, 53.9% for AGIs $10k-25k, 44.2% for AGIs $25k-50k, 40.8% for AGIs $50k-75k, 36.1% for AGIs $75k-100k, 45.3% for AGIs over 100k)
Likely homosexual households (counted as self-reported same-sex unmarried-partner households)
Lesbian couples: 0.1% of all households
Gay men: 0.1% of all households
Household received Food Stamps/SNAP in the past 12 months: 1,578 Household did not receive Food Stamps/SNAP in the past 12 months: 11,572
Women who had a birth in the past 12 months: 479 (351 now married, 128 unmarried) Women who did not have a birth in the past 12 months: 7,143 (2,324 now married, 4,844 unmarried)
Housing units in zip code 77598 with a mortgage: 1,762 (64 second mortgage, 17 home equity loan, 33 both second mortgage and home equity loan) Median monthly owner costs for units with a mortgage: $1,515 Median monthly owner costs for units without a mortgage: $539
Residents with income below the poverty level in 2022:
This zip code:
13.3%
Whole state:
14.0%
Residents with income below 50% of the poverty level in 2022:
This zip code:
9.6%
Whole state:
7.4%
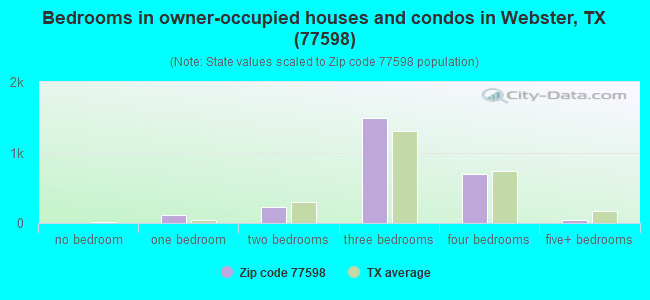
Median number of rooms in houses and condos:
Here:
6.0
State:
6.3
Median number of rooms in apartments:
Here:
3.6
State:
4.0
Notable locations in this zip code not listed on our city pages
Notable locations in zip code 77598: Baybrook Square (A), Webster Central Wastewater Treatment Plant (B), Webster Fire Department Station 1 (C), Clear Lake Emergency Medical Corps (D), Forest Bend Volunteer Fire Department Station 1 (E), Houston Fire Department / Emergency Medical Services Station 93 (F), Webster Police Department (G), Houston Fire Department Station 94 (H). Display/hide their locations on the map
Shopping Centers: NASA Value Center Shopping Center (1), Bay Area Square Shopping Center (2), Baybrook Gateway Center Shopping Center (3), Baybrook Square Shopping Center (4), Bayway Village Shopping Center (5), NASA Center Shopping Center (6), Point NASA Shopping Center (7), Randall Center Shopping Center (8), The Center at Baybrook Shopping Center (9). Display/hide their locations on the map
Churches in zip code 77598 include: Heritage Park Baptist Church (A), Bay Area Presbyterian Church (B), Bay Area Unitarian Universalist Church (C), Saint John the Theologian Greek Orthodox Church (D), Presbyterian Church (E), Bay Forest Baptist Church (F). Display/hide their locations on the map
Parks in zip code 77598 include: Heritage Park (1), Sterling Knoll Park (2), Galveston County Park (3), Challenger 7 Memorial Park (4). Display/hide their locations on the map
In group quarters: 191 (-1 institutionalized population)
Size of family households: 3,006 2-persons, 1,759 3-persons, 1,134 4-persons, 481 5-persons, 118 6-persons, 95 7-or-more-persons
Size of nonfamily households: 5,816 1-person, 781 2-persons, 73 3-persons
1,905 married couples with children.
3,010 single-parent households (470 men, 2,540 women).
65.4% of residents of 77598 zip code speak English at home.
25.6% of residents speak Spanish at home (47% very well, 25% well, 14% not well, 13% not at all).
3.4% of residents speak other Indo-European language at home (51% very well, 36% well, 12% not well, 1% not at all).
4.1% of residents speak Asian or Pacific Island language at home (61% very well, 24% well, 14% not well, 1% not at all).
1.5% of residents speak other language at home (55% very well, 21% well, 22% not well, 3% not at all).
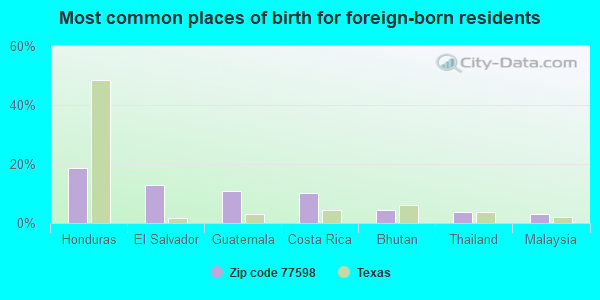
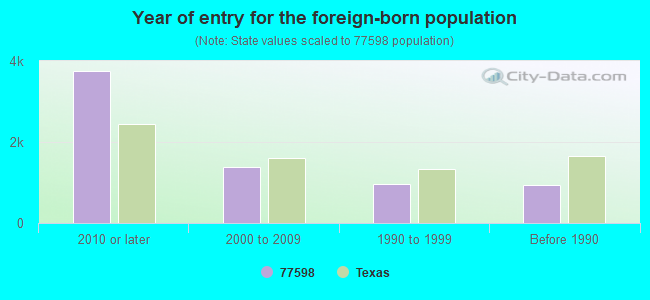
Foreign born population: 5,617 (20.5%) (36.6% of them are naturalized citizens)
Facilities with environmental interests located in this zip code:
AUTO CENTER OF CLEAR LAKE (12722 GALVESTON RD STE J in WEBSTER, TX)
(Resource Conservation and Recovery Act (tracking hazardous waste)) Business NAICS classification: AUTOMOTIVE BODY, PAINT, AND INTERIOR REPAIR AND MAINTENANCE. Organizations: Y & Y PROPERTIES (CONTACT/OPERATOR)
A-1 CLEANERS (400 W BAY AREA BLVD STE E in WEBSTER, TX)
Conditionally Exempt Small Quantity Generators, less than 100 kg/month of hazardous waste (Resource Conservation and Recovery Act (tracking hazardous waste)) Alternative names: A 1 DRYCLEANERS
A-1 DRY CLEANERS (501 1/2 EL DORADO in WEBSTER, TX)
(Resource Conservation and Recovery Act (tracking hazardous waste)) Alternative names: A-1 DRY CLNRS
125 QUALITY CLEANERS (18129 EGRET BAY BLVD in WEBSTER, TX)
Conditionally Exempt Small Quantity Generators, less than 100 kg/month of hazardous waste (Resource Conservation and Recovery Act (tracking hazardous waste)) - notification Organizations: LUCKY BNP INC (CONTACT/OWNER)
ATLAS TRANSMISSION INC (123 W NASA BLVD in WEBSTER, TX)
Small Quantity Generators, between 100 kg and 1000 kg of hazardous waste/month (Resource Conservation and Recovery Act (tracking hazardous waste)) Business NAICS classification: AUTOMOTIVE TRANSMISSION REPAIR. Alternative names: ATLAS TRANSMISSIONS
Housing units lacking complete plumbing facilities: 0.3% Housing units lacking complete kitchen facilities: 0.2%
81.0%Electricity
17.4%Utility gas
1.1%Bottled, tank, or LP gas
Population in 1990: 11,453. Population change in the 1990s: +8,197 (+71.6%).
Place of birth for U.S.-born residents:
This state: 14,788
Northeast: 726
Midwest: 1,679
South: 2,320
West: 1,107
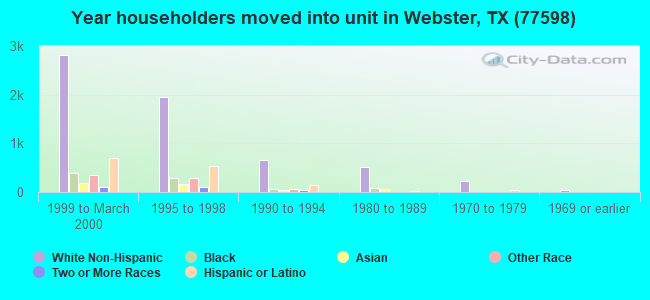
30% of the 77598 zip code residents lived in the same house 5 years ago. Out of people who lived in different houses, 50% lived in this county. Out of people who lived in different counties, 50% lived in Texas.
77% of the 77598 zip code residents lived in the same house 1 year ago. Out of people who lived in different houses, 52% moved from this county. Out of people who lived in different houses, 32% moved from different county within same state. Out of people who lived in different houses, 14% moved from different state. Out of people who lived in different houses, 1% moved from abroad.
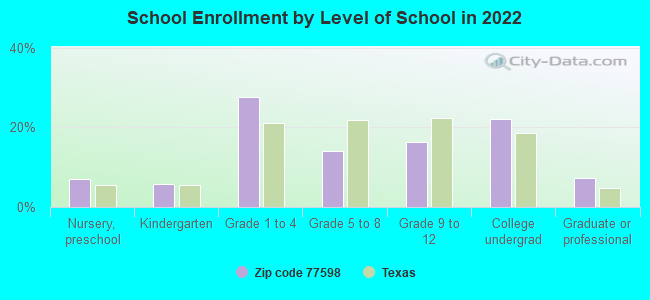
Private vs. public school enrollment:
Students in private schools in grades 1 to 8 (elementary and middle school): 106
Here:
3.9%
Texas:
8.8%
Students in private schools in grades 9 to 12 (high school): 82
Here:
7.7%
Texas:
8.0%
Students in private undergraduate colleges: 198
Here:
13.7%
Texas:
16.2%
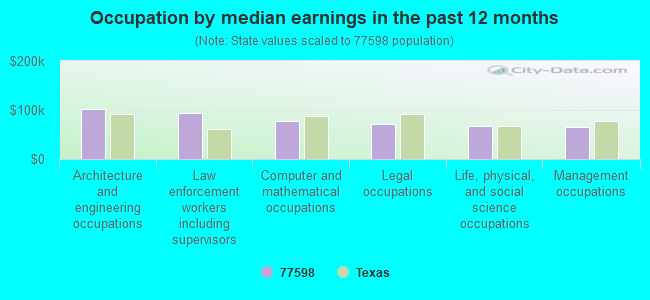
Occupation by median earnings in the past 12 months ($)
101,816Architecture and engineering occupations
94,580Law enforcement workers including supervisors
77,036Computer and mathematical occupations
72,070Legal occupations
66,349Life, physical, and social science occupations
64,635Management occupations
Companies with biggest federal contracts located in this zip code (WEBSTER, TX):
SPACEHAB, INC. (12130 STATE HWY 3) 289 employees, $102773000 revenue: $165,260,596 in 46 contractsfrom 2000 to 2005
Contracts for Space Vehicle Maintenance, Repair, and Checkout Specialized Equipment, Aeronautics and Space Technology -- Applied Research and Exploratory Development (R&D), Engineering and Technical Services, Other Special Studies and Analyses by NASA Signed by year:2000: $78,205,000; 2001: $15,312,000; 2002: $38,636,870; 2003: $30,406,116; 2004: $1,704,005; 2005: $996,605; 2006: $0.
Biggest contracts:
$31,071,000 with NASA for Space Vehicle Maintenance, Repair, and Checkout Specialized Equipment. Taking place in FL. Signed on 2000-12-15. Completion date: 2003-12-15.
$24,300,000, same as above.Signed on 2000-05-15. Completion date: 2003-12-15.
$15,295,000, same as above.Signed on 2001-11-15. Completion date: 2003-12-15.
$10,998,000, same as above.Signed on 2002-04-15. Completion date: 2003-12-15.
ORTECH ENGINEERING INCORPORATE (16250 HIGHWAY 3 STE B6) : $3,926,328 in 3 contractsfrom 2004 to 2005
$3,140,557 with Navy for Physical Sciences -- Basic Research (R&D). Taking place in TN. Signed on 2005-04-08. Completion date: 2005-06-30.
$406,212, same as above.Signed on 2005-01-10. Completion date: 2005-09-30.
$379,559, same as above.Signed on 2004-12-22. Completion date: 2005-02-22.
HEALEY INTERNATIONAL (535 NASA RD 1, SUITE 1024; small business)
$305,058 with Air Force for Gases: Compressed and Liquefied. Signed on 2002-01-10. Completion date: 2003-01-13.
LAKEVIEW HEALTH CARE CENTER (409 W GRN) : $243,679 in 14 contractsfrom 2000 to 2003
Contracts for Nursing Home Care Contracts by Department of Veterans Affairs Signed by year:2000: $43,000; 2001: $113,000; 2002: $74,000; 2003: $13,679; 2004: $0; 2005: $0; 2006: $0.
Biggest contracts:
$40,000 with Department of Veterans Affairs for Nursing Home Care Contracts. Signed on 2001-04-15. Completion date: 2001-06-15.
$30,000, same as above.Signed on 2002-01-15. Completion date: 2002-03-15.
$25,000, same as above.Signed on 2002-04-15. Completion date: 2002-06-15.
$24,000, same as above.Signed on 2001-07-15. Completion date: 2001-09-15.
J A M DISTRIBUTING COMPANY (711 W BAY AREA BLVD STE 31) : $47,304 in 3 contractsfrom 2003 to 2004
$38,130 with Department of Veterans Affairs for Liquid Propellants and Fuels, Petroleum Base. Signed on 2003-03-15. Completion date: 2003-03-15.
$8,460 with Navy for Fuels, Solid. Signed on 2004-10-20. Completion date: 2005-09-30.
$714 with Army for Oils and Greases: Cutting, Lubricating, and Hydraulic. Signed on 2003-10-08. Completion date: 2003-10-24.
CARDIONICS INC (910 BAY STAR BLVD; small business) : $45,861 in 2 contractsfrom 2000 to 2005
$37,126 with Army for Equipment and Materials Testing -- Medical, Dental, and Veterinary Equipment and Supplies. Signed on 2000-09-20. Completion date: 2000-10-20.
$8,735 with Army for Training Aids. Taking place in TN. Signed on 2005-09-14. Completion date: 2005-10-14.
TRIONICS INC (16910 TEXAS AVE STE A8; small business)
$13,363 with Navy for Telephone and Telegraph Equipment. Signed on 2005-09-28. Completion date: 2005-10-27.
PRIME HOSPITALITY CORP (720 W BAY AREA BLVD) : $7,141 in 2 contractsfrom 2003 to 2004
$5,475 with Army for Lodging - Hotel/Motel. Signed on 2003-07-25. Completion date: 2003-07-08.
$1,666, same as above.Signed on 2004-01-26. Completion date: 2003-07-08.
HAMPTON INN & SUITES (506 W BAY AREA BLVD; small business) : $6,424 in 2 contractsin 2003
$8,760 with Army for Lodging - Hotel/Motel. Signed on 2003-07-08. Completion date: 2003-07-02.
-$2,336, same as above.Signed on 2003-09-23. Completion date: 2003-07-02.
SAF-TECH, INC (12440 GALVESTON RD; small business) : $3,828 in 4 contractsfrom 2005 to 2006
$3,500 with Army for Miscellaneous Electrical and Electronic Components. Taking place in OK. Signed on 2005-08-16. Completion date: 2005-12-29.
$1,050, same as above.Signed on 2006-05-23. Completion date: 2005-12-29.
$129, same as above.Signed on 2005-09-14. Completion date: 2005-12-29.
-$851, same as above.Signed on 2005-09-21. Completion date: 2005-12-29.
Top industries in this zip code by the number of employees in 2005:
2002 - 2018 National Fire Incident Reporting System (NFIRS) incidents
Based on the data from the years 2002 - 2018 the average number of fires per year is 56. The highest number of reported fire incidents - 108 took place in 2005, and the least - 3 in 2003. The data has a rising trend.
When looking into fire subcategories, the most incidents belonged to: Structure Fires (48.3%), and Outside Fires (28.0%).
Fire incident types reported to NFIRS in Zip Code 77598


 Nearest zip codes: 77062, 77058, 77573, 77546, 77059, 77034.


 Based on the data from the years 2002 - 2018 the average number of fires per year is 56. The highest number of reported fire incidents - 108 took place in 2005, and the least - 3 in 2003. The data has a rising trend.
 When looking into fire subcategories, the most incidents belonged to: Structure Fires (48.3%), and Outside Fires (28.0%).