Webster, Texas Submit your own pictures of this city and show them to the world
OSM Map
General Map
Google Map
MSN Map
OSM Map
General Map
Google Map
MSN Map
OSM Map
General Map
Google Map
MSN Map
OSM Map
General Map
Google Map
MSN Map
Please wait while loading the map...
Population in 2022: 12,177 (100% urban, 0% rural). Population change since 2000: +34.1%Males: 6,034 Females: 6,143
March 2022 cost of living index in Webster: 97.0 (near average, U.S. average is 100) Percentage of residents living in poverty in 2022: 10.9%for White Non-Hispanic residents , 8.0% for Black residents , 13.1% for Hispanic or Latino residents , 12.3% for other race residents , 14.2% for two or more races residents )
Profiles of local businesses
Business Search - 14 Million verified businesses
Data:
Median household income ($)
Median household income (% change since 2000)
Household income diversity
Ratio of average income to average house value (%)
Ratio of average income to average rent
Median household income ($) - White
Median household income ($) - Black or African American
Median household income ($) - Asian
Median household income ($) - Hispanic or Latino
Median household income ($) - American Indian and Alaska Native
Median household income ($) - Multirace
Median household income ($) - Other Race
Median household income for houses/condos with a mortgage ($)
Median household income for apartments without a mortgage ($)
Races - White alone (%)
Races - White alone (% change since 2000)
Races - Black alone (%)
Races - Black alone (% change since 2000)
Races - American Indian alone (%)
Races - American Indian alone (% change since 2000)
Races - Asian alone (%)
Races - Asian alone (% change since 2000)
Races - Hispanic (%)
Races - Hispanic (% change since 2000)
Races - Native Hawaiian and Other Pacific Islander alone (%)
Races - Native Hawaiian and Other Pacific Islander alone (% change since 2000)
Races - Two or more races (%)
Races - Two or more races (% change since 2000)
Races - Other race alone (%)
Races - Other race alone (% change since 2000)
Racial diversity
Unemployment (%)
Unemployment (% change since 2000)
Unemployment (%) - White
Unemployment (%) - Black or African American
Unemployment (%) - Asian
Unemployment (%) - Hispanic or Latino
Unemployment (%) - American Indian and Alaska Native
Unemployment (%) - Multirace
Unemployment (%) - Other Race
Population density (people per square mile)
Population - Males (%)
Population - Females (%)
Population - Males (%) - White
Population - Males (%) - Black or African American
Population - Males (%) - Asian
Population - Males (%) - Hispanic or Latino
Population - Males (%) - American Indian and Alaska Native
Population - Males (%) - Multirace
Population - Males (%) - Other Race
Population - Females (%) - White
Population - Females (%) - Black or African American
Population - Females (%) - Asian
Population - Females (%) - Hispanic or Latino
Population - Females (%) - American Indian and Alaska Native
Population - Females (%) - Multirace
Population - Females (%) - Other Race
Coronavirus confirmed cases (Apr 27, 2024)
Deaths caused by coronavirus (Apr 27, 2024)
Coronavirus confirmed cases (per 100k population) (Apr 27, 2024)
Deaths caused by coronavirus (per 100k population) (Apr 27, 2024)
Daily increase in number of cases (Apr 27, 2024)
Weekly increase in number of cases (Apr 27, 2024)
Cases doubled (in days) (Apr 27, 2024)
Hospitalized patients (Apr 18, 2022)
Negative test results (Apr 18, 2022)
Total test results (Apr 18, 2022)
COVID Vaccine doses distributed (per 100k population) (Sep 19, 2023)
COVID Vaccine doses administered (per 100k population) (Sep 19, 2023)
COVID Vaccine doses distributed (Sep 19, 2023)
COVID Vaccine doses administered (Sep 19, 2023)
Likely homosexual households (%)
Likely homosexual households (% change since 2000)
Likely homosexual households - Lesbian couples (%)
Likely homosexual households - Lesbian couples (% change since 2000)
Likely homosexual households - Gay men (%)
Likely homosexual households - Gay men (% change since 2000)
Cost of living index
Median gross rent ($)
Median contract rent ($)
Median monthly housing costs ($)
Median house or condo value ($)
Median house or condo value ($ change since 2000)
Mean house or condo value by units in structure - 1, detached ($)
Mean house or condo value by units in structure - 1, attached ($)
Mean house or condo value by units in structure - 2 ($)
Mean house or condo value by units in structure by units in structure - 3 or 4 ($)
Mean house or condo value by units in structure - 5 or more ($)
Mean house or condo value by units in structure - Boat, RV, van, etc. ($)
Mean house or condo value by units in structure - Mobile home ($)
Median house or condo value ($) - White
Median house or condo value ($) - Black or African American
Median house or condo value ($) - Asian
Median house or condo value ($) - Hispanic or Latino
Median house or condo value ($) - American Indian and Alaska Native
Median house or condo value ($) - Multirace
Median house or condo value ($) - Other Race
Median resident age
Resident age diversity
Median resident age - Males
Median resident age - Females
Median resident age - White
Median resident age - Black or African American
Median resident age - Asian
Median resident age - Hispanic or Latino
Median resident age - American Indian and Alaska Native
Median resident age - Multirace
Median resident age - Other Race
Median resident age - Males - White
Median resident age - Males - Black or African American
Median resident age - Males - Asian
Median resident age - Males - Hispanic or Latino
Median resident age - Males - American Indian and Alaska Native
Median resident age - Males - Multirace
Median resident age - Males - Other Race
Median resident age - Females - White
Median resident age - Females - Black or African American
Median resident age - Females - Asian
Median resident age - Females - Hispanic or Latino
Median resident age - Females - American Indian and Alaska Native
Median resident age - Females - Multirace
Median resident age - Females - Other Race
Commute - mean travel time to work (minutes)
Travel time to work - Less than 5 minutes (%)
Travel time to work - Less than 5 minutes (% change since 2000)
Travel time to work - 5 to 9 minutes (%)
Travel time to work - 5 to 9 minutes (% change since 2000)
Travel time to work - 10 to 19 minutes (%)
Travel time to work - 10 to 19 minutes (% change since 2000)
Travel time to work - 20 to 29 minutes (%)
Travel time to work - 20 to 29 minutes (% change since 2000)
Travel time to work - 30 to 39 minutes (%)
Travel time to work - 30 to 39 minutes (% change since 2000)
Travel time to work - 40 to 59 minutes (%)
Travel time to work - 40 to 59 minutes (% change since 2000)
Travel time to work - 60 to 89 minutes (%)
Travel time to work - 60 to 89 minutes (% change since 2000)
Travel time to work - 90 or more minutes (%)
Travel time to work - 90 or more minutes (% change since 2000)
Marital status - Never married (%)
Marital status - Now married (%)
Marital status - Separated (%)
Marital status - Widowed (%)
Marital status - Divorced (%)
Median family income ($)
Median family income (% change since 2000)
Median non-family income ($)
Median non-family income (% change since 2000)
Median per capita income ($)
Median per capita income (% change since 2000)
Median family income ($) - White
Median family income ($) - Black or African American
Median family income ($) - Asian
Median family income ($) - Hispanic or Latino
Median family income ($) - American Indian and Alaska Native
Median family income ($) - Multirace
Median family income ($) - Other Race
Median year house/condo built
Median year apartment built
Year house built - Built 2005 or later (%)
Year house built - Built 2000 to 2004 (%)
Year house built - Built 1990 to 1999 (%)
Year house built - Built 1980 to 1989 (%)
Year house built - Built 1970 to 1979 (%)
Year house built - Built 1960 to 1969 (%)
Year house built - Built 1950 to 1959 (%)
Year house built - Built 1940 to 1949 (%)
Year house built - Built 1939 or earlier (%)
Average household size
Household density (households per square mile)
Average household size - White
Average household size - Black or African American
Average household size - Asian
Average household size - Hispanic or Latino
Average household size - American Indian and Alaska Native
Average household size - Multirace
Average household size - Other Race
Occupied housing units (%)
Vacant housing units (%)
Owner occupied housing units (%)
Renter occupied housing units (%)
Vacancy status - For rent (%)
Vacancy status - For sale only (%)
Vacancy status - Rented or sold, not occupied (%)
Vacancy status - For seasonal, recreational, or occasional use (%)
Vacancy status - For migrant workers (%)
Vacancy status - Other vacant (%)
Residents with income below the poverty level (%)
Residents with income below 50% of the poverty level (%)
Children below poverty level (%)
Poor families by family type - Married-couple family (%)
Poor families by family type - Male, no wife present (%)
Poor families by family type - Female, no husband present (%)
Poverty status for native-born residents (%)
Poverty status for foreign-born residents (%)
Poverty among high school graduates not in families (%)
Poverty among people who did not graduate high school not in families (%)
Residents with income below the poverty level (%) - White
Residents with income below the poverty level (%) - Black or African American
Residents with income below the poverty level (%) - Asian
Residents with income below the poverty level (%) - Hispanic or Latino
Residents with income below the poverty level (%) - American Indian and Alaska Native
Residents with income below the poverty level (%) - Multirace
Residents with income below the poverty level (%) - Other Race
Air pollution - Air Quality Index (AQI)
Air pollution - CO
Air pollution - NO2
Air pollution - SO2
Air pollution - Ozone
Air pollution - PM10
Air pollution - PM25
Air pollution - Pb
Crime - Murders per 100,000 population
Crime - Rapes per 100,000 population
Crime - Robberies per 100,000 population
Crime - Assaults per 100,000 population
Crime - Burglaries per 100,000 population
Crime - Thefts per 100,000 population
Crime - Auto thefts per 100,000 population
Crime - Arson per 100,000 population
Crime - City-data.com crime index
Crime - Violent crime index
Crime - Property crime index
Crime - Murders per 100,000 population (5 year average)
Crime - Rapes per 100,000 population (5 year average)
Crime - Robberies per 100,000 population (5 year average)
Crime - Assaults per 100,000 population (5 year average)
Crime - Burglaries per 100,000 population (5 year average)
Crime - Thefts per 100,000 population (5 year average)
Crime - Auto thefts per 100,000 population (5 year average)
Crime - Arson per 100,000 population (5 year average)
Crime - City-data.com crime index (5 year average)
Crime - Violent crime index (5 year average)
Crime - Property crime index (5 year average)
1996 Presidential Elections Results (%) - Democratic Party (Clinton)
1996 Presidential Elections Results (%) - Republican Party (Dole)
1996 Presidential Elections Results (%) - Other
2000 Presidential Elections Results (%) - Democratic Party (Gore)
2000 Presidential Elections Results (%) - Republican Party (Bush)
2000 Presidential Elections Results (%) - Other
2004 Presidential Elections Results (%) - Democratic Party (Kerry)
2004 Presidential Elections Results (%) - Republican Party (Bush)
2004 Presidential Elections Results (%) - Other
2008 Presidential Elections Results (%) - Democratic Party (Obama)
2008 Presidential Elections Results (%) - Republican Party (McCain)
2008 Presidential Elections Results (%) - Other
2012 Presidential Elections Results (%) - Democratic Party (Obama)
2012 Presidential Elections Results (%) - Republican Party (Romney)
2012 Presidential Elections Results (%) - Other
2016 Presidential Elections Results (%) - Democratic Party (Clinton)
2016 Presidential Elections Results (%) - Republican Party (Trump)
2016 Presidential Elections Results (%) - Other
2020 Presidential Elections Results (%) - Democratic Party (Biden)
2020 Presidential Elections Results (%) - Republican Party (Trump)
2020 Presidential Elections Results (%) - Other
Ancestries Reported - Arab (%)
Ancestries Reported - Czech (%)
Ancestries Reported - Danish (%)
Ancestries Reported - Dutch (%)
Ancestries Reported - English (%)
Ancestries Reported - French (%)
Ancestries Reported - French Canadian (%)
Ancestries Reported - German (%)
Ancestries Reported - Greek (%)
Ancestries Reported - Hungarian (%)
Ancestries Reported - Irish (%)
Ancestries Reported - Italian (%)
Ancestries Reported - Lithuanian (%)
Ancestries Reported - Norwegian (%)
Ancestries Reported - Polish (%)
Ancestries Reported - Portuguese (%)
Ancestries Reported - Russian (%)
Ancestries Reported - Scotch-Irish (%)
Ancestries Reported - Scottish (%)
Ancestries Reported - Slovak (%)
Ancestries Reported - Subsaharan African (%)
Ancestries Reported - Swedish (%)
Ancestries Reported - Swiss (%)
Ancestries Reported - Ukrainian (%)
Ancestries Reported - United States (%)
Ancestries Reported - Welsh (%)
Ancestries Reported - West Indian (%)
Ancestries Reported - Other (%)
Educational Attainment - No schooling completed (%)
Educational Attainment - Less than high school (%)
Educational Attainment - High school or equivalent (%)
Educational Attainment - Less than 1 year of college (%)
Educational Attainment - 1 or more years of college (%)
Educational Attainment - Associate degree (%)
Educational Attainment - Bachelor's degree (%)
Educational Attainment - Master's degree (%)
Educational Attainment - Professional school degree (%)
Educational Attainment - Doctorate degree (%)
School Enrollment - Nursery, preschool (%)
School Enrollment - Kindergarten (%)
School Enrollment - Grade 1 to 4 (%)
School Enrollment - Grade 5 to 8 (%)
School Enrollment - Grade 9 to 12 (%)
School Enrollment - College undergrad (%)
School Enrollment - Graduate or professional (%)
School Enrollment - Not enrolled in school (%)
School enrollment - Public schools (%)
School enrollment - Private schools (%)
School enrollment - Not enrolled (%)
Median number of rooms in houses and condos
Median number of rooms in apartments
Housing units lacking complete plumbing facilities (%)
Housing units lacking complete kitchen facilities (%)
Density of houses
Urban houses (%)
Rural houses (%)
Households with people 60 years and over (%)
Households with people 65 years and over (%)
Households with people 75 years and over (%)
Households with one or more nonrelatives (%)
Households with no nonrelatives (%)
Population in households (%)
Family households (%)
Nonfamily households (%)
Population in families (%)
Family households with own children (%)
Median number of bedrooms in owner occupied houses
Mean number of bedrooms in owner occupied houses
Median number of bedrooms in renter occupied houses
Mean number of bedrooms in renter occupied houses
Median number of vehichles in owner occupied houses
Mean number of vehichles in owner occupied houses
Median number of vehichles in renter occupied houses
Mean number of vehichles in renter occupied houses
Mortgage status - with mortgage (%)
Mortgage status - with second mortgage (%)
Mortgage status - with home equity loan (%)
Mortgage status - with both second mortgage and home equity loan (%)
Mortgage status - without a mortgage (%)
Average family size
Average family size - White
Average family size - Black or African American
Average family size - Asian
Average family size - Hispanic or Latino
Average family size - American Indian and Alaska Native
Average family size - Multirace
Average family size - Other Race
Geographical mobility - Same house 1 year ago (%)
Geographical mobility - Moved within same county (%)
Geographical mobility - Moved from different county within same state (%)
Geographical mobility - Moved from different state (%)
Geographical mobility - Moved from abroad (%)
Place of birth - Born in state of residence (%)
Place of birth - Born in other state (%)
Place of birth - Native, outside of US (%)
Place of birth - Foreign born (%)
Housing units in structures - 1, detached (%)
Housing units in structures - 1, attached (%)
Housing units in structures - 2 (%)
Housing units in structures - 3 or 4 (%)
Housing units in structures - 5 to 9 (%)
Housing units in structures - 10 to 19 (%)
Housing units in structures - 20 to 49 (%)
Housing units in structures - 50 or more (%)
Housing units in structures - Mobile home (%)
Housing units in structures - Boat, RV, van, etc. (%)
House/condo owner moved in on average (years ago)
Renter moved in on average (years ago)
Year householder moved into unit - Moved in 1999 to March 2000 (%)
Year householder moved into unit - Moved in 1995 to 1998 (%)
Year householder moved into unit - Moved in 1990 to 1994 (%)
Year householder moved into unit - Moved in 1980 to 1989 (%)
Year householder moved into unit - Moved in 1970 to 1979 (%)
Year householder moved into unit - Moved in 1969 or earlier (%)
Means of transportation to work - Drove car alone (%)
Means of transportation to work - Carpooled (%)
Means of transportation to work - Public transportation (%)
Means of transportation to work - Bus or trolley bus (%)
Means of transportation to work - Streetcar or trolley car (%)
Means of transportation to work - Subway or elevated (%)
Means of transportation to work - Railroad (%)
Means of transportation to work - Ferryboat (%)
Means of transportation to work - Taxicab (%)
Means of transportation to work - Motorcycle (%)
Means of transportation to work - Bicycle (%)
Means of transportation to work - Walked (%)
Means of transportation to work - Other means (%)
Working at home (%)
Industry diversity
Most Common Industries - Agriculture, forestry, fishing and hunting, and mining (%)
Most Common Industries - Agriculture, forestry, fishing and hunting (%)
Most Common Industries - Mining, quarrying, and oil and gas extraction (%)
Most Common Industries - Construction (%)
Most Common Industries - Manufacturing (%)
Most Common Industries - Wholesale trade (%)
Most Common Industries - Retail trade (%)
Most Common Industries - Transportation and warehousing, and utilities (%)
Most Common Industries - Transportation and warehousing (%)
Most Common Industries - Utilities (%)
Most Common Industries - Information (%)
Most Common Industries - Finance and insurance, and real estate and rental and leasing (%)
Most Common Industries - Finance and insurance (%)
Most Common Industries - Real estate and rental and leasing (%)
Most Common Industries - Professional, scientific, and management, and administrative and waste management services (%)
Most Common Industries - Professional, scientific, and technical services (%)
Most Common Industries - Management of companies and enterprises (%)
Most Common Industries - Administrative and support and waste management services (%)
Most Common Industries - Educational services, and health care and social assistance (%)
Most Common Industries - Educational services (%)
Most Common Industries - Health care and social assistance (%)
Most Common Industries - Arts, entertainment, and recreation, and accommodation and food services (%)
Most Common Industries - Arts, entertainment, and recreation (%)
Most Common Industries - Accommodation and food services (%)
Most Common Industries - Other services, except public administration (%)
Most Common Industries - Public administration (%)
Occupation diversity
Most Common Occupations - Management, business, science, and arts occupations (%)
Most Common Occupations - Management, business, and financial occupations (%)
Most Common Occupations - Management occupations (%)
Most Common Occupations - Business and financial operations occupations (%)
Most Common Occupations - Computer, engineering, and science occupations (%)
Most Common Occupations - Computer and mathematical occupations (%)
Most Common Occupations - Architecture and engineering occupations (%)
Most Common Occupations - Life, physical, and social science occupations (%)
Most Common Occupations - Education, legal, community service, arts, and media occupations (%)
Most Common Occupations - Community and social service occupations (%)
Most Common Occupations - Legal occupations (%)
Most Common Occupations - Education, training, and library occupations (%)
Most Common Occupations - Arts, design, entertainment, sports, and media occupations (%)
Most Common Occupations - Healthcare practitioners and technical occupations (%)
Most Common Occupations - Health diagnosing and treating practitioners and other technical occupations (%)
Most Common Occupations - Health technologists and technicians (%)
Most Common Occupations - Service occupations (%)
Most Common Occupations - Healthcare support occupations (%)
Most Common Occupations - Protective service occupations (%)
Most Common Occupations - Fire fighting and prevention, and other protective service workers including supervisors (%)
Most Common Occupations - Law enforcement workers including supervisors (%)
Most Common Occupations - Food preparation and serving related occupations (%)
Most Common Occupations - Building and grounds cleaning and maintenance occupations (%)
Most Common Occupations - Personal care and service occupations (%)
Most Common Occupations - Sales and office occupations (%)
Most Common Occupations - Sales and related occupations (%)
Most Common Occupations - Office and administrative support occupations (%)
Most Common Occupations - Natural resources, construction, and maintenance occupations (%)
Most Common Occupations - Farming, fishing, and forestry occupations (%)
Most Common Occupations - Construction and extraction occupations (%)
Most Common Occupations - Installation, maintenance, and repair occupations (%)
Most Common Occupations - Production, transportation, and material moving occupations (%)
Most Common Occupations - Production occupations (%)
Most Common Occupations - Transportation occupations (%)
Most Common Occupations - Material moving occupations (%)
People in Group quarters - Institutionalized population (%)
People in Group quarters - Correctional institutions (%)
People in Group quarters - Federal prisons and detention centers (%)
People in Group quarters - Halfway houses (%)
People in Group quarters - Local jails and other confinement facilities (including police lockups) (%)
People in Group quarters - Military disciplinary barracks (%)
People in Group quarters - State prisons (%)
People in Group quarters - Other types of correctional institutions (%)
People in Group quarters - Nursing homes (%)
People in Group quarters - Hospitals/wards, hospices, and schools for the handicapped (%)
People in Group quarters - Hospitals/wards and hospices for chronically ill (%)
People in Group quarters - Hospices or homes for chronically ill (%)
People in Group quarters - Military hospitals or wards for chronically ill (%)
People in Group quarters - Other hospitals or wards for chronically ill (%)
People in Group quarters - Hospitals or wards for drug/alcohol abuse (%)
People in Group quarters - Mental (Psychiatric) hospitals or wards (%)
People in Group quarters - Schools, hospitals, or wards for the mentally retarded (%)
People in Group quarters - Schools, hospitals, or wards for the physically handicapped (%)
People in Group quarters - Institutions for the deaf (%)
People in Group quarters - Institutions for the blind (%)
People in Group quarters - Orthopedic wards and institutions for the physically handicapped (%)
People in Group quarters - Wards in general hospitals for patients who have no usual home elsewhere (%)
People in Group quarters - Wards in military hospitals for patients who have no usual home elsewhere (%)
People in Group quarters - Juvenile institutions (%)
People in Group quarters - Long-term care (%)
People in Group quarters - Homes for abused, dependent, and neglected children (%)
People in Group quarters - Residential treatment centers for emotionally disturbed children (%)
People in Group quarters - Training schools for juvenile delinquents (%)
People in Group quarters - Short-term care, detention or diagnostic centers for delinquent children (%)
People in Group quarters - Type of juvenile institution unknown (%)
People in Group quarters - Noninstitutionalized population (%)
People in Group quarters - College dormitories (includes college quarters off campus) (%)
People in Group quarters - Military quarters (%)
People in Group quarters - On base (%)
People in Group quarters - Barracks, unaccompanied personnel housing (UPH), (Enlisted/Officer), ;and similar group living quarters for military personnel (%)
People in Group quarters - Transient quarters for temporary residents (%)
People in Group quarters - Military ships (%)
People in Group quarters - Group homes (%)
People in Group quarters - Homes or halfway houses for drug/alcohol abuse (%)
People in Group quarters - Homes for the mentally ill (%)
People in Group quarters - Homes for the mentally retarded (%)
People in Group quarters - Homes for the physically handicapped (%)
People in Group quarters - Other group homes (%)
People in Group quarters - Religious group quarters (%)
People in Group quarters - Dormitories (%)
People in Group quarters - Agriculture workers' dormitories on farms (%)
People in Group quarters - Job Corps and vocational training facilities (%)
People in Group quarters - Other workers' dormitories (%)
People in Group quarters - Crews of maritime vessels (%)
People in Group quarters - Other nonhousehold living situations (%)
People in Group quarters - Other noninstitutional group quarters (%)
Residents speaking English at home (%)
Residents speaking English at home - Born in the United States (%)
Residents speaking English at home - Native, born elsewhere (%)
Residents speaking English at home - Foreign born (%)
Residents speaking Spanish at home (%)
Residents speaking Spanish at home - Born in the United States (%)
Residents speaking Spanish at home - Native, born elsewhere (%)
Residents speaking Spanish at home - Foreign born (%)
Residents speaking other language at home (%)
Residents speaking other language at home - Born in the United States (%)
Residents speaking other language at home - Native, born elsewhere (%)
Residents speaking other language at home - Foreign born (%)
Class of Workers - Employee of private company (%)
Class of Workers - Self-employed in own incorporated business (%)
Class of Workers - Private not-for-profit wage and salary workers (%)
Class of Workers - Local government workers (%)
Class of Workers - State government workers (%)
Class of Workers - Federal government workers (%)
Class of Workers - Self-employed workers in own not incorporated business and Unpaid family workers (%)
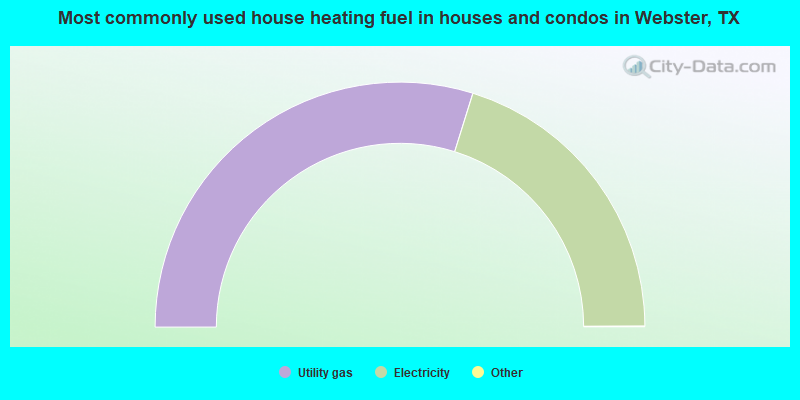
House heating fuel used in houses and condos - Utility gas (%)
House heating fuel used in houses and condos - Bottled, tank, or LP gas (%)
House heating fuel used in houses and condos - Electricity (%)
House heating fuel used in houses and condos - Fuel oil, kerosene, etc. (%)
House heating fuel used in houses and condos - Coal or coke (%)
House heating fuel used in houses and condos - Wood (%)
House heating fuel used in houses and condos - Solar energy (%)
House heating fuel used in houses and condos - Other fuel (%)
House heating fuel used in houses and condos - No fuel used (%)
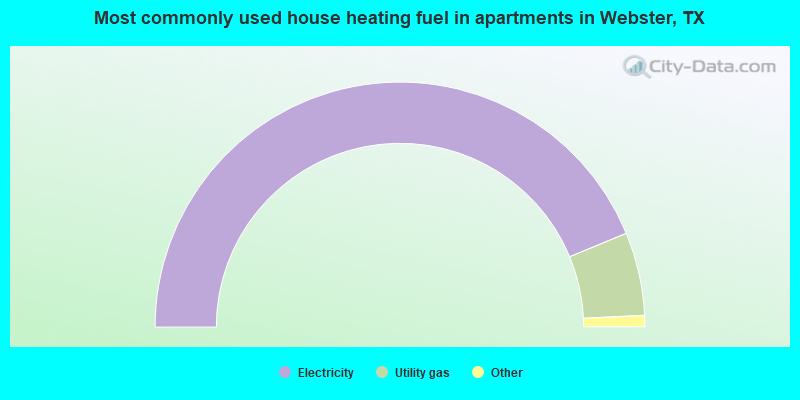
House heating fuel used in apartments - Utility gas (%)
House heating fuel used in apartments - Bottled, tank, or LP gas (%)
House heating fuel used in apartments - Electricity (%)
House heating fuel used in apartments - Fuel oil, kerosene, etc. (%)
House heating fuel used in apartments - Coal or coke (%)
House heating fuel used in apartments - Wood (%)
House heating fuel used in apartments - Solar energy (%)
House heating fuel used in apartments - Other fuel (%)
House heating fuel used in apartments - No fuel used (%)
Armed forces status - In Armed Forces (%)
Armed forces status - Civilian (%)
Armed forces status - Civilian - Veteran (%)
Armed forces status - Civilian - Nonveteran (%)
Fatal accidents locations in years 2005-2021
Fatal accidents locations in 2005
Fatal accidents locations in 2006
Fatal accidents locations in 2007
Fatal accidents locations in 2008
Fatal accidents locations in 2009
Fatal accidents locations in 2010
Fatal accidents locations in 2011
Fatal accidents locations in 2012
Fatal accidents locations in 2013
Fatal accidents locations in 2014
Fatal accidents locations in 2015
Fatal accidents locations in 2016
Fatal accidents locations in 2017
Fatal accidents locations in 2018
Fatal accidents locations in 2019
Fatal accidents locations in 2020
Fatal accidents locations in 2021
Alcohol use - People drinking some alcohol every month (%)
Alcohol use - People not drinking at all (%)
Alcohol use - Average days/month drinking alcohol
Alcohol use - Average drinks/week
Alcohol use - Average days/year people drink much
Audiometry - Average condition of hearing (%)
Audiometry - People that can hear a whisper from across a quiet room (%)
Audiometry - People that can hear normal voice from across a quiet room (%)
Audiometry - Ears ringing, roaring, buzzing (%)
Audiometry - Had a job exposure to loud noise (%)
Audiometry - Had off-work exposure to loud noise (%)
Blood Pressure & Cholesterol - Has high blood pressure (%)
Blood Pressure & Cholesterol - Checking blood pressure at home (%)
Blood Pressure & Cholesterol - Frequently checking blood cholesterol (%)
Blood Pressure & Cholesterol - Has high cholesterol level (%)
Consumer Behavior - Money monthly spent on food at supermarket/grocery store
Consumer Behavior - Money monthly spent on food at other stores
Consumer Behavior - Money monthly spent on eating out
Consumer Behavior - Money monthly spent on carryout/delivered foods
Consumer Behavior - Income spent on food at supermarket/grocery store (%)
Consumer Behavior - Income spent on food at other stores (%)
Consumer Behavior - Income spent on eating out (%)
Consumer Behavior - Income spent on carryout/delivered foods (%)
Current Health Status - General health condition (%)
Current Health Status - Blood donors (%)
Current Health Status - Has blood ever tested for HIV virus (%)
Current Health Status - Left-handed people (%)
Dermatology - People using sunscreen (%)
Diabetes - Diabetics (%)
Diabetes - Had a blood test for high blood sugar (%)
Diabetes - People taking insulin (%)
Diet Behavior & Nutrition - Diet health (%)
Diet Behavior & Nutrition - Milk product consumption (# of products/month)
Diet Behavior & Nutrition - Meals not home prepared (#/week)
Diet Behavior & Nutrition - Meals from fast food or pizza place (#/week)
Diet Behavior & Nutrition - Ready-to-eat foods (#/month)
Diet Behavior & Nutrition - Frozen meals/pizza (#/month)
Drug Use - People that ever used marijuana or hashish (%)
Drug Use - Ever used hard drugs (%)
Drug Use - Ever used any form of cocaine (%)
Drug Use - Ever used heroin (%)
Drug Use - Ever used methamphetamine (%)
Health Insurance - People covered by health insurance (%)
Kidney Conditions-Urology - Avg. # of times urinating at night
Medical Conditions - People with asthma (%)
Medical Conditions - People with anemia (%)
Medical Conditions - People with psoriasis (%)
Medical Conditions - People with overweight (%)
Medical Conditions - Elderly people having difficulties in thinking or remembering (%)
Medical Conditions - People who ever received blood transfusion (%)
Medical Conditions - People having trouble seeing even with glass/contacts (%)
Medical Conditions - People with arthritis (%)
Medical Conditions - People with gout (%)
Medical Conditions - People with congestive heart failure (%)
Medical Conditions - People with coronary heart disease (%)
Medical Conditions - People with angina pectoris (%)
Medical Conditions - People who ever had heart attack (%)
Medical Conditions - People who ever had stroke (%)
Medical Conditions - People with emphysema (%)
Medical Conditions - People with thyroid problem (%)
Medical Conditions - People with chronic bronchitis (%)
Medical Conditions - People with any liver condition (%)
Medical Conditions - People who ever had cancer or malignancy (%)
Mental Health - People who have little interest in doing things (%)
Mental Health - People feeling down, depressed, or hopeless (%)
Mental Health - People who have trouble sleeping or sleeping too much (%)
Mental Health - People feeling tired or having little energy (%)
Mental Health - People with poor appetite or overeating (%)
Mental Health - People feeling bad about themself (%)
Mental Health - People who have trouble concentrating on things (%)
Mental Health - People moving or speaking slowly or too fast (%)
Mental Health - People having thoughts they would be better off dead (%)
Oral Health - Average years since last visit a dentist
Oral Health - People embarrassed because of mouth (%)
Oral Health - People with gum disease (%)
Oral Health - General health of teeth and gums (%)
Oral Health - Average days a week using dental floss/device
Oral Health - Average days a week using mouthwash for dental problem
Oral Health - Average number of teeth
Pesticide Use - Households using pesticides to control insects (%)
Pesticide Use - Households using pesticides to kill weeds (%)
Physical Activity - People doing vigorous-intensity work activities (%)
Physical Activity - People doing moderate-intensity work activities (%)
Physical Activity - People walking or bicycling (%)
Physical Activity - People doing vigorous-intensity recreational activities (%)
Physical Activity - People doing moderate-intensity recreational activities (%)
Physical Activity - Average hours a day doing sedentary activities
Physical Activity - Average hours a day watching TV or videos
Physical Activity - Average hours a day using computer
Physical Functioning - People having limitations keeping them from working (%)
Physical Functioning - People limited in amount of work they can do (%)
Physical Functioning - People that need special equipment to walk (%)
Physical Functioning - People experiencing confusion/memory problems (%)
Physical Functioning - People requiring special healthcare equipment (%)
Prescription Medications - Average number of prescription medicines taking
Preventive Aspirin Use - Adults 40+ taking low-dose aspirin (%)
Reproductive Health - Vaginal deliveries (%)
Reproductive Health - Cesarean deliveries (%)
Reproductive Health - Deliveries resulted in a live birth (%)
Reproductive Health - Pregnancies resulted in a delivery (%)
Reproductive Health - Women breastfeeding newborns (%)
Reproductive Health - Women that had a hysterectomy (%)
Reproductive Health - Women that had both ovaries removed (%)
Reproductive Health - Women that have ever taken birth control pills (%)
Reproductive Health - Women taking birth control pills (%)
Reproductive Health - Women that have ever used Depo-Provera or injectables (%)
Reproductive Health - Women that have ever used female hormones (%)
Sexual Behavior - People 18+ that ever had sex (vaginal, anal, or oral) (%)
Sexual Behavior - Males 18+ that ever had vaginal sex with a woman (%)
Sexual Behavior - Males 18+ that ever performed oral sex on a woman (%)
Sexual Behavior - Males 18+ that ever had anal sex with a woman (%)
Sexual Behavior - Males 18+ that ever had any sex with a man (%)
Sexual Behavior - Females 18+ that ever had vaginal sex with a man (%)
Sexual Behavior - Females 18+ that ever performed oral sex on a man (%)
Sexual Behavior - Females 18+ that ever had anal sex with a man (%)
Sexual Behavior - Females 18+ that ever had any kind of sex with a woman (%)
Sexual Behavior - Average age people first had sex
Sexual Behavior - Average number of female sex partners in lifetime (males 18+)
Sexual Behavior - Average number of female vaginal sex partners in lifetime (males 18+)
Sexual Behavior - Average age people first performed oral sex on a woman (18+)
Sexual Behavior - Average number of woman performed oral sex on in lifetime (18+)
Sexual Behavior - Average number of male sex partners in lifetime (males 18+)
Sexual Behavior - Average number of male anal sex partners in lifetime (males 18+)
Sexual Behavior - Average age people first performed oral sex on a man (18+)
Sexual Behavior - Average number of male oral sex partners in lifetime (18+)
Sexual Behavior - People using protection when performing oral sex (%)
Sexual Behavior - Average number of times people have vaginal or anal sex a year
Sexual Behavior - People having sex without condom (%)
Sexual Behavior - Average number of male sex partners in lifetime (females 18+)
Sexual Behavior - Average number of male vaginal sex partners in lifetime (females 18+)
Sexual Behavior - Average number of female sex partners in lifetime (females 18+)
Sexual Behavior - Circumcised males 18+ (%)
Sleep Disorders - Average hours sleeping at night
Sleep Disorders - People that has trouble sleeping (%)
Smoking-Cigarette Use - People smoking cigarettes (%)
Taste & Smell - People 40+ having problems with smell (%)
Taste & Smell - People 40+ having problems with taste (%)
Taste & Smell - People 40+ that ever had wisdom teeth removed (%)
Taste & Smell - People 40+ that ever had tonsils teeth removed (%)
Taste & Smell - People 40+ that ever had a loss of consciousness because of a head injury (%)
Taste & Smell - People 40+ that ever had a broken nose or other serious injury to face or skull (%)
Taste & Smell - People 40+ that ever had two or more sinus infections (%)
Weight - Average height (inches)
Weight - Average weight (pounds)
Weight - Average BMI
Weight - People that are obese (%)
Weight - People that ever were obese (%)
Weight - People trying to lose weight (%)
According to our research of Texas and other state lists, there were 24 registered sex offenders living in Webster, Texas as of April 27, 2024 . The ratio of all residents to sex offenders in Webster is 476 to 1.The ratio of registered sex offenders to all residents in this city is near the state average.
Officers per 1,000 residents here:
4.23Texas average:
2.07
Latest news from Webster, TX collected exclusively by city-data.com from local newspapers, TV, and radio stations
Ancestries: English (5.3%), African (4.8%), German (4.3%), Irish (4.2%), European (3.7%), American (3.0%).
Current Local Time:
Land area: 6.62 square miles.
Population density: 1,841 people per square mile (low).
2,516 residents are foreign born (12.9% Latin America , 3.9% Asia ).
This city:
20.2%Texas:
17.1%
Median real estate property taxes paid for housing units with mortgages in 2022: $4,446 (1.7%)Median real estate property taxes paid for housing units with no mortgage in 2022: $5,174 (1.9%)
Nearest city with pop. 50,000+: Southeast Harris, TX (8.7 miles
Nearest city with pop. 200,000+: Houston, TX
Nearest cities:
Latitude: 29.54 N, Longitude: 95.12 W
Daytime population change due to commuting: +12,215 (+98.2%)Workers who live and work in this city: 1,220 (17.0%)
Property values in Webster, TX
Single-family new house construction building permits:
2022: 49 buildings , average cost: $253,8002021: 46 buildings , average cost: $239,2002020: 3 buildings , average cost: $233,1002019: 26 buildings , average cost: $249,9002018: 64 buildings , average cost: $279,8002017: 56 buildings , average cost: $317,9002016: 37 buildings , average cost: $317,3002015: 18 buildings , average cost: $331,0002014: 22 buildings , average cost: $256,7002013: 23 buildings , average cost: $167,7002012: 47 buildings , average cost: $181,2002011: 29 buildings , average cost: $204,6002010: 16 buildings , average cost: $245,8002009: 10 buildings , average cost: $256,4002007: 1 building , cost: $120,0002006: 5 buildings , average cost: $202,0002005: 9 buildings , average cost: $179,4002004: 19 buildings , average cost: $104,9002003: 24 buildings , average cost: $101,0002002: 30 buildings , average cost: $110,7002001: 6 buildings , average cost: $123,7002000: 10 buildings , average cost: $168,6001999: 6 buildings , average cost: $114,2001998: 7 buildings , average cost: $79,0001997: 5 buildings , average cost: $59,500Unemployment in December 2023:
Population change in the 1990s: +3,981 (+78.0%).
Most common occupations in Webster, TX (%)
Both Males Females
Computer specialists (6.5%)
Engineers (6.5%)
Other management occupations, except farmers and farm managers (4.1%)
Waiters and waitresses (3.6%)
Other sales and related occupations, including supervisors (3.5%)
Electrical equipment mechanics and other installation, maintenance, and repair workers, including supervisors (3.3%)
Building and grounds cleaning and maintenance occupations (3.0%)
Engineers (9.5%)
Computer specialists (8.4%)
Electrical equipment mechanics and other installation, maintenance, and repair workers, including supervisors (5.7%)
Other management occupations, except farmers and farm managers (4.4%)
Vehicle and mobile equipment mechanics, installers, and repairers (4.0%)
Building and grounds cleaning and maintenance occupations (3.9%)
Other sales and related occupations, including supervisors (3.4%)
Preschool, kindergarten, elementary, and middle school teachers (5.6%)
Accountants and auditors (5.1%)
Other office and administrative support workers, including supervisors (4.4%)
Material recording, scheduling, dispatching, and distributing workers (4.2%)
Waiters and waitresses (4.2%)
Computer specialists (3.9%)
Other sales and related occupations, including supervisors (3.7%)
Tornado activity:
Webster-area historical tornado activity is slightly above Texas state average. It is 76% greater than the overall U.S. average.
On 11/21/1992, a category F4 (max. wind speeds 207-260 mph) tornado 16.4 miles away from the Webster city center injured 16 people and caused between $50,000,000 and $500,000,000 in damages.
On 9/12/1961, a category F4 tornado 25.4 miles away from the city center killed 8 people and injured 200 people .
Earthquake activity:
Webster-area historical earthquake activity is significantly above Texas state average. It is 40% smaller than the overall U.S. average. On 5/17/2012 at 08:12:00, a magnitude 4.8 (4.8 MW, Depth: 3.1 mi, Class: Light, Intensity: IV - V) earthquake occurred 171.0 miles away from the city center On 10/20/2011 at 12:24:41, a magnitude 4.8 (4.8 MW, Depth: 3.1 mi) earthquake occurred 184.7 miles away from the city center On 9/2/2013 at 23:51:15, a magnitude 4.3 (4.3 MW, Depth: 2.9 mi) earthquake occurred 169.1 miles away from the city center On 4/9/1993 at 12:29:19, a magnitude 4.3 (4.1 MB, 4.3 LG, Depth: 3.1 mi) earthquake occurred 188.3 miles away from Webster center On 9/2/2013 at 21:52:38, a magnitude 4.2 (4.2 MW, Depth: 3.0 mi) earthquake occurred 171.5 miles away from the city center On 1/25/2013 at 07:01:19, a magnitude 4.1 (4.1 MB, Depth: 3.1 mi) earthquake occurred 166.7 miles away from the city center Magnitude types: regional Lg-wave magnitude (LG), body-wave magnitude (MB), moment magnitude (MW) Natural disasters: The number of natural disasters in Harris County (32) is a lot greater than the US average (15).Major Disasters (Presidential) Declared: 22Emergencies Declared: 6Storms: 16, Floods: 15, Hurricanes: 9, Tornadoes: 7, Tropical Storms: 4, Fires: 2, Winds: 2, Other: 1 (Note: some incidents may be assigned to more than one category). Main business address for: SPACEHAB INC \WA\ GUIDED MISSILES & SPACE VEHICLES & PARTS ).
Hospitals in Webster: BAYWOOD BEHAVIORAL HEALTH SYSTEMS (provides emergency services, 709 MEDICAL CENTER BLVD) CLEAR LAKE REGIONAL MEDICAL CENTER (Proprietary, provides emergency services, 500 MEDICAL CENTER BLVD) HOUSTON PHYSICIANS' HOSPITAL (Physician, provides emergency services, 333 N TEXAS AVENUE) SUMMIT HOSPITAL OF SOUTHEAST TEXAS INC (709 MEDICAL CENTER BLVD) Nursing Homes in Webster: CLEAR LAKE CARE CTR (750 TEXAS AVE) CLEAR LAKE REHABILITATION HO (655 EAST MEDICAL CENTER BOULEVARD) MANORCARE HEALTH SERVICES (750 W TEXAS AVE) POINT REH AND HEALTHCARE CTR LP,THE (17231 MILL FOREST) REGENCY VILLAGE (409 W GREEN) THE POINTE REHABILITATION AND HEALTHCARE CENTER (17231 MILL FOREST) Dialysis Facilities in Webster: CLEAR LAKE KIDNEY CENTER (1550 LIVE OAK) Home Health Centers in Webster: BETHANY HOME HEALTH OF CLEAR LAKE (5 PROFESSIONAL PARK SUITE A) HOME CARE PROFESSIONAL SERVICES INC (400 MEDICAL CENTER BLVD SUITE 201) Heliports located in Webster: Amtrak stations near Webster: 12 miles: SOUTH HOUSTON (1546 COLLEGE) - Bus Station 15 miles: LAMARQUE (725 OAK) - Bus Station
Colleges/Universities in Webster: Remington College-Houston Southeast Campus Full-time enrollment: 472; Location: 20985 Interstate 45 South; Private, not-for-profit; Website: www.remingtoncollege.edu/houston-career-schools-overview)
ITT Technical Institute-Webster Full-time enrollment: 323; Location: 1001 Magnolia Ave; Private, for-profit; Website: www.itt-tech.edu)
Colleges/universities with over 2000 students nearest to Webster:
University of Houston-Clear Lake (about 4 miles; Houston, TX ; Full-time enrollment: 5,833)
San Jacinto Community College (about 9 miles; Pasadena, TX ; FT enrollment: 13,517)
College of the Mainland (about 13 miles; Texas City, TX ; FT enrollment: 2,739)
Alvin Community College (about 13 miles; Alvin, TX ; FT enrollment: 3,953)
Lee College (about 16 miles; Baytown, TX ; FT enrollment: 4,278)
University of Houston (about 19 miles; Houston, TX ; FT enrollment: 31,888)
Texas Southern University (about 20 miles; Houston, TX ; FT enrollment: 7,053)
Public high school in Webster: CLEAR VIEW H S Location: 400 S WALNUT, Grades: 9-12, Charter school )
Private high schools in Webster: IMAN ACADEMY Students: 92, Location: 825 JETSTREAM, Grades: 5-10)
HOUSTON LEARNING ACADEMY Students: 8, Location: 17926 HIGHWAY 3 STE 103, Grades: 9-12)
Public elementary/middle schools in Webster:
Private elementary/middle school in Webster: WESTMINSTER CHRISTIAN ACADEMY Students: 213, Location: 670 E MEDICAL CENTER BLVD, Grades: PK-7)
See full list of schools located in Webster
Notable locations in Webster: (A) , Webster Central Wastewater Treatment Plant (B) , Webster Fire Department Station 1 (C) , Clear Lake Emergency Medical Corps (D) , Webster Fire Department Station 2 (E) , Webster Police Department (F) , Clear Lake City Fire Department (G) . Display/hide their locations on the map
Shopping Centers: (1) , Bay Area Square Shopping Center (2) , Baybrook Gateway Center Shopping Center (3) , Baybrook Square Shopping Center (4) , Bayway Village Shopping Center (5) , NASA Center Shopping Center (6) , Point NASA Shopping Center (7) , The Center at Baybrook Shopping Center (8) . Display/hide their locations on the map
Churches in Webster include: (A) , Bay Area Unitarian Universalist Church (B) , Saint John the Theologian Greek Orthodox Church (C) , Presbyterian Church (D) . Display/hide their locations on the map
Lake: (A) . Display/hide its location on the map
Streams, rivers, and creeks: (A) . Display/hide its location on the map
Park in Webster: (1) . Display/hide its location on the map
Tourist attraction:
Hotel:
Birthplace of: Micah Bowie - Baseball player, Ryan Trecartin - Artist, T. J. Wright - Football cornerback.
Harris County has a predicted average indoor radon screening level less than 2 pCi/L (pico curies per liter) - Low Potential Drinking water stations with addresses in Webster and their reported violations in the past:
GREATER LIFE TABERNACLE (Population served: 200, Groundwater):
Past monitoring violations:
10 routine major monitoring violations
Average household size: This city:
2.1 peopleTexas:
2.8 people
Percentage of family households: This city:
42.8%Whole state:
69.9%
Percentage of households with unmarried partners: This city:
9.9%Whole state:
6.0%
Likely homosexual households (counted as self-reported same-sex unmarried-partner households)
Lesbian couples: 0.6% of all households Gay men: 0.2% of all households
200 people in nursing facilities/skilled-nursing facilities in 2010people in emergency and transitional shelters (with sleeping facilities) for people experiencing homelessness in 2010People in group quarters in Webster in 2000:
212 people in nursing homes
46 people in other noninstitutional group quarters
6 people in other group homes
2 people in other workers' dormitories
Banks with most branches in Webster (2011 data):
Wells Fargo Bank, National Association: Baybrook Passage Branch, Baybrook Branch, Friendswood Branch. Info updated 2011/04/05: Bank assets: $1,161,490.0 mil, Deposits: $905,653.0 mil, headquarters in Sioux Falls, SD, positive income , 6395 total offices , Holding Company: Wells Fargo & Company
The Frost National Bank: Nasa Branch at 234 West Nasa Parkway, branch established on 2001/04/15. Info updated 2006/12/21: Bank assets: $20,372.1 mil, Deposits: $16,846.8 mil, headquarters in San Antonio, TX, positive income , Commercial Lending Specialization, 133 total offices , Holding Company: Cullen/Frost Bankers, Inc.
Icon Bank of Texas, National Association: Bay Area Banking Center Branch at 16610 Texas Highway 3, branch established on 2007/05/01. Info updated 2007/02/20: Bank assets: $372.3 mil, Deposits: $330.8 mil, headquarters in Houston, TX, positive income , Commercial Lending Specialization, 6 total offices , Holding Company: Icon Capital Corporation
Prosperity Bank: Clear Lake Branch at 100 Medical Center Blvd, branch established on 1986/05/27. Info updated 2012/01/05: Bank assets: $9,816.2 mil, Deposits: $8,064.8 mil, headquarters in El Campo, TX, positive income , Mortgage Lending Specialization, 187 total offices , Holding Company: Prosperity Bancshares, Inc.
First Community Bank, National Association: Bay Area Branch at 251 Medical Center Blvd., Suite 101, branch established on 2009/03/17. Info updated 2009/03/24: Bank assets: $634.7 mil, Deposits: $559.1 mil, headquarters in Sugar Land, TX, negative income in the last year , Commercial Lending Specialization, 33 total offices , Holding Company: Jll/Fch Holdings I, Llc
Citibank, National Association: Baybrook Financial Center at 1333 Bay Area Boulevard, Suite 100, branch established on 2005/10/28. Info updated 2012/01/10: Bank assets: $1,288,658.0 mil, Deposits: $882,541.0 mil, headquarters in Sioux Falls, SD, positive income , International Specialization, 1048 total offices , Holding Company: Citigroup Inc.
Capital One, National Association: Baybrook Branch at 1855 West Bay Area Boulevard, branch established on 2005/03/28. Info updated 2011/07/01: Bank assets: $133,477.8 mil, Deposits: $97,063.7 mil, headquarters in Mclean, VA, positive income , 984 total offices , Holding Company: Capital One Financial Corporation
JPMorgan Chase Bank, National Association: Baybrook Square Branch at 1441 West Bay Area Boulevard, branch established on 1986/06/30. Info updated 2011/11/10: Bank assets: $1,811,678.0 mil, Deposits: $1,190,738.0 mil, headquarters in Columbus, OH, positive income , International Specialization, 5577 total offices , Holding Company: Jpmorgan Chase & Co.
Comerica Bank: Bay Area Blvd. Branch at 19415 Gulf Fwy, branch established on 2007/12/07. Info updated 2011/07/29: Bank assets: $60,970.5 mil, Deposits: $48,300.9 mil, headquarters in Dallas, TX, positive income , Commercial Lending Specialization, 497 total offices , Holding Company: Comerica Incorporated
For population 15 years and over in Webster:
Never married: 43.9%Now married: 35.2%Separated: 2.7%Widowed: 6.2%Divorced: 12.0% For population 25 years and over in Webster:
High school or higher: 88.9%Bachelor's degree or higher: 34.3%Graduate or professional degree: 13.4%Unemployed: 5.9%Mean travel time to work (commute): 24.6 minutes
Education Gini index (Inequality in education) Here:
14.3Texas average:
14.0
Religion statistics for Webster, TX (based on Harris County data)
Religion Adherents Congregations Evangelical Protestant 1,077,287 2,102 Catholic 741,896 109 Mainline Protestant 278,855 288 Other 213,212 296 Black Protestant 65,641 211 Orthodox 12,884 25 None 1,702,684 -
Source: Clifford Grammich, Kirk Hadaway, Richard Houseal, Dale E.Jones, Alexei Krindatch, Richie Stanley and Richard H.Taylor. 2012. 2010 U.S.Religion Census: Religious Congregations & Membership Study. Association of Statisticians of American Religious Bodies. Jones, Dale E., et al. 2002. Congregations and Membership in the United States 2000. Nashville, TN: Glenmary Research Center. Graphs represent county-level data
Food Environment Statistics: Number of grocery stores : 737Harris County :
1.88 / 10,000 pop.Texas :
1.47 / 10,000 pop.
Number of supercenters and club stores : 41Harris County :
0.10 / 10,000 pop.State :
0.14 / 10,000 pop.
Number of convenience stores (no gas) : 530Harris County :
1.35 / 10,000 pop.Texas :
1.11 / 10,000 pop.
Number of convenience stores (with gas) : 1,321Harris County :
3.38 / 10,000 pop.State :
3.95 / 10,000 pop.
Number of full-service restaurants : 2,302Harris County :
5.88 / 10,000 pop.Texas :
6.13 / 10,000 pop.
Adult obesity rate : Harris County :
26.0%Texas :
26.6%
Low-income preschool obesity rate : This county :
17.1%State :
15.7%
Health and Nutrition:
Average overall health of teeth and gums : People feeling badly about themselves : People not drinking alcohol at all : Average hours sleeping at night : General health condition : This city:
57.9%Texas:
56.2%
Average condition of hearing : More about Health and Nutrition of Webster, TX Residents
Local government employment and payroll (March 2022)
Function
Full-time employees
Monthly full-time payroll
Average yearly full-time wage
Part-time employees
Monthly part-time payroll
Police Protection - Officers
43 $293,517 $81,912 0 $0 Police - Other
22 $134,914 $73,589 1 $1,349 Firefighters
16 $122,545 $91,909 0 $0 Streets and Highways
14 $60,280 $51,669 0 $0 Other and Unallocable
12 $88,244 $88,244 0 $0 Housing and Community Development (Local)
10 $65,302 $78,362 0 $0 Other Government Administration
10 $73,255 $87,906 7 $4,500 Water Supply
8 $34,501 $51,752 0 $0 Parks and Recreation
8 $36,002 $54,003 2 $1,727 Financial Administration
8 $57,943 $86,915 0 $0 Fire - Other
7 $57,897 $99,252 0 $0 Sewerage
6 $33,062 $66,124 0 $0 Judicial and Legal
4 $23,144 $69,432 4 $12,511 Natural Resources
2 $11,494 $68,964 0 $0 Health
1 $6,145 $73,740 0 $0
Totals for Government
171 $1,098,244 $77,070 14 $20,086
Webster government finances - Expenditure in 2021 (per resident):
Construction - Parks and Recreation: $528,000 ($43.36)
Sewerage: $177,000 ($14.54)Regular Highways: $102,000 ($8.38)Current Operations - Police Protection: $9,030,000 ($741.56)
Local Fire Protection: $3,863,000 ($317.24)General - Other: $2,253,000 ($185.02)Sewerage: $2,071,000 ($170.07)Central Staff Services: $2,038,000 ($167.36)Water Utilities: $1,669,000 ($137.06)General Public Buildings: $1,628,000 ($133.69)Parks and Recreation: $1,424,000 ($116.94)Financial Administration: $1,025,000 ($84.18)Regular Highways: $827,000 ($67.91)Protective Inspection and Regulation - Other: $821,000 ($67.42)Housing and Community Development: $717,000 ($58.88)Judicial and Legal Services: $698,000 ($57.32)General - Interest on Debt: $360,000 ($29.56)
Total Salaries and Wages: $2,980,000 ($244.72)
Water Utilities - Interest on Debt: $220,000 ($18.07)
Webster government finances - Revenue in 2021 (per resident):
Charges - Sewerage: $2,943,000 ($241.69)
Parks and Recreation: $444,000 ($36.46)Other: $410,000 ($33.67)Miscellaneous - Fines and Forfeits: $967,000 ($79.41)
Interest Earnings: $203,000 ($16.67)General Revenue - Other: $162,000 ($13.30)Sale of Property: $11,000 ($0.90)Revenue - Water Utilities: $3,070,000 ($252.11)
State Intergovernmental - General Local Government Support: $502,000 ($41.23)
Other: $181,000 ($14.86)Tax - General Sales and Gross Receipts: $19,275,000 ($1582.90)
Property: $6,782,000 ($556.95)Other Selective Sales: $1,596,000 ($131.07)Public Utilities Sales: $1,409,000 ($115.71)Other License: $724,000 ($59.46)Occupation and Business License - Other: $92,000 ($7.56)Alcoholic Beverage License: $38,000 ($3.12)Amusements License: $5,000 ($0.41)
Webster government finances - Debt in 2021 (per resident):
Long Term Debt - Beginning Outstanding - Unspecified Public Purpose: $11,770,000 ($966.58)
Outstanding Unspecified Public Purpose: $8,555,000 ($702.55)Retired Unspecified Public Purpose: $3,215,000 ($264.02)
Webster government finances - Cash and Securities in 2021 (per resident):
Bond Funds - Cash and Securities: $2,714,000 ($222.88)
Other Funds - Cash and Securities: $41,528,000 ($3410.36)
Sinking Funds - Cash and Securities: $743,000 ($61.02)
5.26% of this county's 2021 resident taxpayers lived in other counties in 2020 ($67,872 average adjusted gross income )
Here:
5.26%Texas average:
8.12%
0.02% of residents moved from foreign countries ($158 average AGI )Harris County:
0.02%Texas average:
0.04%
Top counties from which taxpayers relocated into this county between 2020 and 2021:
5.91% of this county's 2020 resident taxpayers moved to other counties in 2021 ($76,622 average adjusted gross income )
Here:
5.91%Texas average:
7.40%
0.01% of residents moved to foreign countries ($155 average AGI )Harris County:
0.01%Texas average:
0.03%
Top counties to which taxpayers relocated from this county between 2020 and 2021:
Businesses in Webster, TX
Name Count Name Count
AMF Bowling 1 La Quinta 1 AT&T 1 La-Z-Boy 2 Academy Sports + Outdoors 1 Lane Furniture 5 Advance Auto Parts 1 Little Caesars Pizza 1 Avenue 1 Lowe's 1 Bally Total Fitness 1 Marriott 1 Barnes & Noble 1 Marshalls 1 Bed Bath & Beyond 1 Mazda 1 Ben & Jerry's 1 McDonald's 2 Budget Car Rental 1 Motel 6 1 Burger King 1 Nike 5 Burlington Coat Factory 1 Office Depot 1 CVS 1 Old Navy 1 Casual Male XL 1 Outback 1 Chick-Fil-A 1 Outback Steakhouse 1 Chipotle 1 Panda Express 1 Chuck E. Cheese's 1 Panera Bread 1 Cricket Wireless 4 Payless 1 Dairy Queen 1 PetSmart 1 Days Inn 1 Pier 1 Imports 1 Discount Tire 1 RadioShack 1 Domino's Pizza 1 Red Lobster 1 Extended Stay Deluxe 1 SAS Shoes 1 Fashion Bug 1 SONIC Drive-In 1 FedEx 7 Sprint Nextel 1 GameStop 1 Staples 1 H&R Block 1 Starbucks 4 Hilton 2 Subway 4 Hobby Lobby 1 T-Mobile 3 Holiday Inn 3 T.G.I. Driday's 1 Home Depot 1 Target 1 Honda 1 The Room Place 2 IHOP 1 Torrid 1 InTown Suites 1 Toys"R"Us 1 Jack In The Box 2 U-Haul 3 Jamba Juice 1 UPS 5 JoS. A. Bank 1 Vans 3 Justice 1 Waffle House 1 Kincaid 1 YMCA 1
Strongest AM radio stations in Webster:
KTRH (740 AM; 50 kW; HOUSTON, TX; Owner: AMFM TEXAS LICENSES LIMITED PARTNERSHIP)
KILE (1560 AM; 50 kW; BELLAIRE, TX; Owner: THE RAFTT CORPORATION)
KYST (920 AM; 5 kW; TEXAS CITY, TX; Owner: HISPANIC BROADCASTING, INC.)
KXYZ (1320 AM; 5 kW; HOUSTON, TX; Owner: BLAYA INC.)
KGOL (1180 AM; 50 kW; HUMBLE, TX; Owner: ENTRAVISION HOLDINGS, LLC)
KLVL (1480 AM; 3 kW; PASADENA, TX; Owner: SIGA BROADCASTING CORP.)
KLAT (1010 AM; 10 kW; HOUSTON, TX; Owner: TICHENOR LICENSE CORPORATION ("TLC"))
KTEK (1110 AM; daytime; 2 kW; ALVIN, TX; Owner: SOUTH TEXAS BROADCASTING, INC.)
KWWJ (1360 AM; 5 kW; BAYTOWN, TX; Owner: SALT OF THE EARTH BROADCASTING, INC.)
KPRC (950 AM; 5 kW; HOUSTON, TX; Owner: CCB TEXAS LICENSES, L.P.)
KHCB (1400 AM; 1 kW; GALVESTON, TX; Owner: HOUSTON CHRISTIAN BROADCASTERS, INC.)
KCOH (1430 AM; 5 kW; HOUSTON, TX; Owner: KCOH, INC.)
KEYH (850 AM; 10 kW; HOUSTON, TX; Owner: LIBERMAN BROADCASTING OF HOUSTON LICENSE CORP.)
Strongest FM radio stations in Webster:
KLDE (107.5 FM; LAKE JACKSON, TX; Owner: CXR HOLDINGS, INC.)
KOVE-FM (106.5 FM; GALVESTON, TX; Owner: HBC LICENSE CORPORATION)
KUHF (88.7 FM; HOUSTON, TX; Owner: UNIVERSITY OF HOUSTON SYSTEM)
KRBE (104.1 FM; HOUSTON, TX; Owner: KRBE LICO, INC.)
KBXX (97.9 FM; HOUSTON, TX; Owner: RADIO ONE LICENSES, LLC)
KHJZ-FM (95.7 FM; HOUSTON, TX; Owner: TEXAS INFINITY BROADCASTING L.P.)
KHMX (96.5 FM; HOUSTON, TX; Owner: CITICASTERS LICENSES, L.P.)
KILT-FM (100.3 FM; HOUSTON, TX; Owner: TEXAS INFINITY BROADCASTING L.P.)
KKBQ-FM (92.9 FM; PASADENA, TX; Owner: CXR HOLDINGS, INC.)
KLOL (101.1 FM; HOUSTON, TX; Owner: AMFM TEXAS LICENSES LIMITED PARTNERSHIP)
KODA (99.1 FM; HOUSTON, TX; Owner: AMFM TEXAS LICENSES LIMITED PARTNERSHIP)
KTBZ-FM (94.5 FM; HOUSTON, TX; Owner: AMFM TEXAS LICENSES LIMITED PARTNERSHIP)
KKRW (93.7 FM; HOUSTON, TX; Owner: CAPSTAR TX LIMITED PARTNERSHIP)
KMJQ (102.1 FM; HOUSTON, TX; Owner: RADIO ONE LICENSES, LLC)
KHCB-FM (105.7 FM; HOUSTON, TX; Owner: HOUSTON CHRISTIAN BROADCASTERS, INC.)
KJIC (90.5 FM; SANTA FE, TX; Owner: COMMUNITY RADIO, INC.)
KPTY (104.9 FM; MISSOURI CITY, TX; Owner: TICHENOR LICENSE CORPORATION ("TLC"))
KLTN (102.9 FM; HOUSTON, TX; Owner: HBC HOUSTON LICENSE CORPORATION)
K217DJ (91.3 FM; KEMAH, TX; Owner: BEST MEDIA INC.)
KRTS (92.1 FM; SEABROOK, TX; Owner: KRTS, INC.)
TV broadcast stations around Webster:
KJIB-LP (Channel 5; CLEAR LAKE CITY, TX; Owner: FAR EASTERN TELECASTERS)
KTMD (Channel 48; GALVESTON, TX; Owner: TELEMUNDO OF TEXAS PARTNERSHIP, LP)
KLTJ (Channel 22; GALVESTON, TX; Owner: WORD OF GOD FELLOWSHIP, INC.)
KAZH (Channel 57; BAYTOWN, TX; Owner: KAZH LICENSE, LLC)
KHOU-TV (Channel 11; HOUSTON, TX; Owner: KHOU-TV, L.P.)
KPRC-TV (Channel 2; HOUSTON, TX; Owner: POST-NEWSWEEK STATIONS, HOUSTON, LP)
KRIV (Channel 26; HOUSTON, TX; Owner: FOX TELEVISION STATIONS, INC.)
KTRK-TV (Channel 13; HOUSTON, TX; Owner: KTRK TELEVISION, INC.)
KNWS-TV (Channel 51; KATY, TX; Owner: JOHNSON BROADCASTING, INC.)
KHWB (Channel 39; HOUSTON, TX; Owner: KHWB, INC.)
KXLN-TV (Channel 45; ROSENBERG, TX; Owner: KXLN LICENSE PARTNERSHIP, L.P.)
KPXB (Channel 49; CONROE, TX; Owner: PAXSON HOUSTON LICENSE, INC.)
KTBU (Channel 55; CONROE, TX; Owner: HUMANITY INTERESTED MEDIA, INC.)
KZJL (Channel 61; HOUSTON, TX; Owner: KZJL LICENSE CORP.)
KUHT (Channel 8; HOUSTON, TX; Owner: UNIVERSITY OF HOUSTON SYSTEM)
KETH (Channel 14; HOUSTON, TX; Owner: COMMUNITY EDUCATIONAL TV, INC.)
KTXH (Channel 20; HOUSTON, TX; Owner: FOX TELEVISION STATIONS, INC.)
KFTH (Channel 67; ALVIN, TX; Owner: TELEFUTURA HOUSTON LLC)
KVDO-LP (Channel 69; CLEAR LAKE, TX; Owner: FAR EASTERN TELECASTERS)
KBPX-LP (Channel 33; HOUSTON, TX; Owner: PAXSON COMMUNICATIONS LPTV, INC.)
KHMV-LP (Channel 28; HOUSTON, TX; Owner: PAPPAS TELECASTING OF THE GULF COAST, A CALIFORNIA LP)
KVQT-LP (Channel 24; HOUSTON, TX; Owner: C. DOWEN JOHNSON)
KVVV-LP (Channel 53; HOUSTON, TX; Owner: KAZH LICENSE, LLC)
KVIT-LP (Channel 28; VICTORIA, TX; Owner: CLUB COMMUNICATIONS)
K30CV (Channel 30; HOUSTON, TX; Owner: BROADCASTING SYSTEMS, INC.)
National Bridge Inventory (NBI) Statistics 39 Number of bridges1,640ft / 500m Total length $242,000 Total costs1,624,131 Total average daily traffic104,130 Total average daily truck traffic
New bridges - historical statistics
1 1920-1929 3 1940-1949 1 1960-1969 3 1980-1989 1 1990-1999 20 2000-2009 8 2010-2019 2 2020-2022
See full National Bridge Inventory statistics for Webster, TX
Home Mortgage Disclosure Act Aggregated Statistics For Year 2009(Based on 1 full and 3 partial tracts) A) FHA, FSA/RHS & VA B) Conventional C) Refinancings D) Home Improvement Loans E) Loans on Dwellings For 5+ Families F) Non-occupant Loans on Number Average Value Number Average Value Number Average Value Number Average Value Number Average Value Number Average Value
LOANS ORIGINATED 39 $120,573 42 $150,351 83 $178,035 10 $29,426 0 $0 8 $125,545 APPLICATIONS APPROVED, NOT ACCEPTED 2 $133,285 6 $151,543 13 $136,418 1 $76,030 0 $0 2 $61,345 APPLICATIONS DENIED 4 $156,535 9 $113,554 36 $158,985 11 $33,856 0 $0 3 $77,577 APPLICATIONS WITHDRAWN 5 $134,716 5 $146,954 24 $155,348 2 $146,845 1 $37,690 5 $86,000 FILES CLOSED FOR INCOMPLETENESS 0 $0 1 $138,020 8 $131,031 2 $27,140 0 $0 0 $0
Aggregated Statistics For Year 2008(Based on 1 full and 3 partial tracts) A) FHA, FSA/RHS & VA B) Conventional C) Refinancings D) Home Improvement Loans E) Loans on Dwellings For 5+ Families F) Non-occupant Loans on G) Loans On Manufactured Number Average Value Number Average Value Number Average Value Number Average Value Number Average Value Number Average Value Number Average Value
LOANS ORIGINATED 24 $123,209 91 $176,104 47 $132,843 11 $57,256 1 $2,149,910 23 $157,716 1 $19,160 APPLICATIONS APPROVED, NOT ACCEPTED 1 $133,210 9 $123,410 8 $89,530 4 $56,555 0 $0 3 $72,153 1 $69,740 APPLICATIONS DENIED 3 $106,210 28 $133,199 34 $142,923 21 $39,245 0 $0 22 $71,117 2 $29,170 APPLICATIONS WITHDRAWN 2 $101,325 9 $207,924 10 $125,692 2 $45,845 1 $28,734,000 0 $0 0 $0 FILES CLOSED FOR INCOMPLETENESS 0 $0 3 $203,040 7 $197,007 2 $49,440 0 $0 2 $80,045 0 $0
Aggregated Statistics For Year 2007(Based on 1 full and 3 partial tracts) A) FHA, FSA/RHS & VA B) Conventional C) Refinancings D) Home Improvement Loans E) Loans on Dwellings For 5+ Families F) Non-occupant Loans on G) Loans On Manufactured Number Average Value Number Average Value Number Average Value Number Average Value Number Average Value Number Average Value Number Average Value
LOANS ORIGINATED 22 $122,448 182 $127,429 56 $132,272 24 $54,179 2 $6,748,205 44 $105,144 0 $0 APPLICATIONS APPROVED, NOT ACCEPTED 0 $0 32 $106,276 13 $147,088 4 $109,080 0 $0 12 $85,541 0 $0 APPLICATIONS DENIED 2 $132,765 45 $105,622 50 $120,984 22 $51,302 0 $0 18 $91,521 0 $0 APPLICATIONS WITHDRAWN 3 $121,287 25 $142,272 22 $123,596 4 $50,450 1 $23,578,900 2 $141,025 1 $134,090 FILES CLOSED FOR INCOMPLETENESS 0 $0 11 $112,525 9 $136,802 1 $21,970 0 $0 4 $86,972 0 $0
Aggregated Statistics For Year 2006(Based on 1 full and 3 partial tracts) A) FHA, FSA/RHS & VA B) Conventional C) Refinancings D) Home Improvement Loans E) Loans on Dwellings For 5+ Families F) Non-occupant Loans on G) Loans On Manufactured Number Average Value Number Average Value Number Average Value Number Average Value Number Average Value Number Average Value Number Average Value
LOANS ORIGINATED 13 $104,678 226 $94,109 62 $118,372 16 $37,476 2 $8,171,135 51 $75,725 0 $0 APPLICATIONS APPROVED, NOT ACCEPTED 0 $0 42 $85,933 13 $77,038 5 $38,516 0 $0 6 $61,458 2 $31,655 APPLICATIONS DENIED 4 $104,692 69 $85,582 49 $123,464 16 $31,253 0 $0 21 $91,448 6 $39,162 APPLICATIONS WITHDRAWN 2 $137,665 43 $90,505 34 $118,552 4 $61,972 0 $0 4 $72,328 0 $0 FILES CLOSED FOR INCOMPLETENESS 0 $0 11 $105,947 11 $136,115 1 $9,920 0 $0 2 $108,640 0 $0
Aggregated Statistics For Year 2005(Based on 1 full and 3 partial tracts) A) FHA, FSA/RHS & VA B) Conventional C) Refinancings D) Home Improvement Loans E) Loans on Dwellings For 5+ Families F) Non-occupant Loans on G) Loans On Manufactured Number Average Value Number Average Value Number Average Value Number Average Value Number Average Value Number Average Value Number Average Value
LOANS ORIGINATED 10 $90,597 183 $99,543 97 $117,618 12 $41,769 1 $3,442,130 31 $87,239 0 $0 APPLICATIONS APPROVED, NOT ACCEPTED 1 $49,520 35 $94,677 15 $103,795 4 $48,398 0 $0 3 $72,450 2 $35,880 APPLICATIONS DENIED 1 $132,100 48 $86,369 107 $104,621 21 $54,137 0 $0 18 $77,303 8 $40,271 APPLICATIONS WITHDRAWN 0 $0 41 $104,669 49 $119,689 13 $225,421 0 $0 9 $75,632 0 $0 FILES CLOSED FOR INCOMPLETENESS 1 $83,170 18 $104,689 20 $134,472 0 $0 0 $0 4 $111,425 0 $0
Aggregated Statistics For Year 2004(Based on 1 full and 3 partial tracts) A) FHA, FSA/RHS & VA B) Conventional C) Refinancings D) Home Improvement Loans E) Loans on Dwellings For 5+ Families F) Non-occupant Loans on G) Loans On Manufactured Number Average Value Number Average Value Number Average Value Number Average Value Number Average Value Number Average Value Number Average Value
LOANS ORIGINATED 18 $125,714 208 $103,841 145 $112,447 19 $51,315 2 $676,195 31 $74,599 2 $37,385 APPLICATIONS APPROVED, NOT ACCEPTED 1 $194,450 41 $93,320 27 $104,802 3 $36,607 0 $0 4 $59,660 4 $43,642 APPLICATIONS DENIED 1 $172,570 52 $72,808 127 $98,639 17 $30,584 1 $766,240 16 $71,239 4 $38,855 APPLICATIONS WITHDRAWN 7 $90,281 37 $113,292 56 $108,177 2 $41,265 1 $919,490 5 $94,580 0 $0 FILES CLOSED FOR INCOMPLETENESS 0 $0 8 $125,632 35 $114,973 3 $131,280 0 $0 3 $64,637 0 $0
Aggregated Statistics For Year 2003(Based on 1 full and 3 partial tracts) A) FHA, FSA/RHS & VA B) Conventional C) Refinancings D) Home Improvement Loans E) Loans on Dwellings For 5+ Families F) Non-occupant Loans on Number Average Value Number Average Value Number Average Value Number Average Value Number Average Value Number Average Value
LOANS ORIGINATED 23 $99,153 166 $99,793 325 $108,466 15 $36,461 0 $0 45 $77,674 APPLICATIONS APPROVED, NOT ACCEPTED 0 $0 25 $103,273 46 $89,982 5 $29,210 0 $0 5 $50,016 APPLICATIONS DENIED 1 $71,320 27 $111,174 155 $96,035 13 $43,867 1 $756,660 12 $93,354 APPLICATIONS WITHDRAWN 1 $79,750 17 $118,930 68 $99,331 1 $15,580 0 $0 8 $86,595 FILES CLOSED FOR INCOMPLETENESS 0 $0 7 $114,083 13 $99,815 0 $0 0 $0 2 $93,485
Aggregated Statistics For Year 1999(Based on 1 full and 3 partial tracts) A) FHA, FSA/RHS & VA B) Conventional C) Refinancings D) Home Improvement Loans E) Loans on Dwellings For 5+ Families F) Non-occupant Loans on Number Average Value Number Average Value Number Average Value Number Average Value Number Average Value Number Average Value
LOANS ORIGINATED 33 $90,332 147 $97,236 54 $74,052 21 $14,425 1 $1,202,720 16 $73,811 APPLICATIONS APPROVED, NOT ACCEPTED 1 $72,170 27 $82,604 11 $102,917 4 $22,812 0 $0 3 $69,890 APPLICATIONS DENIED 3 $80,103 64 $63,734 21 $68,940 12 $18,180 0 $0 11 $80,078 APPLICATIONS WITHDRAWN 3 $99,520 20 $108,679 23 $80,403 1 $13,480 0 $0 1 $51,430 FILES CLOSED FOR INCOMPLETENESS 1 $90,860 4 $122,018 15 $81,064 2 $14,305 0 $0 1 $69,760
Detailed HMDA statistics for the following Tracts:
3410.00
, 3411.00 , 3412.00 , 3508.00
Private Mortgage Insurance Companies Aggregated Statistics For Year 2009(Based on 1 full and 3 partial tracts) A) Conventional B) Refinancings Number Average Value Number Average Value
LOANS ORIGINATED 8 $174,288 1 $353,360 APPLICATIONS APPROVED, NOT ACCEPTED 1 $89,780 1 $120,480 APPLICATIONS DENIED 2 $210,605 0 $0 APPLICATIONS WITHDRAWN 1 $191,810 1 $33,920 FILES CLOSED FOR INCOMPLETENESS 0 $0 0 $0
Aggregated Statistics For Year 2008(Based on 1 full and 3 partial tracts) A) Conventional B) Refinancings C) Non-occupant Loans on Number Average Value Number Average Value Number Average Value
LOANS ORIGINATED 31 $152,950 4 $169,795 5 $78,964 APPLICATIONS APPROVED, NOT ACCEPTED 8 $147,154 1 $119,980 0 $0 APPLICATIONS DENIED 3 $113,217 1 $81,870 2 $63,680 APPLICATIONS WITHDRAWN 3 $90,643 0 $0 0 $0 FILES CLOSED FOR INCOMPLETENESS 0 $0 0 $0 0 $0
Aggregated Statistics For Year 2007(Based on 1 full and 3 partial tracts) A) Conventional B) Refinancings C) Non-occupant Loans on Number Average Value Number Average Value Number Average Value
LOANS ORIGINATED 59 $125,054 2 $144,035 9 $138,633 APPLICATIONS APPROVED, NOT ACCEPTED 7 $141,816 2 $121,765 2 $73,960 APPLICATIONS DENIED 2 $181,060 0 $0 0 $0 APPLICATIONS WITHDRAWN 4 $100,438 0 $0 1 $46,180 FILES CLOSED FOR INCOMPLETENESS 1 $178,150 0 $0 0 $0
Aggregated Statistics For Year 2006(Based on 1 full and 3 partial tracts) A) Conventional B) Refinancings C) Non-occupant Loans on Number Average Value Number Average Value Number Average Value
LOANS ORIGINATED 35 $96,046 2 $133,980 5 $85,006 APPLICATIONS APPROVED, NOT ACCEPTED 3 $190,750 0 $0 0 $0 APPLICATIONS DENIED 0 $0 0 $0 0 $0 APPLICATIONS WITHDRAWN 1 $96,210 0 $0 0 $0 FILES CLOSED FOR INCOMPLETENESS 0 $0 0 $0 0 $0
Aggregated Statistics For Year 2005(Based on 1 full and 3 partial tracts) A) Conventional B) Refinancings C) Non-occupant Loans on D) Loans On Manufactured Number Average Value Number Average Value Number Average Value Number Average Value
LOANS ORIGINATED 31 $102,381 3 $102,167 4 $75,908 1 $92,270 APPLICATIONS APPROVED, NOT ACCEPTED 8 $110,164 1 $143,210 4 $109,445 0 $0 APPLICATIONS DENIED 0 $0 0 $0 0 $0 0 $0 APPLICATIONS WITHDRAWN 1 $280,710 0 $0 0 $0 0 $0 FILES CLOSED FOR INCOMPLETENESS 0 $0 0 $0 0 $0 0 $0
Aggregated Statistics For Year 2004(Based on 1 full and 3 partial tracts) A) Conventional B) Refinancings C) Non-occupant Loans on Number Average Value Number Average Value Number Average Value
LOANS ORIGINATED 38 $121,254 4 $124,778 5 $82,810 APPLICATIONS APPROVED, NOT ACCEPTED 12 $122,668 1 $254,630 1 $40,230 APPLICATIONS DENIED 0 $0 0 $0 0 $0 APPLICATIONS WITHDRAWN 1 $86,780 2 $119,355 0 $0 FILES CLOSED FOR INCOMPLETENESS 0 $0 0 $0 0 $0
Aggregated Statistics For Year 2003(Based on 1 full and 3 partial tracts) A) Conventional B) Refinancings C) Non-occupant Loans on Number Average Value Number Average Value Number Average Value
LOANS ORIGINATED 42 $110,067 15 $119,117 8 $83,995 APPLICATIONS APPROVED, NOT ACCEPTED 6 $105,098 4 $141,970 2 $115,000 APPLICATIONS DENIED 0 $0 0 $0 0 $0 APPLICATIONS WITHDRAWN 1 $171,750 2 $150,515 0 $0 FILES CLOSED FOR INCOMPLETENESS 0 $0 0 $0 0 $0
Aggregated Statistics For Year 1999(Based on 1 full and 3 partial tracts) A) Conventional B) Refinancings C) Non-occupant Loans on Number Average Value Number Average Value Number Average Value
LOANS ORIGINATED 66 $75,051 4 $116,540 6 $48,718 APPLICATIONS APPROVED, NOT ACCEPTED 7 $95,421 1 $140,550 1 $135,690 APPLICATIONS DENIED 2 $110,755 1 $88,900 1 $88,900 APPLICATIONS WITHDRAWN 6 $67,828 0 $0 1 $25,990 FILES CLOSED FOR INCOMPLETENESS 3 $83,037 0 $0 1 $22,140
Detailed PMIC statistics for the following Tracts:
3410.00
, 3411.00 , 3412.00 , 3508.00 Fire-safe hotels and motels in Webster, Texas:
Motel 6 #0551 Webster, 1001 W Nasa Rd 1, Webster, Texas 77598 Phone: (713) 332-4581, Fax: (281) 332-0341
Days Inn & Suites Nasa, 750 W Nasa Rd 1, Webster, Texas 77598 Phone: (281) 332-1001, Fax: (281) 554-2967
Extended Stay America - Houston - Nasa - Bay Area Blvd, 720 W Bay Area Blvd, Webster, Texas 77598 Phone: (281) 338-7711, Fax: (281) 338-7722
In Town Suites Nasa, 480 W Bay Area Blvd, Webster, Texas 77598 Phone: (281) 554-9552, Fax: (281) 338-9460
La Quinta Inn & Suites, 520 W Bay Area Blvd, Webster, Texas 77598 Phone: (281) 554-5290, Fax: (281) 554-5292
Comfort Suites, 16931 N Texas Ave, Webster, Texas 77598 Phone: (281) 554-5400, Fax: (281) 554-5441
Staybridge Suites - Clear Lake/Nasa, 501 Texas Avenue W, Webster, Texas 77598 Phone: (281) 338-0900, Fax: (281) 338-0901
Springhill Suites By Marriott Webster, 1101 Magnolia Ave, Webster, Texas 77598 Phone: (281) 332-2999, Fax: (281) 332-2992
5 other hotels and motels
All 13 fire-safe hotels and motels in Webster, Texas
Most common first names in Webster, TX among deceased individuals Name Count Lived (average)
Mary 38 77.4 years William 27 73.2 years James 24 69.3 years Robert 20 69.3 years John 19 71.0 years Ruth 15 80.5 years Margaret 14 81.0 years Richard 12 64.3 years Charles 11 72.2 years Frank 10 75.8 years
Most common last names in Webster, TX among deceased individuals Last name Count Lived (average)
Johnson 11 71.3 years Smith 10 68.2 years Moore 7 78.4 years Williams 7 69.6 years Brown 6 78.8 years Anderson 6 81.8 years Davis 6 43.5 years Garcia 6 77.6 years Walker 6 78.0 years Kagawa 5 80.0 years
Webster compared to Texas state average:
Unemployed percentage below state average. Foreign-born population percentage above state average. Renting percentage significantly above state average. Number of rooms per house below state average. Percentage of population with a bachelor's degree or higher above state average.
#28 on the list of "Top 100 cities with smallest houses (pop. 5,000+)"
#29 on the list of "Top 101 cities with largest percentage of males in occupations: food preparation and serving related occupations (population 5,000+)"
#38 on the list of "Top 101 cities with largest percentage of males in industries: accommodation and food services (population 5,000+)"
#40 on the list of "Top 101 cities with the smallest percentage of one, detached housing units in structures (2,000+ housing units)"
#43 on the list of "Top 100 cities with highest percentage of renters (pop. 5,000+)"
#48 on the list of "Top 101 cities with the least people living the same house as 1 year ago (population 5,000+))"
#59 on the list of "Top 101 cities with the highest number of police officers per 1000 residents (population 5,000+)"
#67 on the list of "Top 101 cities with the most residents born in Guatemala (population 500+)"
#77 on the list of "Top 101 cities with largest percentage of females in occupations: architecture and engineering occupations (population 5,000+)"
#81 on the list of "Top 101 cities with the lowest percentage of family households, population 10,000+"
#92 on the list of "Top 101 cities that people commute into (largest positive percentage daily daytime population change due to commuting) (population 5,000+)"
#1 on the list of "Top 101 counties with the most Mainline Protestant adherents"
#1 on the list of "Top 101 counties with the most Evangelical Protestant adherents"
#2 on the list of "Top 101 counties with the most Evangelical Protestant congregations"
#3 on the list of "Top 101 counties with the highest ground withdrawal of fresh water for public supply"
#6 on the list of "Top 101 counties with the most Mainline Protestant congregations (pop. 50,000+)"
Top Patent Applicants
David Rafferty (20)
Frank Noble Permenter (12)
Nathan Williams (8)
Herbert S. Kobayashi (7)
Bryan Kristian Griffith (5)
Dragomir Rosson (4)
Robin L. Campbell (4)
Neelesh Deolalikar (3)
Jay Patrick Painter (3)
Cary Edward Moore (3)
Total of 130 patent applications in 2008-2024.
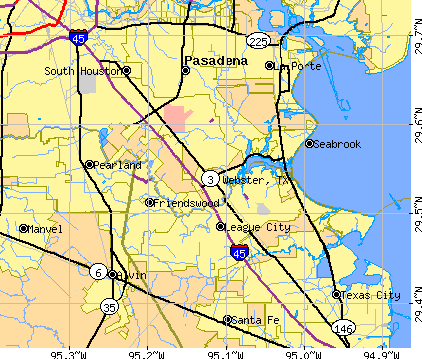


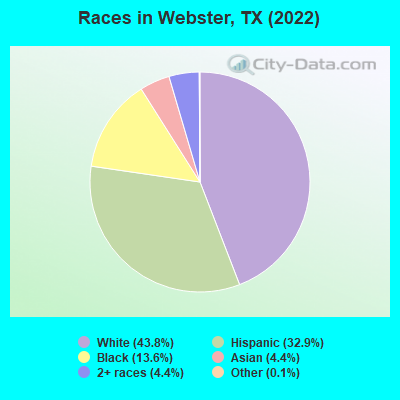
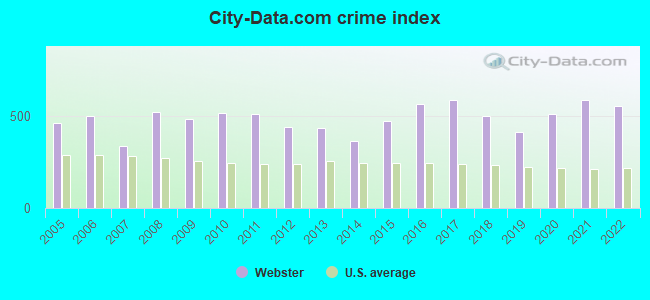
 Recent articles from our blog. Our writers, many of them Ph.D. graduates or candidates, create easy-to-read articles on a wide variety of topics.

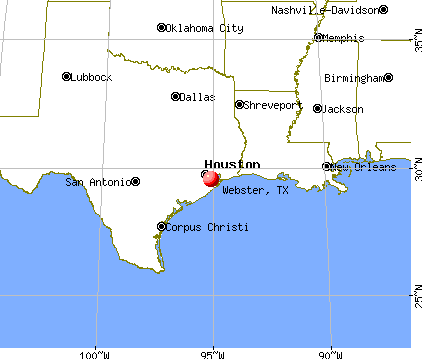
 , pop. 82,015).
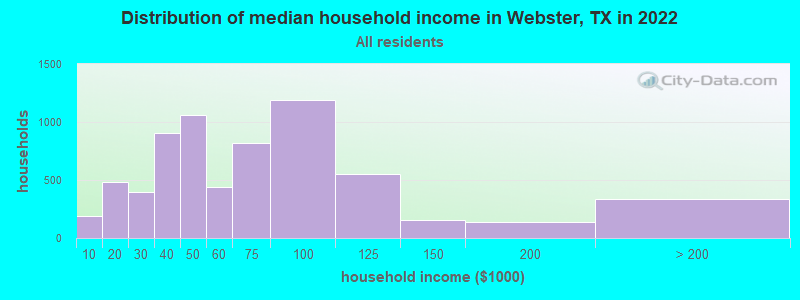
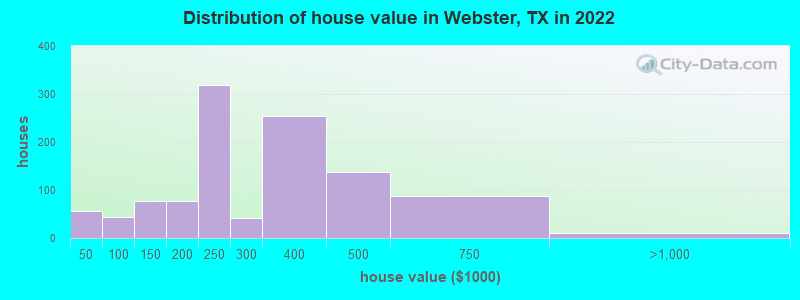

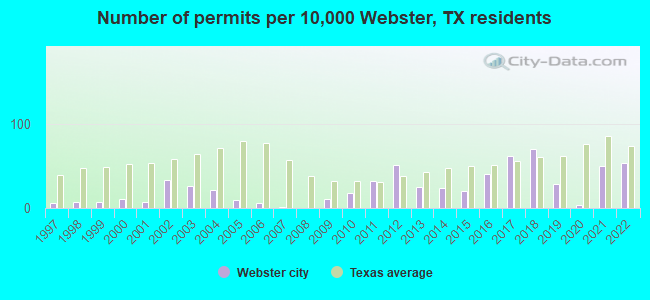
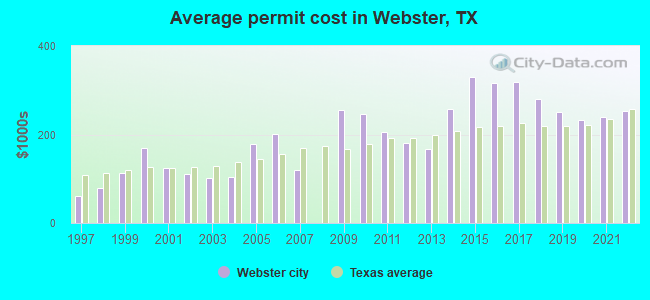
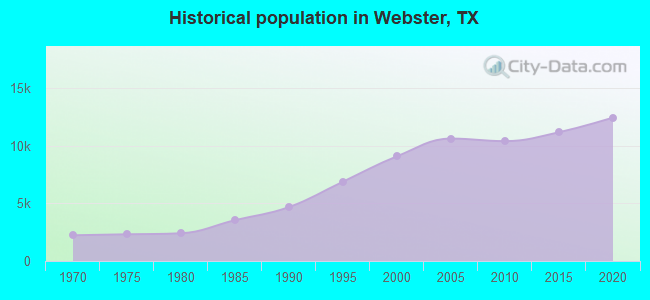
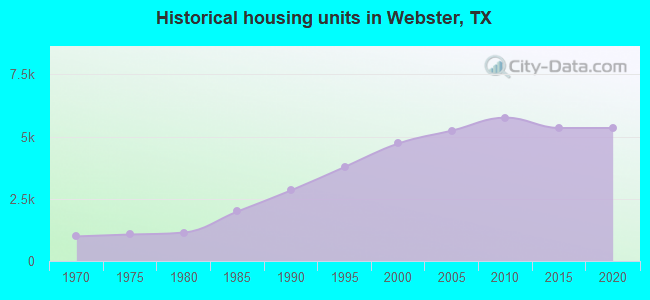
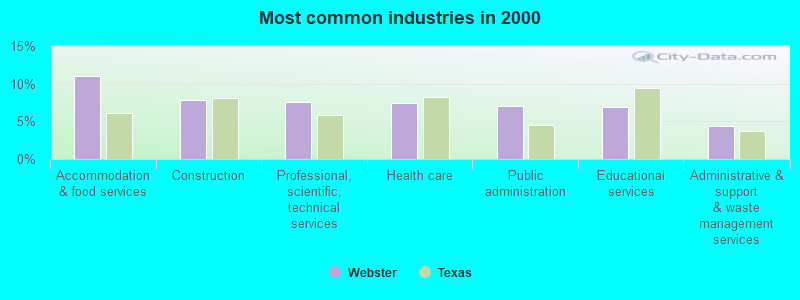
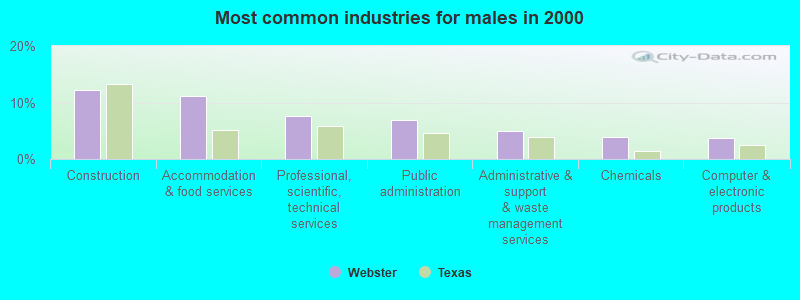
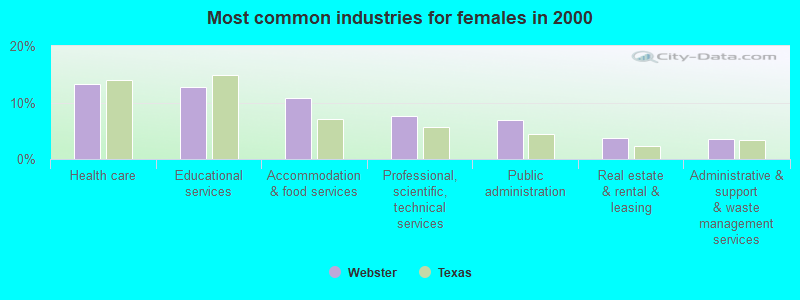
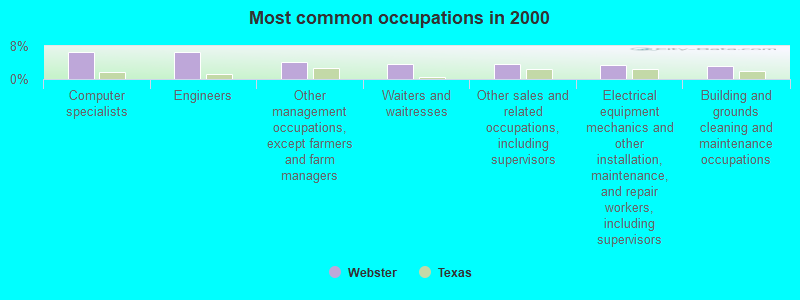
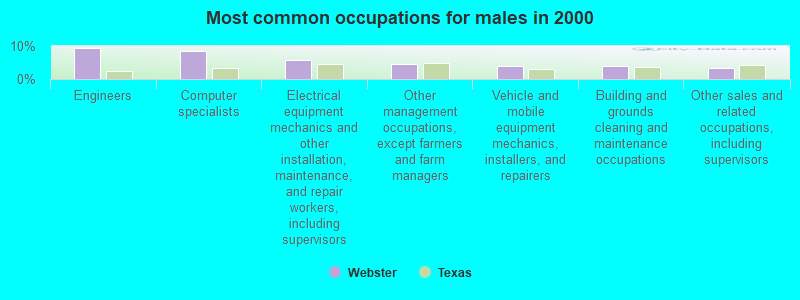
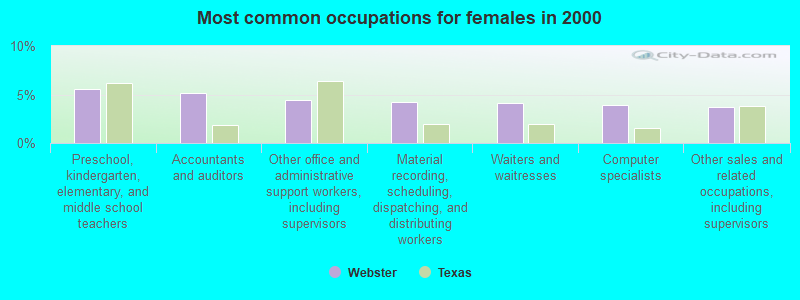
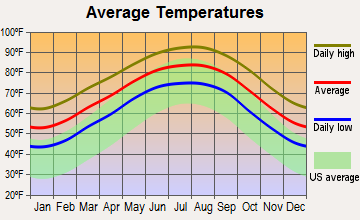
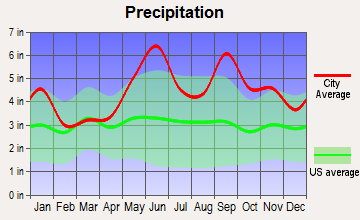
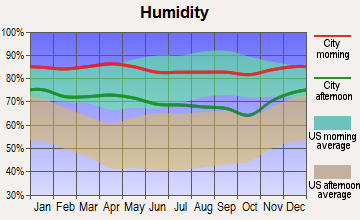
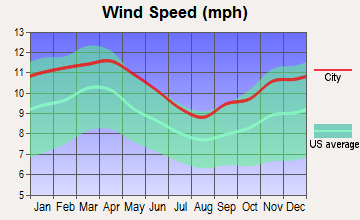
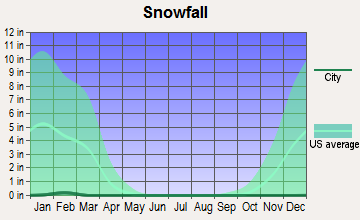
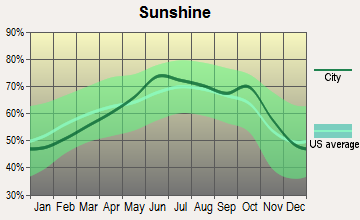
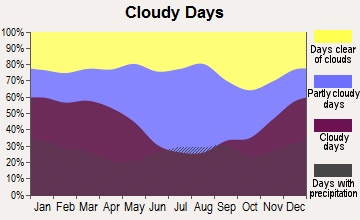
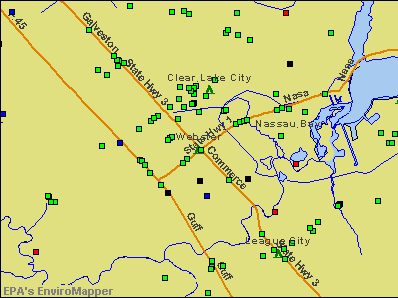

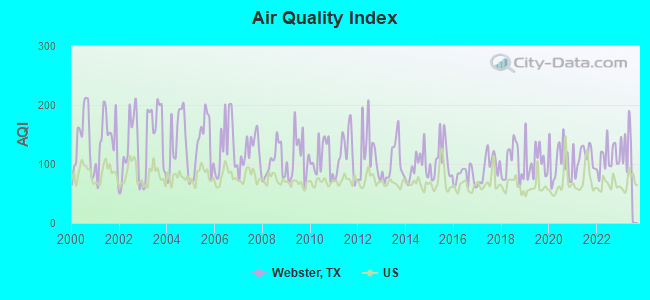
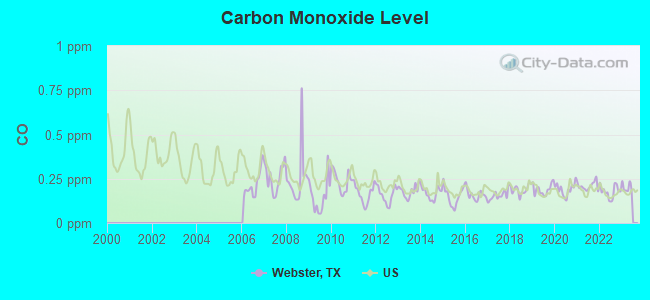
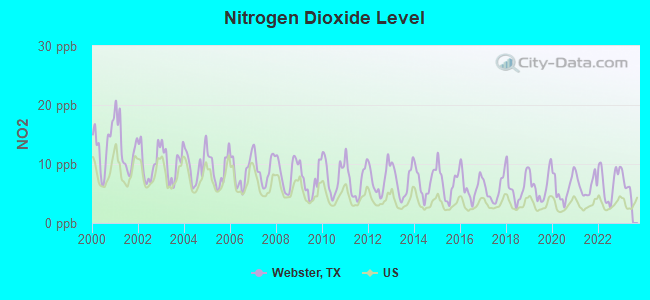
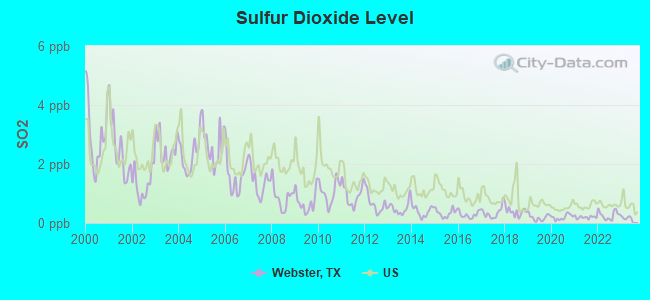
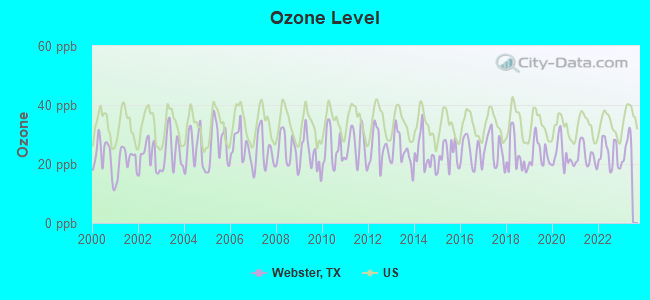
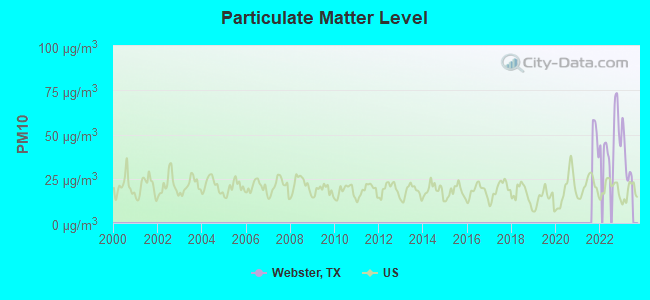
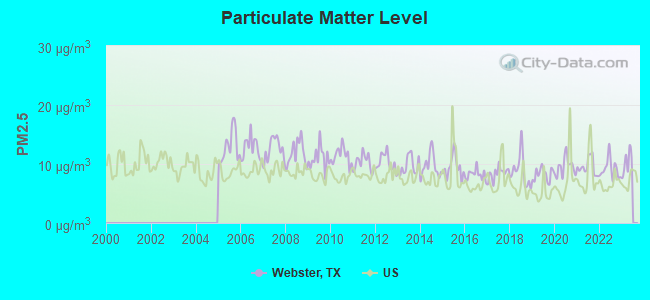
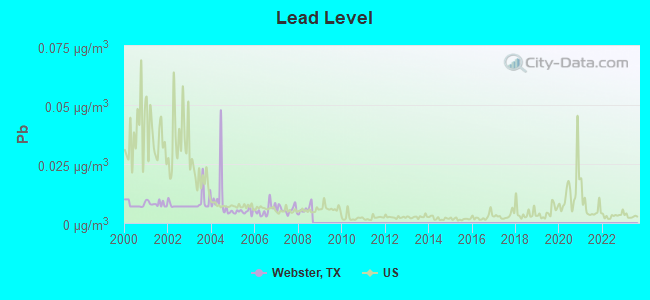

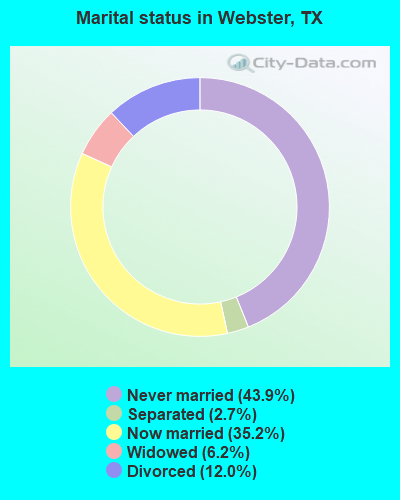
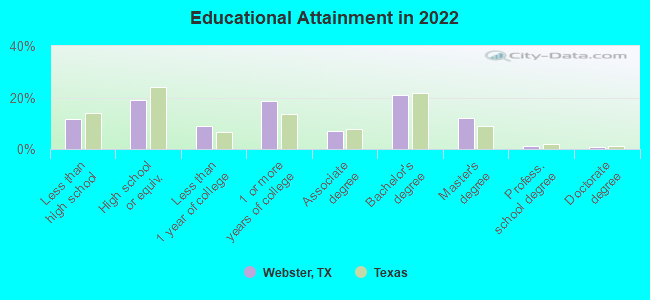
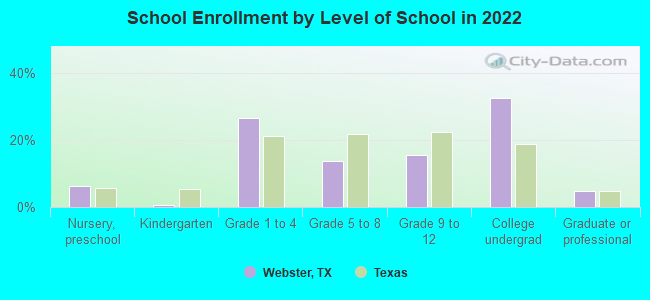
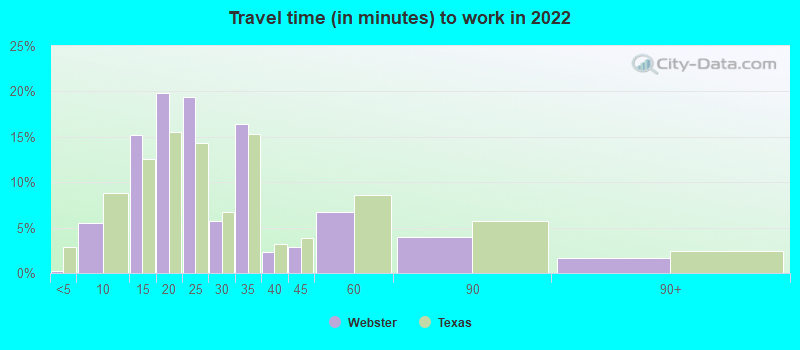
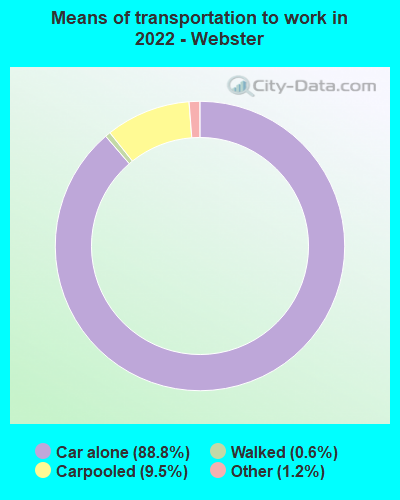
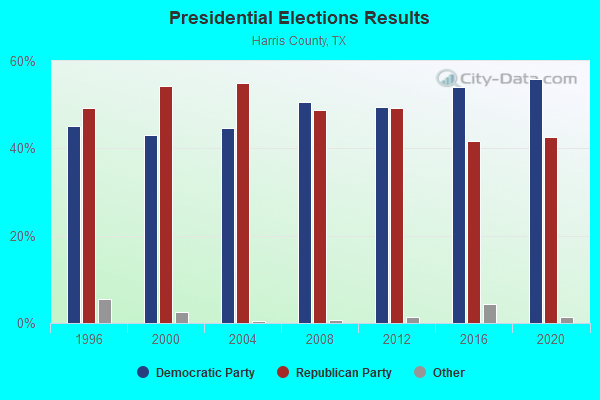
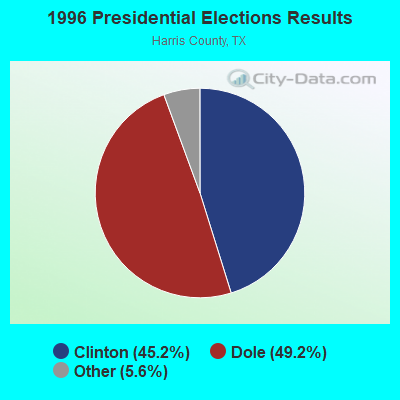
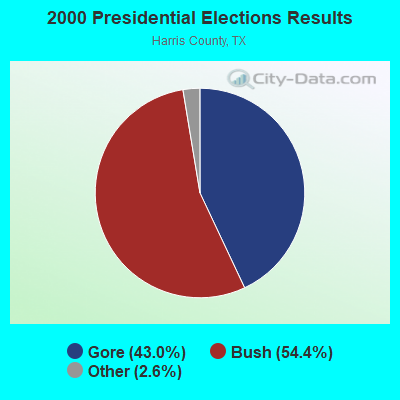
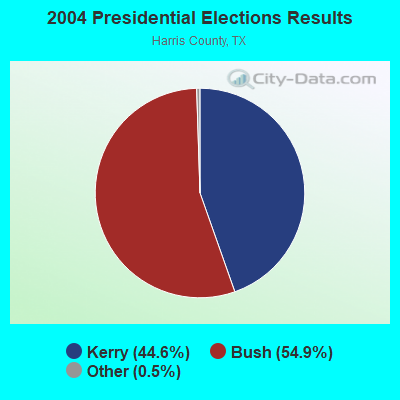
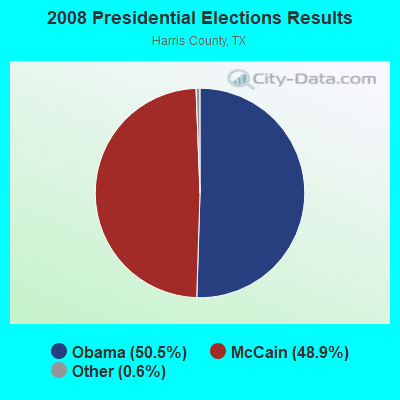
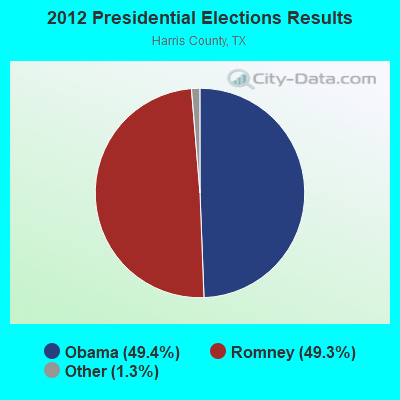
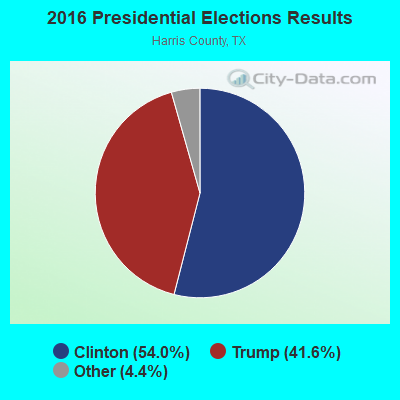
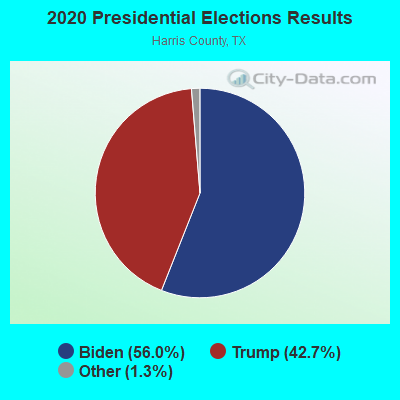
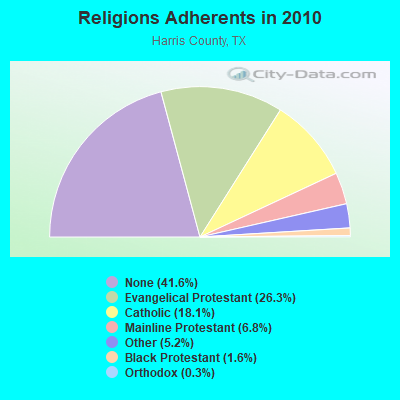
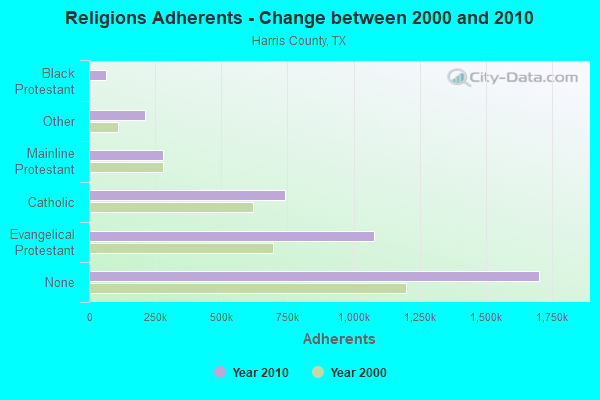
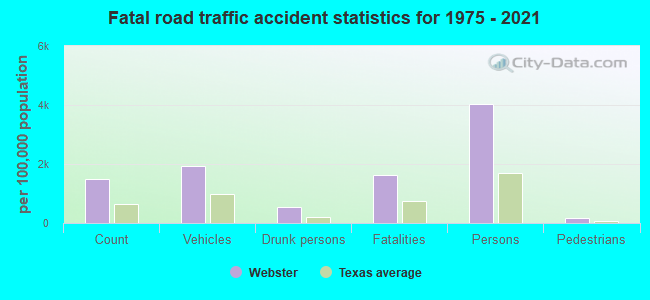
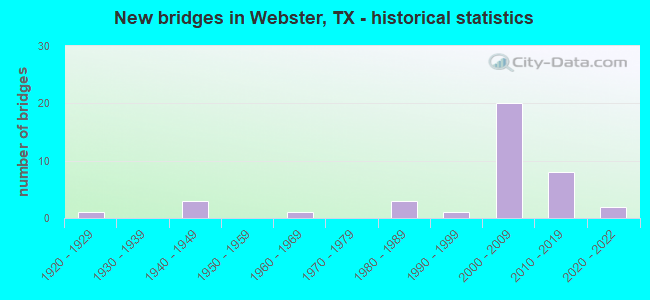
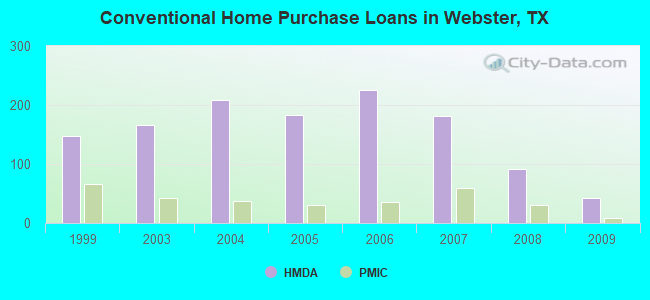
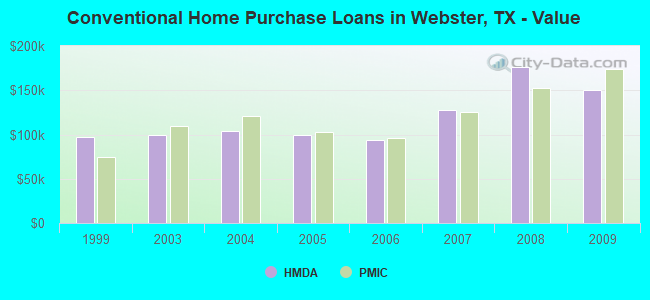
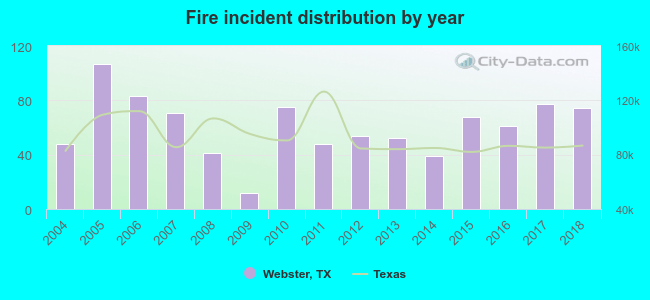 Based on the data from the years 2004 - 2018 the average number of fire incidents per year is 61. The highest number of reported fire incidents - 107 took place in 2005, and the least - 12 in 2009. The data has a rising trend.
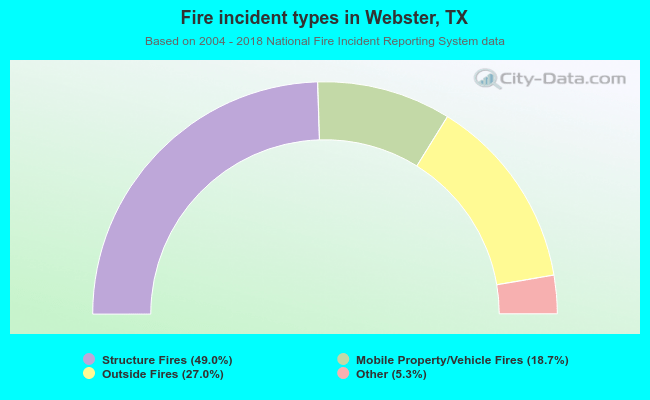 When looking into fire subcategories, the most reports belonged to: Structure Fires (49.0%), and Outside Fires (27.0%).