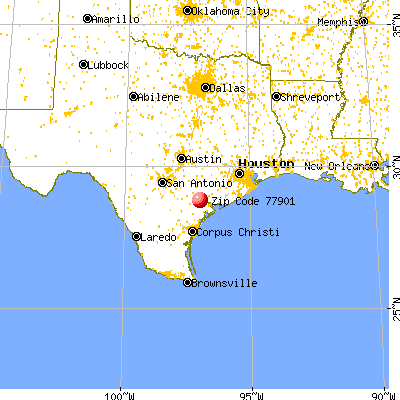
Estimated zip code population in 2022: 41,216 Zip code population in 2010: 41,548 Zip code population in 2000: 40,467
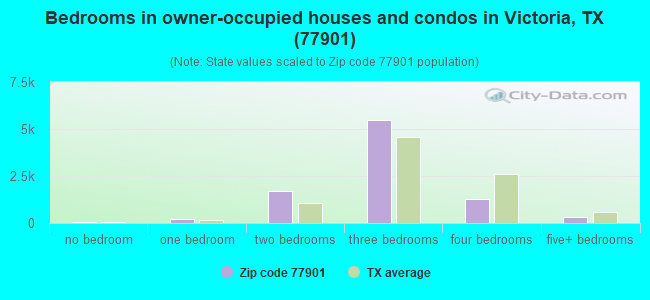
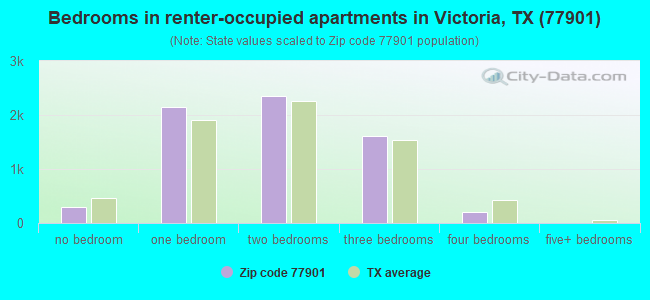
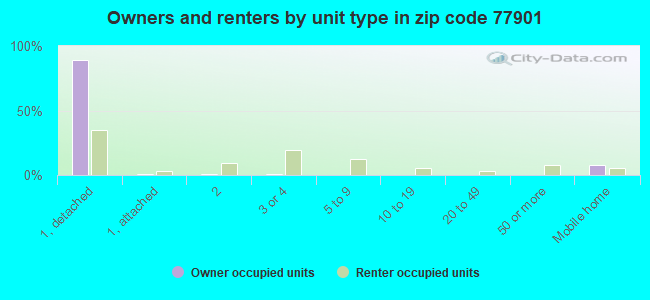
Houses and condos: 18,198 Renter-occupied apartments: 6,658
% of renters here:
42%
State:
38%
March 2022 cost of living index in zip code 77901: 83.6 (less than average, U.S. average is 100)
Land area: 19.8 sq. mi. Water area: 0.0 sq. mi.
Population density: 2,084 people per square mile
(low).
OSM Map
General Map
Google Map
MSN Map
OSM Map
General Map
Google Map
MSN Map
OSM Map
General Map
Google Map
MSN Map
OSM Map
General Map
Google Map
MSN Map
Please wait while loading the map...
Real estate property taxes paid for housing units in 2022:
This zip code:
1.6% ($2,378)
Texas:
1.5% ($4,050)
Median real estate property taxes paid for housing units with mortgages in 2022: $2,953 (1.8%) Median real estate property taxes paid for housing units with no mortgage in 2022: $1,546 (1.4%)
Averages for the 2020 tax year for zip code 77901, filed in 2021:
Average Adjusted Gross Income (AGI) in 2020: $42,262 (Individual Income Tax Returns)
Here:
$42,262
State:
$77,054
Salary/wage: $37,116 (reported on 86.0% of returns)
Here:
$37,116
State:
$62,766
(% of AGI for various income ranges: 1188.0% for AGIs below $25k, 3489.5% for AGIs $25k-50k, 6303.6% for AGIs $50k-75k, 9705.5% for AGIs $75k-100k, 15445.2% for AGIs $100k-200k, 52670.0% for AGIs over 200k)
Taxable interest for individuals: $1,246 (reported on 13.3% of returns)
This zip code:
$1,246
Texas:
$2,665
(% of AGI for various income ranges: 5.7% for AGIs below $25k, 6.6% for AGIs $25k-50k, 17.2% for AGIs $50k-75k, 34.3% for AGIs $75k-100k, 91.8% for AGIs $100k-200k, 1711.7% for AGIs over 200k)
Ordinary dividends: $7,122 (reported on 6.4% of returns)
Here:
$7,122
State:
$10,044
(% of AGI for various income ranges: 6.5% for AGIs below $25k, 11.8% for AGIs $25k-50k, 34.3% for AGIs $50k-75k, 80.9% for AGIs $75k-100k, 217.5% for AGIs $100k-200k, 7166.7% for AGIs over 200k)
Net capital gain/loss in AGI: +$20,004 (reported on 5.9% of returns)
Here:
+$20,004
State:
+$39,590
(% of AGI for various income ranges: 1.0% for AGIs below $25k, 10.0% for AGIs $25k-50k, 30.5% for AGIs $50k-75k, 66.2% for AGIs $75k-100k, 409.6% for AGIs $100k-200k, 27106.7% for AGIs over 200k)
Profit/loss from business: +$8,553 (reported on 15.6% of returns)
Here:
+$8,553
State:
+$10,888
(% of AGI for various income ranges: 129.2% for AGIs below $25k, 60.6% for AGIs $25k-50k, 74.9% for AGIs $50k-75k, 259.4% for AGIs $75k-100k, 444.5% for AGIs $100k-200k, 10010.0% for AGIs over 200k)
Taxable individual retirement arrangement distribution: $15,200 (reported on 4.7% of returns)
77901:
$15,200
Texas:
$24,740
(% of AGI for various income ranges: 25.5% for AGIs below $25k, 40.1% for AGIs $25k-50k, 113.0% for AGIs $50k-75k, 201.8% for AGIs $75k-100k, 374.0% for AGIs $100k-200k, 4668.3% for AGIs over 200k)
Self-employed (Keogh) retirement plans: $24,900 (reported on 0.1% of returns)
77901:
$24,900
Texas:
$29,298
(% of AGI for various income ranges: 64.7% for AGIs $75k-100k)
Total itemized deductions: $34,164 (reported on 2.4% of returns)
Here:
$34,164
State:
$40,428
(% of AGI for various income ranges: 12.9% for AGIs below $25k, 54.2% for AGIs $25k-50k, 145.3% for AGIs $50k-75k, 217.9% for AGIs $75k-100k, 556.3% for AGIs $100k-200k, 4726.7% for AGIs over 200k)
Charity contributions: $12,769 (reported on 1.8% of returns)
Here:
$12,769
State:
$18,201
(% of AGI for various income ranges: 9.9% for AGIs $25k-50k, 26.5% for AGIs $50k-75k, 52.6% for AGIs $75k-100k, 152.3% for AGIs $100k-200k, 2771.7% for AGIs over 200k)
Taxes paid: $5,472 (reported on 2.2% of returns)
77901:
$5,472
State:
$7,821
(% of AGI for various income ranges: 1.0% for AGIs below $25k, 6.0% for AGIs $25k-50k, 25.0% for AGIs $50k-75k, 35.5% for AGIs $75k-100k, 91.2% for AGIs $100k-200k, 713.3% for AGIs over 200k)
Earned income credit: $2,695 (reported on 29.6% of returns)
Here:
$2,695
State:
$2,584
(% of AGI for various income ranges: 154.3% for AGIs below $25k, 93.9% for AGIs $25k-50k, 1.7% for AGIs $50k-75k)
Percentage of individuals using paid preparers for their 2020 taxes: 93.8%
Here:
94%
State:
92%
(% for various income ranges: 93.7% for AGIs below $25k, 93.9% for AGIs $25k-50k, 94.0% for AGIs $50k-75k, 93.5% for AGIs $75k-100k, 93.6% for AGIs $100k-200k, 94.4% for AGIs over 200k)
Averages for the 2012 tax year for zip code 77901, filed in 2013:
Average Adjusted Gross Income (AGI) in 2012: $39,111 (Individual Income Tax Returns)
Here:
$39,111
State:
$65,384
Salary/wage: $34,484 (reported on 89.9% of returns)
Here:
$34,484
State:
$52,524
(% of AGI for various income ranges: 85.2% for AGIs below $25k, 87.9% for AGIs $25k-50k, 84.9% for AGIs $50k-75k, 83.9% for AGIs $75k-100k, 79.2% for AGIs $100k-200k, 39.9% for AGIs over 200k)
Taxable interest for individuals: $1,110 (reported on 15.4% of returns)
This zip code:
$1,110
Texas:
$2,372
(% of AGI for various income ranges: 0.4% for AGIs below $25k, 0.3% for AGIs $25k-50k, 0.4% for AGIs $50k-75k, 0.4% for AGIs $75k-100k, 0.5% for AGIs $100k-200k, 0.7% for AGIs over 200k)
Ordinary dividends: $4,534 (reported on 7.6% of returns)
Here:
$4,534
State:
$9,721
(% of AGI for various income ranges: 0.5% for AGIs below $25k, 0.4% for AGIs $25k-50k, 0.7% for AGIs $50k-75k, 0.8% for AGIs $75k-100k, 1.4% for AGIs $100k-200k, 2.0% for AGIs over 200k)
Net capital gain/loss in AGI: +$8,014 (reported on 5.4% of returns)
Here:
+$8,014
State:
+$35,319
(% of AGI for various income ranges: 0.4% for AGIs $50k-75k, 0.3% for AGIs $75k-100k, 1.1% for AGIs $100k-200k, 6.6% for AGIs over 200k)
Profit/loss from business: +$11,752 (reported on 12.9% of returns)
Here:
+$11,752
State:
+$13,732
(% of AGI for various income ranges: 6.8% for AGIs below $25k, 1.9% for AGIs $25k-50k, 1.7% for AGIs $50k-75k, 1.2% for AGIs $75k-100k, 4.6% for AGIs $100k-200k, 8.6% for AGIs over 200k)
Taxable individual retirement arrangement distribution: $12,689 (reported on 5.5% of returns)
77901:
$12,689
Texas:
$19,511
(% of AGI for various income ranges: 1.2% for AGIs below $25k, 1.3% for AGIs $25k-50k, 1.6% for AGIs $50k-75k, 2.0% for AGIs $75k-100k, 2.4% for AGIs $100k-200k, 2.5% for AGIs over 200k)
Self-employment retirement plans: $17,450 (reported on 0.2% of returns)
77901:
$17,450
Texas:
$23,938
Total itemized deductions: $19,522 (20% of AGI, reported on 10.7% of returns)
Here:
$19,522
State:
$24,724
Here:
19.7% of AGI
State:
15.9% of AGI
(% of AGI for various income ranges: 2.6% for AGIs below $25k, 4.0% for AGIs $25k-50k, 6.0% for AGIs $50k-75k, 6.8% for AGIs $75k-100k, 7.5% for AGIs $100k-200k, 6.1% for AGIs over 200k)
Charity contributions: $4,924 (reported on 7.3% of returns)
Here:
$4,924
State:
$6,808
(% of AGI for various income ranges: 0.3% for AGIs below $25k, 0.4% for AGIs $25k-50k, 0.9% for AGIs $50k-75k, 1.1% for AGIs $75k-100k, 1.3% for AGIs $100k-200k, 2.1% for AGIs over 200k)
Taxes paid: $4,718 (reported on 10.1% of returns)
77901:
$4,718
State:
$6,921
(% of AGI for various income ranges: 0.4% for AGIs below $25k, 0.8% for AGIs $25k-50k, 1.1% for AGIs $50k-75k, 1.5% for AGIs $75k-100k, 2.1% for AGIs $100k-200k, 2.0% for AGIs over 200k)
Earned income credit: $2,581 (reported on 31.9% of returns)
Here:
$2,581
State:
$2,570
(% of AGI for various income ranges: 10.4% for AGIs below $25k, 1.5% for AGIs $25k-50k)
Percentage of individuals using paid preparers for their 2012 taxes: 49.1%
Here:
49%
State:
51%
(% for various income ranges: 47.1% for AGIs below $25k, 47.0% for AGIs $25k-50k, 50.7% for AGIs $50k-75k, 55.7% for AGIs $75k-100k, 61.9% for AGIs $100k-200k, 83.3% for AGIs over 200k)
Averages for the 2004 tax year for zip code 77901, filed in 2005:
Average Adjusted Gross Income (AGI) in 2004: $32,209 (Individual Income Tax Returns)
Here:
$32,209
State:
$47,881
Salary/wage: $26,854 (reported on 88.0% of returns)
Here:
$26,854
State:
$41,947
(% of AGI for various income ranges: 96.5% for AGIs below $10k, 86.4% for AGIs $10k-25k, 85.8% for AGIs $25k-50k, 80.9% for AGIs $50k-75k, 79.3% for AGIs $75k-100k, 38.5% for AGIs over 100k)
Taxable interest for individuals: $2,388 (reported on 22.6% of returns)
This zip code:
$2,388
Texas:
$2,255
(% of AGI for various income ranges: 2.6% for AGIs below $10k, 1.2% for AGIs $10k-25k, 1.1% for AGIs $25k-50k, 1.4% for AGIs $50k-75k, 1.4% for AGIs $75k-100k, 2.9% for AGIs over 100k)
Taxable dividends: $7,401 (reported on 10.7% of returns)
Here:
$7,401
State:
$4,261
(% of AGI for various income ranges: 1.5% for AGIs below $10k, 0.5% for AGIs $10k-25k, 0.6% for AGIs $25k-50k, 0.8% for AGIs $50k-75k, 0.9% for AGIs $75k-100k, 8.0% for AGIs over 100k)
Net capital gain/loss: +$9,692 (reported on 8.1% of returns)
Here:
+$9,692
State:
+$16,110
(% of AGI for various income ranges: -0.1% for AGIs below $10k, 0.2% for AGIs $10k-25k, 0.3% for AGIs $25k-50k, 0.7% for AGIs $50k-75k, 0.7% for AGIs $75k-100k, 8.8% for AGIs over 100k)
Profit/loss from business: +$10,886 (reported on 11.6% of returns)
Here:
+$10,886
State:
+$11,013
(% of AGI for various income ranges: 4.4% for AGIs below $10k, 3.8% for AGIs $10k-25k, 1.7% for AGIs $25k-50k, 1.7% for AGIs $50k-75k, 3.1% for AGIs $75k-100k, 8.3% for AGIs over 100k)
IRA payment deduction: $2,787 (reported on 1.2% of returns)
77901:
$2,787
Texas:
$3,120
(% of AGI for various income ranges: 0.2% for AGIs below $10k, 0.1% for AGIs $10k-25k, 0.1% for AGIs $25k-50k, 0.2% for AGIs $50k-75k, 0.1% for AGIs $75k-100k, 0.1% for AGIs over 100k)
Self-employed pension: $15,537 (reported on 0.3% of returns)
Here:
$15,537
Texas:
$16,401
Total itemized deductions: $17,695 (18% of AGI, reported on 10.2% of returns)
Here:
$17,695
State:
$19,631
Here:
18.1% of AGI
State:
18.9% of AGI
(% of AGI for various income ranges: 2.8% for AGIs below $10k, 3.2% for AGIs $10k-25k, 4.8% for AGIs $25k-50k, 6.3% for AGIs $50k-75k, 7.5% for AGIs $75k-100k, 7.3% for AGIs over 100k)
Charity contributions deductions: $5,411 (5% of AGI, reported on 8.1% of returns)
Here:
$5,411
State:
$4,753
Here:
4.9% of AGI
State:
4.2% of AGI
(% of AGI for various income ranges: 0.2% for AGIs below $10k, 0.3% for AGIs $10k-25k, 0.7% for AGIs $25k-50k, 1.2% for AGIs $50k-75k, 1.3% for AGIs $75k-100k, 3.2% for AGIs over 100k)
Total tax: $5,481 (reported on 60.4% of returns)
77901:
$5,481
State:
$9,058
(% of AGI for various income ranges: 2.2% for AGIs below $10k, 3.0% for AGIs $10k-25k, 6.1% for AGIs $25k-50k, 9.2% for AGIs $50k-75k, 11.4% for AGIs $75k-100k, 22.0% for AGIs over 100k)
Earned income credit: $2,105 (reported on 34.9% of returns)
Here:
$2,105
State:
$2,024
Percentage of individuals using paid preparers for their 2004 taxes: 57.0%
Here:
57%
State:
57%
(% for various income ranges: 52.8% for AGIs below $10k, 59.6% for AGIs $10k-25k, 55.4% for AGIs $25k-50k, 57.2% for AGIs $50k-75k, 58.9% for AGIs $75k-100k, 73.5% for AGIs over 100k)
Likely homosexual households (counted as self-reported same-sex unmarried-partner households)
Lesbian couples: 0.7% of all households
Gay men: 0.3% of all households
Household received Food Stamps/SNAP in the past 12 months: 3,722 Household did not receive Food Stamps/SNAP in the past 12 months: 12,122
Women who had a birth in the past 12 months: 607 (217 now married, 379 unmarried) Women who did not have a birth in the past 12 months: 9,745 (3,746 now married, 6,015 unmarried)
Housing units in zip code 77901 with a mortgage: 4,334 (66 second mortgage, 4 home equity loan, 23 both second mortgage and home equity loan) Houses without a mortgage: 61
Median monthly owner costs for units with a mortgage: $1,403 Median monthly owner costs for units without a mortgage: $508
Residents with income below the poverty level in 2022:
This zip code:
23.8%
Whole state:
14.0%
Residents with income below 50% of the poverty level in 2022:
This zip code:
15.4%
Whole state:
7.4%
Median number of rooms in houses and condos:
Here:
5.7
State:
6.3
Median number of rooms in apartments:
Here:
4.1
State:
4.0
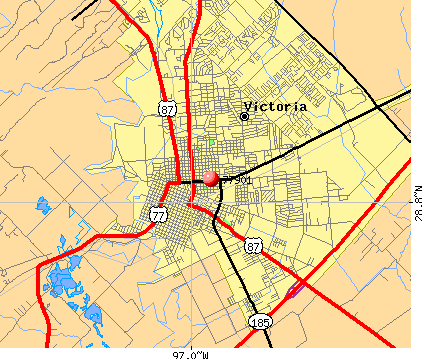
Notable locations in this zip code not listed on our city pages
Notable locations in zip code 77901: Riverside Golf Course (A), South Bridge Street Historic District (B), Texas Company Filling Station (C), Victoria Grist Windmill (D), DeLeon Plaza and Bandstand (E), City of Victoria Pumping Plant and Waterworks (F), Victoria County Courthouse (G), Victoria Fire Department Station 1 (H), E J Jecker House (I), E J Fossati House (J), E H D Bendt House (K), Farmers and Merchants Cotton Gin Warehouse (L), F H Crain House (M), Fleming-Welder House (N), Frank Alonso House (O), George H Hauschild Building (P), George and Adele Hauschild House (Q), Gaylord-Levy House (R), Fred Urban House (S), Gramann House (T). Display/hide their locations on the map
Churches in zip code 77901 include: Trinity Church (A), Saint Marys Catholic Church (B), Webster Chapel United Methodist Church (C), Our Lady of Lourdes Church (D), Presbyterian Iglesia Nicea Church (E), B'nai Israel (F), Saint Joseph Church (G), Grace Lutheran Church (H), Saint Francis Episcopal Church (I). Display/hide their locations on the map
Parks in zip code 77901 include: Hopkins Park (1), Riverside Park (2), Memorial Park (3), Riverside Park (4), Patti Welder Stadium (5), Memorial Stadium (6). Display/hide their locations on the map
4,713 married couples with children.
3,616 single-parent households (1,115 men, 2,501 women).
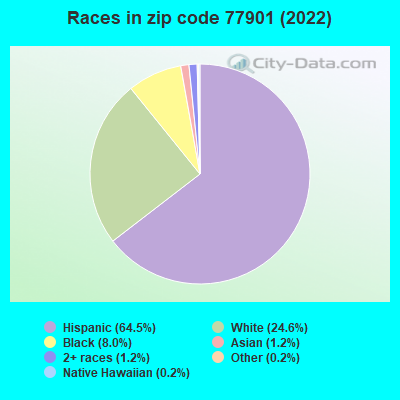
64.8% of residents of 77901 zip code speak English at home.
33.7% of residents speak Spanish at home (76% very well, 10% well, 9% not well, 5% not at all).
0.1% of residents speak other Indo-European language at home (93% very well, 7% well).
1.2% of residents speak Asian or Pacific Island language at home (47% very well, 30% well, 23% not well).
0.2% of residents speak other language at home (88% very well, 12% well).
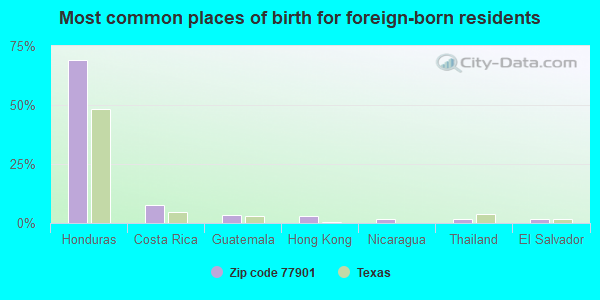
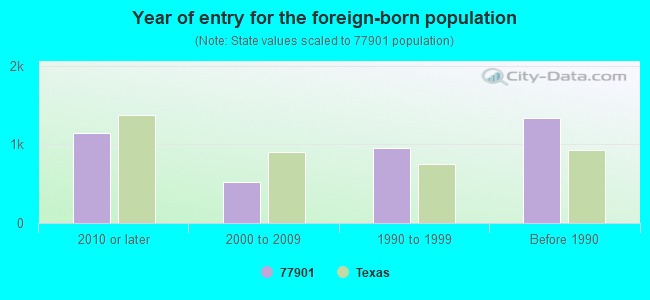
Foreign born population: 3,667 (8.9%) (34.6% of them are naturalized citizens)
Facilities with environmental interests located in this zip code:
AAMCO TRANSMISSIONS (1010 E RIO GRANDE ST in VICTORIA, TX)
(Resource Conservation and Recovery Act (tracking hazardous waste))
AEP TEXAS CENTRAL COMPANY (102 E CRESTWOOD DR in VICTORIA, TX)
(Resource Conservation and Recovery Act (tracking hazardous waste)) Alternative names: CENTRAL PWR & LGHT VICTORIA SVC CTR
ANDERSON MACHINERY CO (201 W RIO GRANDE in VICTORIA, TX)
(Resource Conservation and Recovery Act (tracking hazardous waste)) Organizations: ANDERSON MACHINERY COMPANY (CONTACT/OWNER)
ANADRILL SCHLUMBERGER (3901 E RED RIVER in VICTORIA, TX)
(Resource Conservation and Recovery Act (tracking hazardous waste)) Business NAICS classification: OIL AND GAS FIELD MACHINERY AND EQUIPMENT MANUFACTURING. Alternative names: FLOPETROL JOHNSTON SCHLUMBERGER
AUTO BODY REPAIR OF VICTORIA INC (1212 SAM HOUSTON DR in VICTORIA, TX)
(Resource Conservation and Recovery Act (tracking hazardous waste)) Alternative names: AUTO REPAIR OF VICTORIA
AIRGAS SOUTHWEST INC. (203 N. BEN JORDAN in VICTORIA, TX)
TRI REPORTER (Tracking of toxic chemicals releasing facilities) Business SIC classification: INDUSTRIAL GASES; CHEMICALS AND ALLIED PRODUCTS
Housing units lacking complete plumbing facilities: 3.1% Housing units lacking complete kitchen facilities: 8.1%
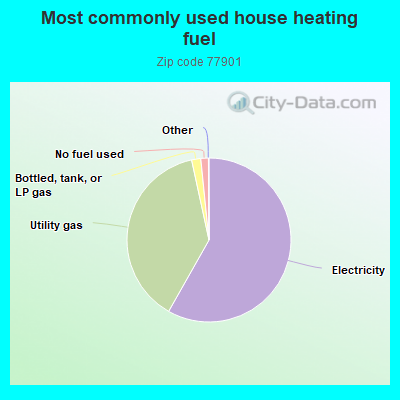
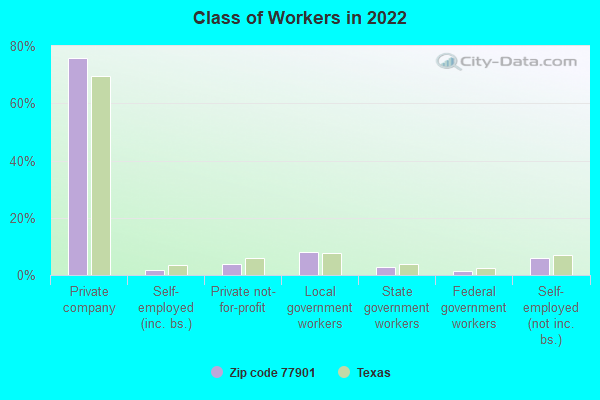
58.2%Electricity
38.4%Utility gas
1.8%Bottled, tank, or LP gas
1.5%No fuel used
Population in 1990: 50,119.
Place of birth for U.S.-born residents:
This state: 32,581
Northeast: 562
Midwest: 947
South: 1,598
West: 1,184
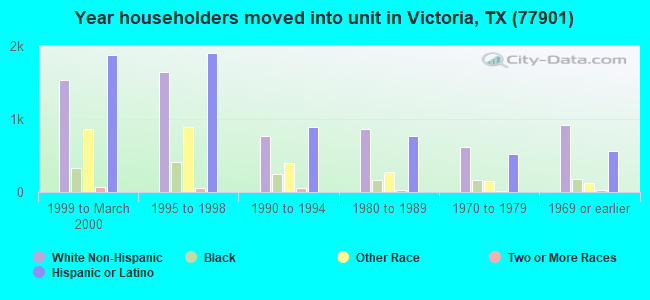
49% of the 77901 zip code residents lived in the same house 5 years ago. Out of people who lived in different houses, 67% lived in this county. Out of people who lived in different counties, 50% lived in Texas.
84% of the 77901 zip code residents lived in the same house 1 year ago. Out of people who lived in different houses, 59% moved from this county. Out of people who lived in different houses, 31% moved from different county within same state. Out of people who lived in different houses, 6% moved from different state. Out of people who lived in different houses, 1% moved from abroad.
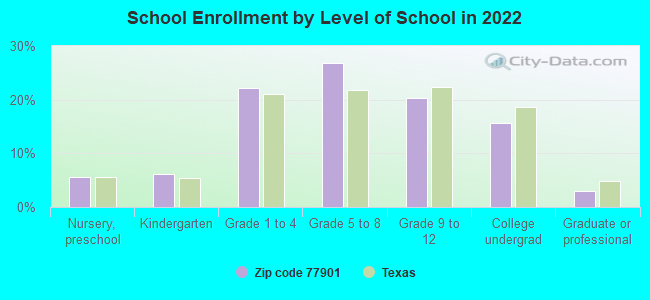
Private vs. public school enrollment:
Students in private schools in grades 1 to 8 (elementary and middle school): 655
Here:
13.4%
Texas:
8.8%
Students in private schools in grades 9 to 12 (high school): 226
Here:
11.2%
Texas:
8.0%
Students in private undergraduate colleges: 107
Here:
6.9%
Texas:
16.2%
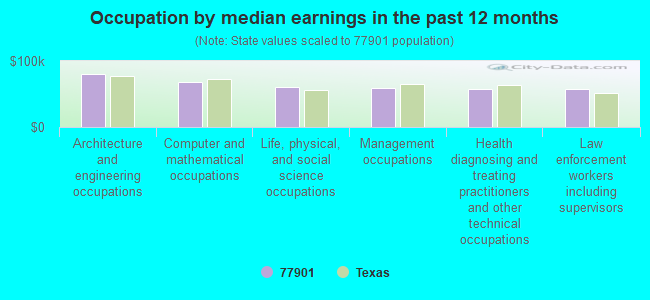
Occupation by median earnings in the past 12 months ($)
80,972Architecture and engineering occupations
68,645Computer and mathematical occupations
60,852Life, physical, and social science occupations
59,398Management occupations
58,135Health diagnosing and treating practitioners and other technical occupations
57,493Law enforcement workers including supervisors
Companies with federal contracts located in this zip code (VICTORIA, TX):
VMW INDUSTRIES INC (7303 HOUSTON HWY; small business) : $385,242 in 3 contractsin 2000
$286,272 with Navy for Miscellaneous Special Industry Machinery. Signed on 2000-07-06. Completion date: 2000-10-06.
$68,970 with Navy for Marine Lifesaving and Diving Equipment. Signed on 2000-03-15. Completion date: 2000-06-30.
$30,000 with Air Force for Maintenance, Repair and Rebuilding of Equipment -- Instruments and Laboratory Equipment. Signed on 2000-09-30. Completion date: 2000-09-30.
MID COAST ELECTRIC SUPPLY INC (1801 STOLZ ST; small business) : $207,195 in 14 contractsfrom 2003 to 2006
Contracts for Miscellaneous Electrical and Electronic Components, Torque Converters and Speed Changers, ADP Software, Coils and Transformers, and moreby Army Signed by year:2000: $0; 2001: $0; 2002: $0; 2003: $117,848; 2004: $18,229; 2005: $49,812; 2006: $21,306.
Biggest contracts:
$75,848 with Army for Miscellaneous Electrical and Electronic Components. Signed on 2003-09-26. Completion date: 2003-12-12.
$44,447, same as above.Signed on 2005-10-24. Completion date: 2005-11-18.
$42,000 with Army for Torque Converters and Speed Changers. Signed on 2003-02-04. Completion date: 2003-04-11.
$5,429 with Army for ADP Software. Signed on 2004-08-03. Completion date: 2004-08-06.
A-Z SURPLUS, INC (602 N BLUFF ST; small business) : $73,061 in 11 contractsfrom 2005 to 2006
Contracts for Fuel Burning Equipment Units, Miscellaneous Power Transmission Equipment, Pressure, Temperature, and Humidity Measuring and Controlling Instruments, Water Distillation Equipment, Marine and Industrial, and moreby Defense Logistics Agency, Navy Signed by year:2000: $0; 2001: $0; 2002: $0; 2003: $0; 2004: $0; 2005: $59,661; 2006: $13,400.
Biggest contracts:
$16,800 with Defense Logistics Agency for Fuel Burning Equipment Units. Signed on 2005-11-16. Completion date: 2005-12-17.
$13,400 with Defense Logistics Agency for Miscellaneous Power Transmission Equipment. Signed on 2006-06-15. Completion date: 2006-07-30.
$9,000 with Defense Logistics Agency for Pressure, Temperature, and Humidity Measuring and Controlling Instruments. Taking place in CA. Signed on 2005-01-20. Completion date: 2005-02-20.
$8,000 with Defense Logistics Agency for Water Distillation Equipment, Marine and Industrial. Signed on 2005-11-09. Completion date: 2005-12-10.
VICTORY AIR AND EQUIPMENT, INC (903 PROFIT DR; small business)
$60,746 with Air Force for Installation of Equipment -- Pumps and Compressors. Signed on 2001-09-18. Completion date: 2001-09-18.
VICTORIA MARINE (8001 HOUSTON HWY; small business)
$24,926 with Navy for Ship and Boat Propulsion Components. Signed on 2005-08-23. Completion date: 2005-08-31.
PATEL, VINOD (2605 HOUSTON HIGHWAY; small business) : $7,551 in 3 contractsin 2004
$4,290 with Army for Lodging - Hotel/Motel. Signed on 2004-04-15. Completion date: 2004-04-19.
$3,186, same as above.Signed on 2004-04-15. Completion date: 2004-04-19.
$75, same as above.Signed on 2004-04-21. Completion date: 2004-04-21.
FORREST PLACE SUITES (201 E STAYTON AVE; small business)
$5,120 with Army for Lodging - Hotel/Motel. Signed on 2002-04-04. Completion date: 2002-05-31.
VICTORIA COMMUNICATION SERVICE (3202 N NAVARRO ST; small business)
$4,921 with Army for ADP Support Equipment. Signed on 2004-07-27. Completion date: 2004-08-27.
MALIK CABLE DEVICES CO (1007 N WILLIAM ST; small business)
$4,587 with Air Force for Miscellaneous Aircraft Accessories and Components. Signed on 2003-09-17. Completion date: 2003-10-11.
Top industries in this zip code by the number of employees in 2005:
Health Care and Social Assistance: General Medical and Surgical Hospitals (over 1000 employees: 1 establishment)
Health Care and Social Assistance: Home Health Care Services (250-499: 1, 100-249: 2, 50-99: 1, 20-49: 1, 5-9: 2, 1-4: 1)
2002 - 2018 National Fire Incident Reporting System (NFIRS) incidents
Based on the data from the years 2002 - 2018 the average number of fires per year is 201. The highest number of fires - 273 took place in 2002, and the least - 128 in 2015. The data has a declining trend.
When looking into fire subcategories, the most incidents belonged to: Outside Fires (49.3%), and Structure Fires (33.9%).
Fire incident types reported to NFIRS in Zip Code 77901


 Nearest zip codes: 77905, 77988, 77904, 77968, 77951, 77976.


 Based on the data from the years 2002 - 2018 the average number of fires per year is 201. The highest number of fires - 273 took place in 2002, and the least - 128 in 2015. The data has a declining trend.
 When looking into fire subcategories, the most incidents belonged to: Outside Fires (49.3%), and Structure Fires (33.9%).