Victoria, Texas Submit your own pictures of this city and show them to the world
OSM Map
General Map
Google Map
MSN Map
OSM Map
General Map
Google Map
MSN Map
OSM Map
General Map
Google Map
MSN Map
OSM Map
General Map
Google Map
MSN Map
Please wait while loading the map...
Population in 2022: 65,372 (98% urban, 2% rural). Population change since 2000: +7.9%Males: 33,718 Females: 31,654
March 2022 cost of living index in Victoria: 84.2 (less than average, U.S. average is 100) Percentage of residents living in poverty in 2022: 18.5%for White Non-Hispanic residents , 28.9% for Black residents , 16.4% for Hispanic or Latino residents , 26.0% for American Indian residents , 8.6% for other race residents , 19.3% for two or more races residents )
Profiles of local businesses
Business Search - 14 Million verified businesses
Data:
Median household income ($)
Median household income (% change since 2000)
Household income diversity
Ratio of average income to average house value (%)
Ratio of average income to average rent
Median household income ($) - White
Median household income ($) - Black or African American
Median household income ($) - Asian
Median household income ($) - Hispanic or Latino
Median household income ($) - American Indian and Alaska Native
Median household income ($) - Multirace
Median household income ($) - Other Race
Median household income for houses/condos with a mortgage ($)
Median household income for apartments without a mortgage ($)
Races - White alone (%)
Races - White alone (% change since 2000)
Races - Black alone (%)
Races - Black alone (% change since 2000)
Races - American Indian alone (%)
Races - American Indian alone (% change since 2000)
Races - Asian alone (%)
Races - Asian alone (% change since 2000)
Races - Hispanic (%)
Races - Hispanic (% change since 2000)
Races - Native Hawaiian and Other Pacific Islander alone (%)
Races - Native Hawaiian and Other Pacific Islander alone (% change since 2000)
Races - Two or more races (%)
Races - Two or more races (% change since 2000)
Races - Other race alone (%)
Races - Other race alone (% change since 2000)
Racial diversity
Unemployment (%)
Unemployment (% change since 2000)
Unemployment (%) - White
Unemployment (%) - Black or African American
Unemployment (%) - Asian
Unemployment (%) - Hispanic or Latino
Unemployment (%) - American Indian and Alaska Native
Unemployment (%) - Multirace
Unemployment (%) - Other Race
Population density (people per square mile)
Population - Males (%)
Population - Females (%)
Population - Males (%) - White
Population - Males (%) - Black or African American
Population - Males (%) - Asian
Population - Males (%) - Hispanic or Latino
Population - Males (%) - American Indian and Alaska Native
Population - Males (%) - Multirace
Population - Males (%) - Other Race
Population - Females (%) - White
Population - Females (%) - Black or African American
Population - Females (%) - Asian
Population - Females (%) - Hispanic or Latino
Population - Females (%) - American Indian and Alaska Native
Population - Females (%) - Multirace
Population - Females (%) - Other Race
Coronavirus confirmed cases (Apr 27, 2024)
Deaths caused by coronavirus (Apr 27, 2024)
Coronavirus confirmed cases (per 100k population) (Apr 27, 2024)
Deaths caused by coronavirus (per 100k population) (Apr 27, 2024)
Daily increase in number of cases (Apr 27, 2024)
Weekly increase in number of cases (Apr 27, 2024)
Cases doubled (in days) (Apr 27, 2024)
Hospitalized patients (Apr 18, 2022)
Negative test results (Apr 18, 2022)
Total test results (Apr 18, 2022)
COVID Vaccine doses distributed (per 100k population) (Sep 19, 2023)
COVID Vaccine doses administered (per 100k population) (Sep 19, 2023)
COVID Vaccine doses distributed (Sep 19, 2023)
COVID Vaccine doses administered (Sep 19, 2023)
Likely homosexual households (%)
Likely homosexual households (% change since 2000)
Likely homosexual households - Lesbian couples (%)
Likely homosexual households - Lesbian couples (% change since 2000)
Likely homosexual households - Gay men (%)
Likely homosexual households - Gay men (% change since 2000)
Cost of living index
Median gross rent ($)
Median contract rent ($)
Median monthly housing costs ($)
Median house or condo value ($)
Median house or condo value ($ change since 2000)
Mean house or condo value by units in structure - 1, detached ($)
Mean house or condo value by units in structure - 1, attached ($)
Mean house or condo value by units in structure - 2 ($)
Mean house or condo value by units in structure by units in structure - 3 or 4 ($)
Mean house or condo value by units in structure - 5 or more ($)
Mean house or condo value by units in structure - Boat, RV, van, etc. ($)
Mean house or condo value by units in structure - Mobile home ($)
Median house or condo value ($) - White
Median house or condo value ($) - Black or African American
Median house or condo value ($) - Asian
Median house or condo value ($) - Hispanic or Latino
Median house or condo value ($) - American Indian and Alaska Native
Median house or condo value ($) - Multirace
Median house or condo value ($) - Other Race
Median resident age
Resident age diversity
Median resident age - Males
Median resident age - Females
Median resident age - White
Median resident age - Black or African American
Median resident age - Asian
Median resident age - Hispanic or Latino
Median resident age - American Indian and Alaska Native
Median resident age - Multirace
Median resident age - Other Race
Median resident age - Males - White
Median resident age - Males - Black or African American
Median resident age - Males - Asian
Median resident age - Males - Hispanic or Latino
Median resident age - Males - American Indian and Alaska Native
Median resident age - Males - Multirace
Median resident age - Males - Other Race
Median resident age - Females - White
Median resident age - Females - Black or African American
Median resident age - Females - Asian
Median resident age - Females - Hispanic or Latino
Median resident age - Females - American Indian and Alaska Native
Median resident age - Females - Multirace
Median resident age - Females - Other Race
Commute - mean travel time to work (minutes)
Travel time to work - Less than 5 minutes (%)
Travel time to work - Less than 5 minutes (% change since 2000)
Travel time to work - 5 to 9 minutes (%)
Travel time to work - 5 to 9 minutes (% change since 2000)
Travel time to work - 10 to 19 minutes (%)
Travel time to work - 10 to 19 minutes (% change since 2000)
Travel time to work - 20 to 29 minutes (%)
Travel time to work - 20 to 29 minutes (% change since 2000)
Travel time to work - 30 to 39 minutes (%)
Travel time to work - 30 to 39 minutes (% change since 2000)
Travel time to work - 40 to 59 minutes (%)
Travel time to work - 40 to 59 minutes (% change since 2000)
Travel time to work - 60 to 89 minutes (%)
Travel time to work - 60 to 89 minutes (% change since 2000)
Travel time to work - 90 or more minutes (%)
Travel time to work - 90 or more minutes (% change since 2000)
Marital status - Never married (%)
Marital status - Now married (%)
Marital status - Separated (%)
Marital status - Widowed (%)
Marital status - Divorced (%)
Median family income ($)
Median family income (% change since 2000)
Median non-family income ($)
Median non-family income (% change since 2000)
Median per capita income ($)
Median per capita income (% change since 2000)
Median family income ($) - White
Median family income ($) - Black or African American
Median family income ($) - Asian
Median family income ($) - Hispanic or Latino
Median family income ($) - American Indian and Alaska Native
Median family income ($) - Multirace
Median family income ($) - Other Race
Median year house/condo built
Median year apartment built
Year house built - Built 2005 or later (%)
Year house built - Built 2000 to 2004 (%)
Year house built - Built 1990 to 1999 (%)
Year house built - Built 1980 to 1989 (%)
Year house built - Built 1970 to 1979 (%)
Year house built - Built 1960 to 1969 (%)
Year house built - Built 1950 to 1959 (%)
Year house built - Built 1940 to 1949 (%)
Year house built - Built 1939 or earlier (%)
Average household size
Household density (households per square mile)
Average household size - White
Average household size - Black or African American
Average household size - Asian
Average household size - Hispanic or Latino
Average household size - American Indian and Alaska Native
Average household size - Multirace
Average household size - Other Race
Occupied housing units (%)
Vacant housing units (%)
Owner occupied housing units (%)
Renter occupied housing units (%)
Vacancy status - For rent (%)
Vacancy status - For sale only (%)
Vacancy status - Rented or sold, not occupied (%)
Vacancy status - For seasonal, recreational, or occasional use (%)
Vacancy status - For migrant workers (%)
Vacancy status - Other vacant (%)
Residents with income below the poverty level (%)
Residents with income below 50% of the poverty level (%)
Children below poverty level (%)
Poor families by family type - Married-couple family (%)
Poor families by family type - Male, no wife present (%)
Poor families by family type - Female, no husband present (%)
Poverty status for native-born residents (%)
Poverty status for foreign-born residents (%)
Poverty among high school graduates not in families (%)
Poverty among people who did not graduate high school not in families (%)
Residents with income below the poverty level (%) - White
Residents with income below the poverty level (%) - Black or African American
Residents with income below the poverty level (%) - Asian
Residents with income below the poverty level (%) - Hispanic or Latino
Residents with income below the poverty level (%) - American Indian and Alaska Native
Residents with income below the poverty level (%) - Multirace
Residents with income below the poverty level (%) - Other Race
Air pollution - Air Quality Index (AQI)
Air pollution - CO
Air pollution - NO2
Air pollution - SO2
Air pollution - Ozone
Air pollution - PM10
Air pollution - PM25
Air pollution - Pb
Crime - Murders per 100,000 population
Crime - Rapes per 100,000 population
Crime - Robberies per 100,000 population
Crime - Assaults per 100,000 population
Crime - Burglaries per 100,000 population
Crime - Thefts per 100,000 population
Crime - Auto thefts per 100,000 population
Crime - Arson per 100,000 population
Crime - City-data.com crime index
Crime - Violent crime index
Crime - Property crime index
Crime - Murders per 100,000 population (5 year average)
Crime - Rapes per 100,000 population (5 year average)
Crime - Robberies per 100,000 population (5 year average)
Crime - Assaults per 100,000 population (5 year average)
Crime - Burglaries per 100,000 population (5 year average)
Crime - Thefts per 100,000 population (5 year average)
Crime - Auto thefts per 100,000 population (5 year average)
Crime - Arson per 100,000 population (5 year average)
Crime - City-data.com crime index (5 year average)
Crime - Violent crime index (5 year average)
Crime - Property crime index (5 year average)
1996 Presidential Elections Results (%) - Democratic Party (Clinton)
1996 Presidential Elections Results (%) - Republican Party (Dole)
1996 Presidential Elections Results (%) - Other
2000 Presidential Elections Results (%) - Democratic Party (Gore)
2000 Presidential Elections Results (%) - Republican Party (Bush)
2000 Presidential Elections Results (%) - Other
2004 Presidential Elections Results (%) - Democratic Party (Kerry)
2004 Presidential Elections Results (%) - Republican Party (Bush)
2004 Presidential Elections Results (%) - Other
2008 Presidential Elections Results (%) - Democratic Party (Obama)
2008 Presidential Elections Results (%) - Republican Party (McCain)
2008 Presidential Elections Results (%) - Other
2012 Presidential Elections Results (%) - Democratic Party (Obama)
2012 Presidential Elections Results (%) - Republican Party (Romney)
2012 Presidential Elections Results (%) - Other
2016 Presidential Elections Results (%) - Democratic Party (Clinton)
2016 Presidential Elections Results (%) - Republican Party (Trump)
2016 Presidential Elections Results (%) - Other
2020 Presidential Elections Results (%) - Democratic Party (Biden)
2020 Presidential Elections Results (%) - Republican Party (Trump)
2020 Presidential Elections Results (%) - Other
Ancestries Reported - Arab (%)
Ancestries Reported - Czech (%)
Ancestries Reported - Danish (%)
Ancestries Reported - Dutch (%)
Ancestries Reported - English (%)
Ancestries Reported - French (%)
Ancestries Reported - French Canadian (%)
Ancestries Reported - German (%)
Ancestries Reported - Greek (%)
Ancestries Reported - Hungarian (%)
Ancestries Reported - Irish (%)
Ancestries Reported - Italian (%)
Ancestries Reported - Lithuanian (%)
Ancestries Reported - Norwegian (%)
Ancestries Reported - Polish (%)
Ancestries Reported - Portuguese (%)
Ancestries Reported - Russian (%)
Ancestries Reported - Scotch-Irish (%)
Ancestries Reported - Scottish (%)
Ancestries Reported - Slovak (%)
Ancestries Reported - Subsaharan African (%)
Ancestries Reported - Swedish (%)
Ancestries Reported - Swiss (%)
Ancestries Reported - Ukrainian (%)
Ancestries Reported - United States (%)
Ancestries Reported - Welsh (%)
Ancestries Reported - West Indian (%)
Ancestries Reported - Other (%)
Educational Attainment - No schooling completed (%)
Educational Attainment - Less than high school (%)
Educational Attainment - High school or equivalent (%)
Educational Attainment - Less than 1 year of college (%)
Educational Attainment - 1 or more years of college (%)
Educational Attainment - Associate degree (%)
Educational Attainment - Bachelor's degree (%)
Educational Attainment - Master's degree (%)
Educational Attainment - Professional school degree (%)
Educational Attainment - Doctorate degree (%)
School Enrollment - Nursery, preschool (%)
School Enrollment - Kindergarten (%)
School Enrollment - Grade 1 to 4 (%)
School Enrollment - Grade 5 to 8 (%)
School Enrollment - Grade 9 to 12 (%)
School Enrollment - College undergrad (%)
School Enrollment - Graduate or professional (%)
School Enrollment - Not enrolled in school (%)
School enrollment - Public schools (%)
School enrollment - Private schools (%)
School enrollment - Not enrolled (%)
Median number of rooms in houses and condos
Median number of rooms in apartments
Housing units lacking complete plumbing facilities (%)
Housing units lacking complete kitchen facilities (%)
Density of houses
Urban houses (%)
Rural houses (%)
Households with people 60 years and over (%)
Households with people 65 years and over (%)
Households with people 75 years and over (%)
Households with one or more nonrelatives (%)
Households with no nonrelatives (%)
Population in households (%)
Family households (%)
Nonfamily households (%)
Population in families (%)
Family households with own children (%)
Median number of bedrooms in owner occupied houses
Mean number of bedrooms in owner occupied houses
Median number of bedrooms in renter occupied houses
Mean number of bedrooms in renter occupied houses
Median number of vehichles in owner occupied houses
Mean number of vehichles in owner occupied houses
Median number of vehichles in renter occupied houses
Mean number of vehichles in renter occupied houses
Mortgage status - with mortgage (%)
Mortgage status - with second mortgage (%)
Mortgage status - with home equity loan (%)
Mortgage status - with both second mortgage and home equity loan (%)
Mortgage status - without a mortgage (%)
Average family size
Average family size - White
Average family size - Black or African American
Average family size - Asian
Average family size - Hispanic or Latino
Average family size - American Indian and Alaska Native
Average family size - Multirace
Average family size - Other Race
Geographical mobility - Same house 1 year ago (%)
Geographical mobility - Moved within same county (%)
Geographical mobility - Moved from different county within same state (%)
Geographical mobility - Moved from different state (%)
Geographical mobility - Moved from abroad (%)
Place of birth - Born in state of residence (%)
Place of birth - Born in other state (%)
Place of birth - Native, outside of US (%)
Place of birth - Foreign born (%)
Housing units in structures - 1, detached (%)
Housing units in structures - 1, attached (%)
Housing units in structures - 2 (%)
Housing units in structures - 3 or 4 (%)
Housing units in structures - 5 to 9 (%)
Housing units in structures - 10 to 19 (%)
Housing units in structures - 20 to 49 (%)
Housing units in structures - 50 or more (%)
Housing units in structures - Mobile home (%)
Housing units in structures - Boat, RV, van, etc. (%)
House/condo owner moved in on average (years ago)
Renter moved in on average (years ago)
Year householder moved into unit - Moved in 1999 to March 2000 (%)
Year householder moved into unit - Moved in 1995 to 1998 (%)
Year householder moved into unit - Moved in 1990 to 1994 (%)
Year householder moved into unit - Moved in 1980 to 1989 (%)
Year householder moved into unit - Moved in 1970 to 1979 (%)
Year householder moved into unit - Moved in 1969 or earlier (%)
Means of transportation to work - Drove car alone (%)
Means of transportation to work - Carpooled (%)
Means of transportation to work - Public transportation (%)
Means of transportation to work - Bus or trolley bus (%)
Means of transportation to work - Streetcar or trolley car (%)
Means of transportation to work - Subway or elevated (%)
Means of transportation to work - Railroad (%)
Means of transportation to work - Ferryboat (%)
Means of transportation to work - Taxicab (%)
Means of transportation to work - Motorcycle (%)
Means of transportation to work - Bicycle (%)
Means of transportation to work - Walked (%)
Means of transportation to work - Other means (%)
Working at home (%)
Industry diversity
Most Common Industries - Agriculture, forestry, fishing and hunting, and mining (%)
Most Common Industries - Agriculture, forestry, fishing and hunting (%)
Most Common Industries - Mining, quarrying, and oil and gas extraction (%)
Most Common Industries - Construction (%)
Most Common Industries - Manufacturing (%)
Most Common Industries - Wholesale trade (%)
Most Common Industries - Retail trade (%)
Most Common Industries - Transportation and warehousing, and utilities (%)
Most Common Industries - Transportation and warehousing (%)
Most Common Industries - Utilities (%)
Most Common Industries - Information (%)
Most Common Industries - Finance and insurance, and real estate and rental and leasing (%)
Most Common Industries - Finance and insurance (%)
Most Common Industries - Real estate and rental and leasing (%)
Most Common Industries - Professional, scientific, and management, and administrative and waste management services (%)
Most Common Industries - Professional, scientific, and technical services (%)
Most Common Industries - Management of companies and enterprises (%)
Most Common Industries - Administrative and support and waste management services (%)
Most Common Industries - Educational services, and health care and social assistance (%)
Most Common Industries - Educational services (%)
Most Common Industries - Health care and social assistance (%)
Most Common Industries - Arts, entertainment, and recreation, and accommodation and food services (%)
Most Common Industries - Arts, entertainment, and recreation (%)
Most Common Industries - Accommodation and food services (%)
Most Common Industries - Other services, except public administration (%)
Most Common Industries - Public administration (%)
Occupation diversity
Most Common Occupations - Management, business, science, and arts occupations (%)
Most Common Occupations - Management, business, and financial occupations (%)
Most Common Occupations - Management occupations (%)
Most Common Occupations - Business and financial operations occupations (%)
Most Common Occupations - Computer, engineering, and science occupations (%)
Most Common Occupations - Computer and mathematical occupations (%)
Most Common Occupations - Architecture and engineering occupations (%)
Most Common Occupations - Life, physical, and social science occupations (%)
Most Common Occupations - Education, legal, community service, arts, and media occupations (%)
Most Common Occupations - Community and social service occupations (%)
Most Common Occupations - Legal occupations (%)
Most Common Occupations - Education, training, and library occupations (%)
Most Common Occupations - Arts, design, entertainment, sports, and media occupations (%)
Most Common Occupations - Healthcare practitioners and technical occupations (%)
Most Common Occupations - Health diagnosing and treating practitioners and other technical occupations (%)
Most Common Occupations - Health technologists and technicians (%)
Most Common Occupations - Service occupations (%)
Most Common Occupations - Healthcare support occupations (%)
Most Common Occupations - Protective service occupations (%)
Most Common Occupations - Fire fighting and prevention, and other protective service workers including supervisors (%)
Most Common Occupations - Law enforcement workers including supervisors (%)
Most Common Occupations - Food preparation and serving related occupations (%)
Most Common Occupations - Building and grounds cleaning and maintenance occupations (%)
Most Common Occupations - Personal care and service occupations (%)
Most Common Occupations - Sales and office occupations (%)
Most Common Occupations - Sales and related occupations (%)
Most Common Occupations - Office and administrative support occupations (%)
Most Common Occupations - Natural resources, construction, and maintenance occupations (%)
Most Common Occupations - Farming, fishing, and forestry occupations (%)
Most Common Occupations - Construction and extraction occupations (%)
Most Common Occupations - Installation, maintenance, and repair occupations (%)
Most Common Occupations - Production, transportation, and material moving occupations (%)
Most Common Occupations - Production occupations (%)
Most Common Occupations - Transportation occupations (%)
Most Common Occupations - Material moving occupations (%)
People in Group quarters - Institutionalized population (%)
People in Group quarters - Correctional institutions (%)
People in Group quarters - Federal prisons and detention centers (%)
People in Group quarters - Halfway houses (%)
People in Group quarters - Local jails and other confinement facilities (including police lockups) (%)
People in Group quarters - Military disciplinary barracks (%)
People in Group quarters - State prisons (%)
People in Group quarters - Other types of correctional institutions (%)
People in Group quarters - Nursing homes (%)
People in Group quarters - Hospitals/wards, hospices, and schools for the handicapped (%)
People in Group quarters - Hospitals/wards and hospices for chronically ill (%)
People in Group quarters - Hospices or homes for chronically ill (%)
People in Group quarters - Military hospitals or wards for chronically ill (%)
People in Group quarters - Other hospitals or wards for chronically ill (%)
People in Group quarters - Hospitals or wards for drug/alcohol abuse (%)
People in Group quarters - Mental (Psychiatric) hospitals or wards (%)
People in Group quarters - Schools, hospitals, or wards for the mentally retarded (%)
People in Group quarters - Schools, hospitals, or wards for the physically handicapped (%)
People in Group quarters - Institutions for the deaf (%)
People in Group quarters - Institutions for the blind (%)
People in Group quarters - Orthopedic wards and institutions for the physically handicapped (%)
People in Group quarters - Wards in general hospitals for patients who have no usual home elsewhere (%)
People in Group quarters - Wards in military hospitals for patients who have no usual home elsewhere (%)
People in Group quarters - Juvenile institutions (%)
People in Group quarters - Long-term care (%)
People in Group quarters - Homes for abused, dependent, and neglected children (%)
People in Group quarters - Residential treatment centers for emotionally disturbed children (%)
People in Group quarters - Training schools for juvenile delinquents (%)
People in Group quarters - Short-term care, detention or diagnostic centers for delinquent children (%)
People in Group quarters - Type of juvenile institution unknown (%)
People in Group quarters - Noninstitutionalized population (%)
People in Group quarters - College dormitories (includes college quarters off campus) (%)
People in Group quarters - Military quarters (%)
People in Group quarters - On base (%)
People in Group quarters - Barracks, unaccompanied personnel housing (UPH), (Enlisted/Officer), ;and similar group living quarters for military personnel (%)
People in Group quarters - Transient quarters for temporary residents (%)
People in Group quarters - Military ships (%)
People in Group quarters - Group homes (%)
People in Group quarters - Homes or halfway houses for drug/alcohol abuse (%)
People in Group quarters - Homes for the mentally ill (%)
People in Group quarters - Homes for the mentally retarded (%)
People in Group quarters - Homes for the physically handicapped (%)
People in Group quarters - Other group homes (%)
People in Group quarters - Religious group quarters (%)
People in Group quarters - Dormitories (%)
People in Group quarters - Agriculture workers' dormitories on farms (%)
People in Group quarters - Job Corps and vocational training facilities (%)
People in Group quarters - Other workers' dormitories (%)
People in Group quarters - Crews of maritime vessels (%)
People in Group quarters - Other nonhousehold living situations (%)
People in Group quarters - Other noninstitutional group quarters (%)
Residents speaking English at home (%)
Residents speaking English at home - Born in the United States (%)
Residents speaking English at home - Native, born elsewhere (%)
Residents speaking English at home - Foreign born (%)
Residents speaking Spanish at home (%)
Residents speaking Spanish at home - Born in the United States (%)
Residents speaking Spanish at home - Native, born elsewhere (%)
Residents speaking Spanish at home - Foreign born (%)
Residents speaking other language at home (%)
Residents speaking other language at home - Born in the United States (%)
Residents speaking other language at home - Native, born elsewhere (%)
Residents speaking other language at home - Foreign born (%)
Class of Workers - Employee of private company (%)
Class of Workers - Self-employed in own incorporated business (%)
Class of Workers - Private not-for-profit wage and salary workers (%)
Class of Workers - Local government workers (%)
Class of Workers - State government workers (%)
Class of Workers - Federal government workers (%)
Class of Workers - Self-employed workers in own not incorporated business and Unpaid family workers (%)
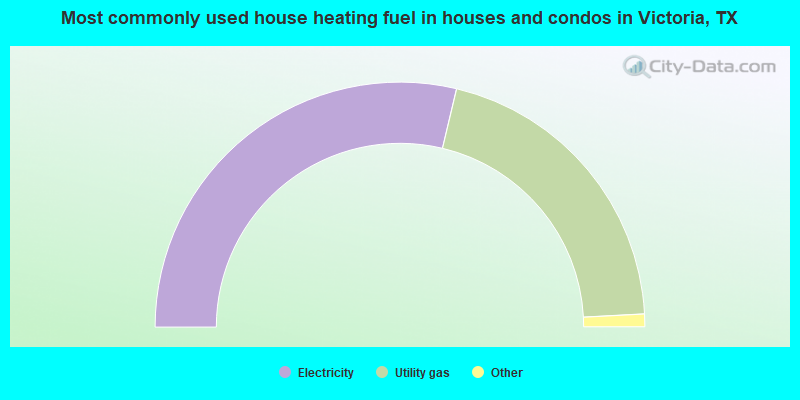
House heating fuel used in houses and condos - Utility gas (%)
House heating fuel used in houses and condos - Bottled, tank, or LP gas (%)
House heating fuel used in houses and condos - Electricity (%)
House heating fuel used in houses and condos - Fuel oil, kerosene, etc. (%)
House heating fuel used in houses and condos - Coal or coke (%)
House heating fuel used in houses and condos - Wood (%)
House heating fuel used in houses and condos - Solar energy (%)
House heating fuel used in houses and condos - Other fuel (%)
House heating fuel used in houses and condos - No fuel used (%)
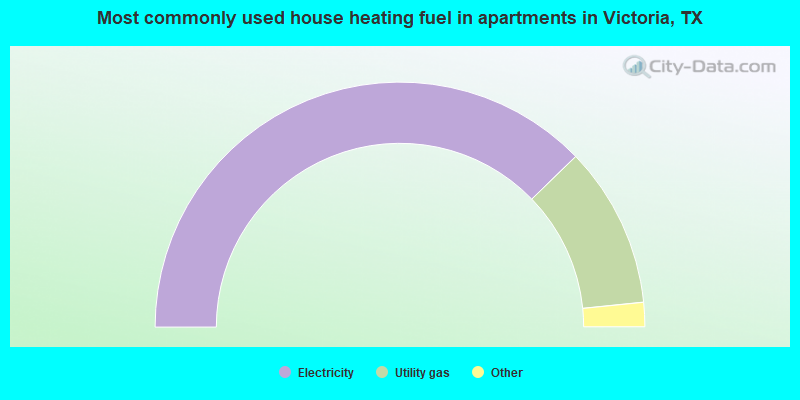
House heating fuel used in apartments - Utility gas (%)
House heating fuel used in apartments - Bottled, tank, or LP gas (%)
House heating fuel used in apartments - Electricity (%)
House heating fuel used in apartments - Fuel oil, kerosene, etc. (%)
House heating fuel used in apartments - Coal or coke (%)
House heating fuel used in apartments - Wood (%)
House heating fuel used in apartments - Solar energy (%)
House heating fuel used in apartments - Other fuel (%)
House heating fuel used in apartments - No fuel used (%)
Armed forces status - In Armed Forces (%)
Armed forces status - Civilian (%)
Armed forces status - Civilian - Veteran (%)
Armed forces status - Civilian - Nonveteran (%)
Fatal accidents locations in years 2005-2021
Fatal accidents locations in 2005
Fatal accidents locations in 2006
Fatal accidents locations in 2007
Fatal accidents locations in 2008
Fatal accidents locations in 2009
Fatal accidents locations in 2010
Fatal accidents locations in 2011
Fatal accidents locations in 2012
Fatal accidents locations in 2013
Fatal accidents locations in 2014
Fatal accidents locations in 2015
Fatal accidents locations in 2016
Fatal accidents locations in 2017
Fatal accidents locations in 2018
Fatal accidents locations in 2019
Fatal accidents locations in 2020
Fatal accidents locations in 2021
Alcohol use - People drinking some alcohol every month (%)
Alcohol use - People not drinking at all (%)
Alcohol use - Average days/month drinking alcohol
Alcohol use - Average drinks/week
Alcohol use - Average days/year people drink much
Audiometry - Average condition of hearing (%)
Audiometry - People that can hear a whisper from across a quiet room (%)
Audiometry - People that can hear normal voice from across a quiet room (%)
Audiometry - Ears ringing, roaring, buzzing (%)
Audiometry - Had a job exposure to loud noise (%)
Audiometry - Had off-work exposure to loud noise (%)
Blood Pressure & Cholesterol - Has high blood pressure (%)
Blood Pressure & Cholesterol - Checking blood pressure at home (%)
Blood Pressure & Cholesterol - Frequently checking blood cholesterol (%)
Blood Pressure & Cholesterol - Has high cholesterol level (%)
Consumer Behavior - Money monthly spent on food at supermarket/grocery store
Consumer Behavior - Money monthly spent on food at other stores
Consumer Behavior - Money monthly spent on eating out
Consumer Behavior - Money monthly spent on carryout/delivered foods
Consumer Behavior - Income spent on food at supermarket/grocery store (%)
Consumer Behavior - Income spent on food at other stores (%)
Consumer Behavior - Income spent on eating out (%)
Consumer Behavior - Income spent on carryout/delivered foods (%)
Current Health Status - General health condition (%)
Current Health Status - Blood donors (%)
Current Health Status - Has blood ever tested for HIV virus (%)
Current Health Status - Left-handed people (%)
Dermatology - People using sunscreen (%)
Diabetes - Diabetics (%)
Diabetes - Had a blood test for high blood sugar (%)
Diabetes - People taking insulin (%)
Diet Behavior & Nutrition - Diet health (%)
Diet Behavior & Nutrition - Milk product consumption (# of products/month)
Diet Behavior & Nutrition - Meals not home prepared (#/week)
Diet Behavior & Nutrition - Meals from fast food or pizza place (#/week)
Diet Behavior & Nutrition - Ready-to-eat foods (#/month)
Diet Behavior & Nutrition - Frozen meals/pizza (#/month)
Drug Use - People that ever used marijuana or hashish (%)
Drug Use - Ever used hard drugs (%)
Drug Use - Ever used any form of cocaine (%)
Drug Use - Ever used heroin (%)
Drug Use - Ever used methamphetamine (%)
Health Insurance - People covered by health insurance (%)
Kidney Conditions-Urology - Avg. # of times urinating at night
Medical Conditions - People with asthma (%)
Medical Conditions - People with anemia (%)
Medical Conditions - People with psoriasis (%)
Medical Conditions - People with overweight (%)
Medical Conditions - Elderly people having difficulties in thinking or remembering (%)
Medical Conditions - People who ever received blood transfusion (%)
Medical Conditions - People having trouble seeing even with glass/contacts (%)
Medical Conditions - People with arthritis (%)
Medical Conditions - People with gout (%)
Medical Conditions - People with congestive heart failure (%)
Medical Conditions - People with coronary heart disease (%)
Medical Conditions - People with angina pectoris (%)
Medical Conditions - People who ever had heart attack (%)
Medical Conditions - People who ever had stroke (%)
Medical Conditions - People with emphysema (%)
Medical Conditions - People with thyroid problem (%)
Medical Conditions - People with chronic bronchitis (%)
Medical Conditions - People with any liver condition (%)
Medical Conditions - People who ever had cancer or malignancy (%)
Mental Health - People who have little interest in doing things (%)
Mental Health - People feeling down, depressed, or hopeless (%)
Mental Health - People who have trouble sleeping or sleeping too much (%)
Mental Health - People feeling tired or having little energy (%)
Mental Health - People with poor appetite or overeating (%)
Mental Health - People feeling bad about themself (%)
Mental Health - People who have trouble concentrating on things (%)
Mental Health - People moving or speaking slowly or too fast (%)
Mental Health - People having thoughts they would be better off dead (%)
Oral Health - Average years since last visit a dentist
Oral Health - People embarrassed because of mouth (%)
Oral Health - People with gum disease (%)
Oral Health - General health of teeth and gums (%)
Oral Health - Average days a week using dental floss/device
Oral Health - Average days a week using mouthwash for dental problem
Oral Health - Average number of teeth
Pesticide Use - Households using pesticides to control insects (%)
Pesticide Use - Households using pesticides to kill weeds (%)
Physical Activity - People doing vigorous-intensity work activities (%)
Physical Activity - People doing moderate-intensity work activities (%)
Physical Activity - People walking or bicycling (%)
Physical Activity - People doing vigorous-intensity recreational activities (%)
Physical Activity - People doing moderate-intensity recreational activities (%)
Physical Activity - Average hours a day doing sedentary activities
Physical Activity - Average hours a day watching TV or videos
Physical Activity - Average hours a day using computer
Physical Functioning - People having limitations keeping them from working (%)
Physical Functioning - People limited in amount of work they can do (%)
Physical Functioning - People that need special equipment to walk (%)
Physical Functioning - People experiencing confusion/memory problems (%)
Physical Functioning - People requiring special healthcare equipment (%)
Prescription Medications - Average number of prescription medicines taking
Preventive Aspirin Use - Adults 40+ taking low-dose aspirin (%)
Reproductive Health - Vaginal deliveries (%)
Reproductive Health - Cesarean deliveries (%)
Reproductive Health - Deliveries resulted in a live birth (%)
Reproductive Health - Pregnancies resulted in a delivery (%)
Reproductive Health - Women breastfeeding newborns (%)
Reproductive Health - Women that had a hysterectomy (%)
Reproductive Health - Women that had both ovaries removed (%)
Reproductive Health - Women that have ever taken birth control pills (%)
Reproductive Health - Women taking birth control pills (%)
Reproductive Health - Women that have ever used Depo-Provera or injectables (%)
Reproductive Health - Women that have ever used female hormones (%)
Sexual Behavior - People 18+ that ever had sex (vaginal, anal, or oral) (%)
Sexual Behavior - Males 18+ that ever had vaginal sex with a woman (%)
Sexual Behavior - Males 18+ that ever performed oral sex on a woman (%)
Sexual Behavior - Males 18+ that ever had anal sex with a woman (%)
Sexual Behavior - Males 18+ that ever had any sex with a man (%)
Sexual Behavior - Females 18+ that ever had vaginal sex with a man (%)
Sexual Behavior - Females 18+ that ever performed oral sex on a man (%)
Sexual Behavior - Females 18+ that ever had anal sex with a man (%)
Sexual Behavior - Females 18+ that ever had any kind of sex with a woman (%)
Sexual Behavior - Average age people first had sex
Sexual Behavior - Average number of female sex partners in lifetime (males 18+)
Sexual Behavior - Average number of female vaginal sex partners in lifetime (males 18+)
Sexual Behavior - Average age people first performed oral sex on a woman (18+)
Sexual Behavior - Average number of woman performed oral sex on in lifetime (18+)
Sexual Behavior - Average number of male sex partners in lifetime (males 18+)
Sexual Behavior - Average number of male anal sex partners in lifetime (males 18+)
Sexual Behavior - Average age people first performed oral sex on a man (18+)
Sexual Behavior - Average number of male oral sex partners in lifetime (18+)
Sexual Behavior - People using protection when performing oral sex (%)
Sexual Behavior - Average number of times people have vaginal or anal sex a year
Sexual Behavior - People having sex without condom (%)
Sexual Behavior - Average number of male sex partners in lifetime (females 18+)
Sexual Behavior - Average number of male vaginal sex partners in lifetime (females 18+)
Sexual Behavior - Average number of female sex partners in lifetime (females 18+)
Sexual Behavior - Circumcised males 18+ (%)
Sleep Disorders - Average hours sleeping at night
Sleep Disorders - People that has trouble sleeping (%)
Smoking-Cigarette Use - People smoking cigarettes (%)
Taste & Smell - People 40+ having problems with smell (%)
Taste & Smell - People 40+ having problems with taste (%)
Taste & Smell - People 40+ that ever had wisdom teeth removed (%)
Taste & Smell - People 40+ that ever had tonsils teeth removed (%)
Taste & Smell - People 40+ that ever had a loss of consciousness because of a head injury (%)
Taste & Smell - People 40+ that ever had a broken nose or other serious injury to face or skull (%)
Taste & Smell - People 40+ that ever had two or more sinus infections (%)
Weight - Average height (inches)
Weight - Average weight (pounds)
Weight - Average BMI
Weight - People that are obese (%)
Weight - People that ever were obese (%)
Weight - People trying to lose weight (%)
The City-Data.com crime index weighs serious crimes and violent crimes more heavily. Higher means more crime, U.S. average is 246.1. It adjusts for the number of visitors and daily workers commuting into cities.
- means the value is smaller than the state average.
- means the value is about the same as the state average.
- means the value is bigger than the state average.
- means the value is much bigger than the state average.
Crime rate in Victoria detailed stats: murders, rapes, robberies, assaults, burglaries, thefts, arson Officers per 1,000 residents here:
1.78Texas average:
2.07
Latest news from Victoria, TX collected exclusively by city-data.com from local newspapers, TV, and radio stations
Ancestries: German (5.0%), English (3.7%), American (2.6%), Irish (2.2%), Czech (1.2%).
Current Local Time:
Land area: 33.0 square miles.
Population density: 1,983 people per square mile (low).
5,066 residents are foreign born (5.9% Latin America , 1.2% Asia ).
This city:
7.7%Texas:
17.1%
Median real estate property taxes paid for housing units with mortgages in 2022: $4,260 (2.0%)Median real estate property taxes paid for housing units with no mortgage in 2022: $2,128 (1.4%)
Nearest city with pop. 200,000+: Corpus Christi, TX
Nearest city with pop. 1,000,000+: San Antonio, TX
Nearest cities:
Latitude: 28.82 N, Longitude: 96.99 W
Nickname or alias (official or unofficial): The Crossroads of South Texas
Daytime population change due to commuting: +4,800 (+7.3%)Workers who live and work in this city: 20,303 (67.2%)
Victoria tourist attractions:
Single-family new house construction building permits:
2022: 202 buildings , average cost: $251,6002021: 181 buildings , average cost: $239,2002020: 132 buildings , average cost: $233,1002019: 141 buildings , average cost: $237,5002018: 70 buildings , average cost: $211,7002017: 57 buildings , average cost: $163,5002016: 62 buildings , average cost: $206,2002015: 136 buildings , average cost: $152,9002014: 163 buildings , average cost: $166,3002013: 122 buildings , average cost: $165,6002012: 111 buildings , average cost: $181,6002011: 83 buildings , average cost: $178,1002010: 47 buildings , average cost: $155,4002009: 46 buildings , average cost: $155,1002008: 59 buildings , average cost: $156,2002007: 103 buildings , average cost: $151,1002006: 143 buildings , average cost: $141,7002005: 123 buildings , average cost: $121,4002004: 138 buildings , average cost: $113,1002003: 117 buildings , average cost: $109,6002002: 212 buildings , average cost: $94,6002001: 144 buildings , average cost: $99,2002000: 167 buildings , average cost: $109,8001999: 196 buildings , average cost: $108,0001998: 212 buildings , average cost: $92,6001997: 189 buildings , average cost: $78,400Unemployment in December 2023:
Population change in the 1990s: +5,016 (+9.0%).
Most common occupations in Victoria, TX (%)
Both Males Females
Other sales and related occupations, including supervisors (5.2%)
Other production occupations, including supervisors (4.6%)
Building and grounds cleaning and maintenance occupations (4.3%)
Preschool, kindergarten, elementary, and middle school teachers (3.8%)
Retail sales workers, except cashiers (3.8%)
Other management occupations, except farmers and farm managers (3.6%)
Secretaries and administrative assistants (3.5%)
Other production occupations, including supervisors (6.8%)
Electrical equipment mechanics and other installation, maintenance, and repair workers, including supervisors (5.4%)
Other sales and related occupations, including supervisors (5.1%)
Driver/sales workers and truck drivers (5.0%)
Building and grounds cleaning and maintenance occupations (4.8%)
Other management occupations, except farmers and farm managers (4.1%)
Metal workers and plastic workers (3.6%)
Secretaries and administrative assistants (7.3%)
Preschool, kindergarten, elementary, and middle school teachers (7.2%)
Other office and administrative support workers, including supervisors (5.4%)
Other sales and related occupations, including supervisors (5.3%)
Retail sales workers, except cashiers (4.7%)
Cashiers (4.6%)
Building and grounds cleaning and maintenance occupations (3.7%)
Air pollution and air quality trends(lower is better)
AQI Ozone
Tornado activity:
Victoria-area historical tornado activity is below Texas state average. It is 7% smaller than the overall U.S. average.
On 11/5/1968, a category F3 (max. wind speeds 158-206 mph) tornado 1.2 miles away from the Victoria city center injured 2 people and caused between $50,000 and $500,000 in damages.
On 2/9/1966, a category F3 tornado 22.3 miles away from the city center caused between $5000 and $50,000 in damages.
Earthquake activity:
Victoria-area historical earthquake activity is significantly above Texas state average. It is 39% smaller than the overall U.S. average. On 10/20/2011 at 12:24:41, a magnitude 4.8 (4.8 MW, Depth: 3.1 mi, Class: Light, Intensity: IV - V) earthquake occurred 65.9 miles away from Victoria center On 4/9/1993 at 12:29:19, a magnitude 4.3 (4.1 MB, 4.3 LG, Depth: 3.1 mi) earthquake occurred 68.5 miles away from the city center On 5/1/2018 at 16:28:56, a magnitude 4.0 (4.0 MW, Depth: 3.1 mi) earthquake occurred 61.7 miles away from the city center On 4/14/1995 at 00:32:56, a magnitude 5.7 (5.6 MB, 5.7 MS, 5.7 MW, Depth: 11.1 mi, Class: Moderate, Intensity: VI - VII) earthquake occurred 396.6 miles away from the city center On 4/7/2008 at 09:51:12, a magnitude 3.9 (3.9 MW, Depth: 3.1 mi, Class: Light, Intensity: II - III) earthquake occurred 63.5 miles away from the city center On 4/25/2010 at 02:10:42, a magnitude 3.9 (3.9 MB, Depth: 3.1 mi) earthquake occurred 92.6 miles away from the city center Magnitude types: regional Lg-wave magnitude (LG), body-wave magnitude (MB), surface-wave magnitude (MS), moment magnitude (MW) Natural disasters: The number of natural disasters in Victoria County (19) is greater than the US average (15).Major Disasters (Presidential) Declared: 10Emergencies Declared: 7Hurricanes: 9, Storms: 7, Floods: 6, Tornadoes: 4, Fires: 2, Wind: 1, Other: 1 (Note: some incidents may be assigned to more than one category). Hospitals in Victoria: CITIZENS MEDICAL CENTER (Voluntary non-profit - Other, provides emergency services, 2701 HOSPITAL DRIVE) CROWN HOSPICE (1101 SALEM ROAD SUITE #A #B #C #D) DETAR HOSPITAL NAVARRO (Proprietary, provides emergency services, 506 E SAN ANTONIO ST) DETAR HOSPITAL NORTH (101 MEDICAL DRIVE) EDINBURGH HOME (306 EDINBURGH) HOSPICE OF SOUTH TEXAS INC (605 EAST LOCUST) NORTHCREST GROUP HOME (902 BELLEVUE) SCCI HOSPITAL OF VICTORIA (506 E SAN ANTONIO STREET 3 EAST FLOOR) VICTORIA GROUP HOME (2006 N WHEELER) WARM SPRINGS REHAB HOSPITAL (102 MEDICAL DRIVE)
Colleges/Universities in Victoria: University of Houston-Victoria Full-time enrollment: 3,110; Location: 3007 N. Ben Wilson; Public; Website: www.uhv.edu; Offers Master's degree )
Victoria College Full-time enrollment: 2,730; Location: 2200 E Red River; Public; Website: www.victoriacollege.edu)
Victoria Beauty College Inc Full-time enrollment: 74; Location: 1508 N Laurent St; Private, for-profit; Website: www.victoriabeautycollegeinc.com)
Texas Vocational Schools Inc Full-time enrollment: 61; Location: 1921 E Red River; Private, for-profit; Website: www.texasvocationalschools.com)
Manuel and Theresa's School of Hair Design-Victoria Full-time enrollment: 32; Location: 1405 East North; Private, for-profit; Website: www.manuelandtheresasschoolofhair.com/)
Other colleges/universities with over 2000 students near Victoria:
Coastal Bend College (about 54 miles; Beeville, TX ; Full-time enrollment: 2,880)
Wharton County Junior College (about 66 miles; Wharton, TX ; FT enrollment: 5,009)
Del Mar College (about 78 miles; Corpus Christi, TX ; FT enrollment: 5,213)
Texas A & M University-Corpus Christi (about 79 miles; Corpus Christi, TX ; FT enrollment: 9,092)
Texas State University (about 94 miles; San Marcos, TX ; FT enrollment: 29,202)
Brazosport College (about 98 miles; Lake Jackson, TX ; FT enrollment: 2,573)
St Philip's College (about 98 miles; San Antonio, TX ; FT enrollment: 5,970)
Public high school in Victoria:
Public elementary/middle school in Victoria:
See full list of schools located in Victoria Library in Victoria: VICTORIA PUBLIC LIBRARY Operating income: $2,025,625; Location: 302 N MAIN ST; 129,236 books ; 1,611 e-books ; 7,145 audio materials ; 2,751 video materials ; 15 local licensed databases ; 50 state licensed databases ; 3 other licensed databases ; 318 print serial subscriptions ; 2 electronic serial subscriptions )
User-submitted facts and corrections:
category: Churches in Victoris - Trinity Episcopal Church, 1501 North Glass
Another High School in Victoria: Profit Magnet High School
Notable locations in Victoria: (A) , Victoria Country Club (B) , South Bridge Street Historic District (C) , Texas Company Filling Station (D) , Victoria Grist Windmill (E) , DeLeon Plaza and Bandstand (F) , City of Victoria Pumping Plant and Waterworks (G) , Victoria County Courthouse (H) , Victoria Fire Department Station 1 (I) , E J Jecker House (J) , E J Fossati House (K) , E H D Bendt House (L) , Farmers and Merchants Cotton Gin Warehouse (M) , F H Crain House (N) , Victoria Fire Department Station 5 (O) , Fleming-Welder House (P) , Frank Alonso House (Q) , George H Hauschild Building (R) , George and Adele Hauschild House (S) , Gaylord-Levy House (T) . Display/hide their locations on the map
Churches in Victoria include: (A) , Saint Marys Catholic Church (B) , Webster Chapel United Methodist Church (C) , Our Lady of Lourdes Church (D) , Presbyterian Iglesia Nicea Church (E) , B'nai Israel (F) , Saint Joseph Church (G) , Grace Lutheran Church (H) , Christ the Victor Lutheran Church (I) . Display/hide their locations on the map
Cemeteries: (1) , Jewett Cemetery (2) , Pleasant Green Cemetery (3) . Display/hide their locations on the map
Lake: (A) . Display/hide its location on the map
Creek: (A) . Display/hide its location on the map
Parks in Victoria include: (1) , Riverside Park (2) , Memorial Park (3) , Riverside Park (4) , Patti Welder Stadium (5) , Memorial Stadium (6) . Display/hide their locations on the map
Tourist attractions: (1) , For Current Events (700 Main Centre Suite STE) (2) , Convention & Visitor's Bureau (700 North Main Street Suite 102) (3) . Display/hide their approximate locations on the map
Hotels: (1) , Best Value Inn (3901 Houston Highway) (2) , Chaparral Motel (3401 US Highway 59 North) (3) . Display/hide their approximate locations on the map
Courts: (1) , Dewitt County - District Courts- 24th Judicial Dist- Joseph Pat Kelly (115 North Bridge Street Basement) (2) , United States Government - Courts- Clerks- US District Clerk (312 South Main Street) (3) , The City Of Victoria Texas (105 West Juan Linn Street) (4) , Texas-State - Tuberculosis Control- Health Department- Immunizations Region (2805 North Navarro Street) (5) , Victoria County - County Court At Law- No 2 (115 North Bridge Street Basement) (6) , Victoria County - County Court At Law- No 1 (115 North Bridge Street Basement) (7) , Victoria City - Environmental Services- Air Quality Program Coodinator (700 North Main Street Suite 108) (8) , Victoria-City - City Information Office- Public Information Office (700 North Main Street Suite 108) (9) . Display/hide their approximate locations on the map
Birthplace of: Stone Cold Steve Austin - Professional wrestler and actor, Kyle Drabek - Baseball player, Thomas Pauken - Soilder, Brandon Green - 2005 NFL player (St. Louis Rams, born : Sep 5, 1980), Doug Drabek - Baseball player, Jerheme Urban - 2005 NFL player (Seattle Seahawks, born : Nov 26, 1980), Justin Lucas - 2005 NFL player (St. Louis Rams, born : Jul 15, 1976), Michael Bates (American football) - Football and Athletics competitor, Ron Gant - Baseball player, Grayston Lynch - Recipient of the Purple Heart medal.
Victoria County has a predicted average indoor radon screening level less than 2 pCi/L (pico curies per liter) - Low Potential Drinking water stations with addresses in Victoria and their reported violations in the past:
FALCON POINT RANCH PUB WS (Address: WOOLSON REAL ESTATE Population served: 1,000, Groundwater):
Past monitoring violations:
One routine major monitoring violation
Population served: 500, Groundwater):
Past monitoring violations:
One routine major monitoring violation
Population served: 400, Groundwater):
Past monitoring violations:
5 routine major monitoring violations
One minor monitoring violation
Population served: 276, Groundwater):
Past monitoring violations:
Monitoring, Repeat Major (TCR) - In JUL-2012, Contaminant: Coliform (TCR). Follow-up actions: St Public Notif requested (SEP-26-2012), St Violation/Reminder Notice (SEP-26-2012), St Formal NOV issued (OCT-31-2012), St Compliance achieved (APR-01-2013), St AO (w/penalty) issued (JUN-03-2013)
Monitoring, Source Water (GWR) - In JUL-01-2012, Contaminant: E. COLI. Follow-up actions: St Violation/Reminder Notice (OCT-26-2012), St Public Notif requested (OCT-26-2012)
14 routine major monitoring violations
3 minor monitoring violations
Population served: 250, Groundwater):
Past monitoring violations:
Monitoring, Repeat Major (TCR) - In JUL-2010, Contaminant: Coliform (TCR). Follow-up actions: St Compliance achieved (JUL-31-2010), St Public Notif requested (AUG-25-2010), St Violation/Reminder Notice (AUG-25-2010), St Public Notif received (SEP-29-2010)
Population served: 100, Groundwater):
Past monitoring violations:
One routine major monitoring violation
Population served: 50, Groundwater):
Past monitoring violations:
3 routine major monitoring violations
Population served: 25, Groundwater):
Past monitoring violations:
70 routine major monitoring violations
6 regular monitoring violations
Drinking water stations with addresses in Victoria that have no violations reported:
WARRIOR SUPPLY (Population served: 50, Primary Water Source Type: Groundwater)
FASTOP 6 (Population served: 25, Primary Water Source Type: Groundwater)
Average household size: This city:
2.6 peopleTexas:
2.8 people
Percentage of family households: This city:
68.1%Whole state:
69.9%
Percentage of households with unmarried partners: This city:
7.7%Whole state:
6.0%
Likely homosexual households (counted as self-reported same-sex unmarried-partner households)
Lesbian couples: 0.4% of all households Gay men: 0.2% of all households
People in group quarters in Victoria in 2010:
478 people in nursing facilities/skilled-nursing facilities
409 people in local jails and other municipal confinement facilities
155 people in other noninstitutional facilities
147 people in hospitals with patients who have no usual home elsewhere
62 people in residential treatment centers for adults
31 people in emergency and transitional shelters (with sleeping facilities) for people experiencing homelessness
23 people in group homes intended for adults
19 people in group homes for juveniles (non-correctional)
People in group quarters in Victoria in 2000:
478 people in nursing homes
473 people in local jails and other confinement facilities (including police lockups)
120 people in other noninstitutional group quarters
88 people in religious group quarters
27 people in homes or halfway houses for drug/alcohol abuse
26 people in homes for the mentally retarded
10 people in other group homes
Banks with most branches in Victoria (2011 data):
Wells Fargo Bank, National Association: 7 branches. Info updated 2011/04/05: Bank assets: $1,161,490.0 mil, Deposits: $905,653.0 mil, headquarters in Sioux Falls, SD, positive income , 6395 total offices , Holding Company: Wells Fargo & Company
First Victoria National Bank: North Branch, Navarro Center Branch, Colony Creek Branch, at 101 South Main Street. Info updated 2006/11/03: Bank assets: $1,911.3 mil, Deposits: $1,700.2 mil, local headquarters , positive income , Commercial Lending Specialization, 27 total offices , Holding Company: Mow/Rpw Ii, Ltd.
TrustTexas Bank, SSB: Victoria-Sam Houston Branch at 2701 Sam Houston, branch established on 1995/03/28; Victoria-Laurent Branch at 2109 North Laurent, branch established on 1921/01/01. Info updated 2006/08/14: Bank assets: $212.3 mil, Deposits: $183.9 mil, headquarters in Cuero, TX, positive income , 5 total offices , Holding Company: Trusttexas Mutual Holding Company
Prosperity Bank: Victoria North Branch at 6252 North Navarro, branch established on 1995/05/11; Victoria Branch at 1205 North Navarro, branch established on 1998/02/11. Info updated 2012/01/05: Bank assets: $9,816.2 mil, Deposits: $8,064.8 mil, headquarters in El Campo, TX, positive income , Mortgage Lending Specialization, 187 total offices , Holding Company: Prosperity Bancshares, Inc.
International Bank of Commerce: Victoria Branch - Heb Instore at 1505 E. Rio Grande St., branch established on 2009/04/08; Victoria Navarro Branch at 6411 N. Navarro, branch established on 2000/08/31. Info updated 2007/03/28: Bank assets: $9,621.9 mil, Deposits: $6,548.8 mil, headquarters in Laredo, TX, positive income , Commercial Lending Specialization, 197 total offices , Holding Company: International Bancshares Corporation
Capital One, National Association: Victoria Branch at 7602 North Navarro Street, branch established on 1935/03/25. Info updated 2011/07/01: Bank assets: $133,477.8 mil, Deposits: $97,063.7 mil, headquarters in Mclean, VA, positive income , 984 total offices , Holding Company: Capital One Financial Corporation
NewFirst National Bank: Victoria Branch at 10301 Ne Zac Lentz Parkway, branch established on 2005/06/01. Info updated 2006/11/03: Bank assets: $454.2 mil, Deposits: $407.6 mil, headquarters in El Campo, TX, positive income , Commercial Lending Specialization, 10 total offices , Holding Company: Newfirst Financial Group, Inc.
Bank of America, National Association: Victoria Branch at 5606 North Navarro Street, branch established on 1955/09/15. Info updated 2009/11/18: Bank assets: $1,451,969.3 mil, Deposits: $1,077,176.8 mil, headquarters in Charlotte, NC, positive income , 5782 total offices , Holding Company: Bank Of America Corporation
First National Bank Texas: Victoria Banking Center - Rc 634 at 9002 North Navarro, branch established on 1999/09/30. Info updated 2006/11/03: Bank assets: $944.3 mil, Deposits: $815.9 mil, headquarters in Killeen, TX, positive income , Mortgage Lending Specialization, 250 total offices , Holding Company: First Community Bancshares, Inc.
For population 15 years and over in Victoria:
Never married: 36.8%Now married: 46.6%Separated: 1.1%Widowed: 6.0%Divorced: 9.4% For population 25 years and over in Victoria:
High school or higher: 81.3%Bachelor's degree or higher: 17.4%Graduate or professional degree: 4.3%Unemployed: 3.9%Mean travel time to work (commute): 20.2 minutes
Education Gini index (Inequality in education) Here:
12.6Texas average:
14.0
Religion statistics for Victoria, TX (based on Victoria County data)
Religion Adherents Congregations Catholic 31,313 8 Evangelical Protestant 22,949 63 Mainline Protestant 6,575 19 Other 3,104 8 Black Protestant 1,515 8 None 21,337 -
Source: Clifford Grammich, Kirk Hadaway, Richard Houseal, Dale E.Jones, Alexei Krindatch, Richie Stanley and Richard H.Taylor. 2012. 2010 U.S.Religion Census: Religious Congregations & Membership Study. Association of Statisticians of American Religious Bodies. Jones, Dale E., et al. 2002. Congregations and Membership in the United States 2000. Nashville, TN: Glenmary Research Center. Graphs represent county-level data
Food Environment Statistics: Number of grocery stores : 8This county :
0.93 / 10,000 pop.Texas :
1.47 / 10,000 pop.
Number of supercenters and club stores : 2This county :
0.23 / 10,000 pop.State :
0.14 / 10,000 pop.
Number of convenience stores (no gas) : 5This county :
0.58 / 10,000 pop.Texas :
1.11 / 10,000 pop.
Number of convenience stores (with gas) : 58This county :
6.73 / 10,000 pop.State :
3.95 / 10,000 pop.
Number of full-service restaurants : 62This county :
7.20 / 10,000 pop.Texas :
6.13 / 10,000 pop.
Adult obesity rate : Victoria County :
27.7%Texas :
26.6%
Low-income preschool obesity rate : Victoria County :
16.8%Texas :
15.7%
Health and Nutrition: Healthy diet rate : Victoria:
48.1%Texas:
48.6%
Average overall health of teeth and gums : Victoria:
46.8%Texas:
47.4%
People feeling badly about themselves : People not drinking alcohol at all : Average hours sleeping at night : Overweight people : Victoria:
33.7%State:
33.1%
General health condition : Victoria:
55.0%Texas:
56.2%
Average condition of hearing : More about Health and Nutrition of Victoria, TX Residents
Local government employment and payroll (March 2022)
Function
Full-time employees
Monthly full-time payroll
Average yearly full-time wage
Part-time employees
Monthly part-time payroll
Police Protection - Officers
110 $572,953 $62,504 0 $0 Firefighters
87 $438,889 $60,536 3 $7,137 Parks and Recreation
49 $164,583 $40,306 17 $18,658 Streets and Highways
42 $156,798 $44,799 0 $0 Water Supply
38 $174,940 $55,244 0 $0 Other and Unallocable
33 $120,816 $43,933 0 $0 Financial Administration
32 $126,675 $47,503 0 $0 Police - Other
28 $184,043 $78,876 0 $0 Other Government Administration
25 $158,155 $75,914 6 $2,017 Sewerage
23 $101,184 $52,792 0 $0 Local Libraries
23 $75,713 $39,502 5 $4,046 Fire - Other
19 $121,952 $77,022 0 $0 Solid Waste Management
19 $67,022 $42,330 0 $0 Judicial and Legal
8 $48,271 $72,407 0 $0 Health
6 $28,950 $57,900 0 $0
Totals for Government
542 $2,540,944 $56,257 31 $31,857
Victoria government finances - Expenditure in 2021 (per resident):
Construction - Regular Highways: $2,539,000 ($38.84)
Sewerage: $122,000 ($1.87)Current Operations - General - Other: $26,684,000 ($408.19)
Judicial and Legal Services: $14,162,000 ($216.64)Local Fire Protection: $12,791,000 ($195.66)Water Utilities: $5,964,000 ($91.23)Regular Highways: $5,477,000 ($83.78)Sewerage: $5,026,000 ($76.88)Solid Waste Management: $4,703,000 ($71.94)Parks and Recreation: $4,684,000 ($71.65)Financial Administration: $3,264,000 ($49.93)Central Staff Services: $2,395,000 ($36.64)Libraries: $1,749,000 ($26.75)Protective Inspection and Regulation - Other: $1,014,000 ($15.51)Correctional Institutions: $803,000 ($12.28)Housing and Community Development: $525,000 ($8.03)General Public Buildings: $416,000 ($6.36)General - Interest on Debt: $2,542,000 ($38.89)
Intergovernmental to Local - Other - Central Staff Services: $378,000 ($5.78)
Other - Transit Utilities: $209,000 ($3.20)Other - Public Welfare - Other: $137,000 ($2.10)Other - Correctional Institutions: $54,000 ($0.83)Other Capital Outlay - General - Other: $2,604,000 ($39.83)
Water Utilities: $1,287,000 ($19.69)Judicial and Legal Services: $1,023,000 ($15.65)Sewerage: $651,000 ($9.96)Libraries: $389,000 ($5.95)Parks and Recreation: $292,000 ($4.47)Local Fire Protection: $233,000 ($3.56)General Public Building: $116,000 ($1.77)Solid Waste Management: $99,000 ($1.51)Central Staff Services: $27,000 ($0.41)Regular Highways: $23,000 ($0.35)Protective Inspection and Regulation - Other: $15,000 ($0.23)Financial Administration: $12,000 ($0.18)Correctional Institutions: $11,000 ($0.17)Total Salaries and Wages: $33,029,000 ($505.25)
Water Utilities - Interest on Debt: $1,389,000 ($21.25)
Victoria government finances - Revenue in 2021 (per resident):
Charges - Sewerage: $12,524,000 ($191.58)
Other: $6,480,000 ($99.13)Solid Waste Management: $5,498,000 ($84.10)Parks and Recreation: $189,000 ($2.89)Federal Intergovernmental - Public Welfare: $680,000 ($10.40)
Housing and Community Development: $525,000 ($8.03)Local Intergovernmental - Public Welfare: $505,000 ($7.73)
Miscellaneous - General Revenue - Other: $6,011,000 ($91.95)
Interest Earnings: $1,238,000 ($18.94)Fines and Forfeits: $746,000 ($11.41)Rents: $23,000 ($0.35)Sale of Property: $1,000 ($0.02)Revenue - Water Utilities: $13,677,000 ($209.22)
State Intergovernmental - Public Welfare: $356,000 ($5.45)
General Local Government Support: $190,000 ($2.91)Housing and Community Development: $129,000 ($1.97)Other: $118,000 ($1.81)Tax - Property: $25,257,000 ($386.36)
General Sales and Gross Receipts: $16,338,000 ($249.92)Public Utilities Sales: $5,652,000 ($86.46)Other: $1,329,000 ($20.33)Occupation and Business License - Other: $529,000 ($8.09)Amusements Sales: $72,000 ($1.10)Alcoholic Beverage License: $30,000 ($0.46)Amusements License: $7,000 ($0.11)
Victoria government finances - Debt in 2021 (per resident):
Long Term Debt - Beginning Outstanding - Unspecified Public Purpose: $116,695,000 ($1785.09)
Outstanding Unspecified Public Purpose: $101,085,000 ($1546.30)Retired Unspecified Public Purpose: $27,010,000 ($413.17)Issue, Unspecified Public Purpose: $11,400,000 ($174.39)
Victoria government finances - Cash and Securities in 2021 (per resident):
Bond Funds - Cash and Securities: $3,858,000 ($59.02)
Other Funds - Cash and Securities: $61,538,000 ($941.35)
Businesses in Victoria, TX
Name Count Name Count
AT&T 4 La-Z-Boy 1 Academy Sports + Outdoors 1 Lane Furniture 2 Advance Auto Parts 2 Little Caesars Pizza 2 Aeropostale 1 Long John Silver's 1 American Eagle Outfitters 1 Lowe's 1 Arby's 1 Marriott 1 Ashley Furniture 1 MasterBrand Cabinets 1 AutoZone 2 Maurices 1 Bath & Body Works 1 Mazda 1 Bed Bath & Beyond 1 McDonald's 5 Best Western 1 New Balance 1 Blockbuster 1 Nike 4 Burger King 2 Nissan 1 CVS 1 Office Depot 2 Chevrolet 1 Olive Garden 1 Chick-Fil-A 2 Pac Sun 1 Chuck E. Cheese's 1 Papa John's Pizza 1 Church's Chicken 3 Payless 2 ColorTyme 1 PetSmart 1 Cricket Wireless 2 Pizza Hut 2 Dairy Queen 1 Popeyes 1 Decora Cabinetry 1 Quality 1 Dennys 1 RadioShack 2 Discount Tire 2 Red Lobster 1 Domino's Pizza 1 Rue21 1 FedEx 11 SAS Shoes 1 Finish Line 1 SONIC Drive-In 4 Firestone Complete Auto Care 2 Sam's Club 1 Foot Locker 1 Sears 3 GNC 1 Sprint Nextel 2 GameStop 2 Starbucks 2 Goodwill 4 Subway 10 H&R Block 2 Super 8 2 Hilton 1 T-Mobile 3 Hobby Lobby 1 Taco Bell 2 Holiday Inn 2 Target 1 Home Depot 1 Toyota 1 Honda 1 True Value 1 IHOP 1 U-Haul 4 JCPenney 1 UPS 12 Jack In The Box 2 Vans 2 Journeys 1 Verizon Wireless 1 Justice 1 Victoria's Secret 1 KFC 1 Walgreens 4 Kincaid 1 Walmart 1 Kohl's 1 Wendy's 2 La Quinta 1 YMCA 2
Strongest AM radio stations in Victoria:
KRNX (1340 AM; 1 kW; VICTORIA, TX; Owner: VICTORIA RADIO WORKS, LTD.)
KNAL (1410 AM; 1 kW; VICTORIA, TX)
KTMR (1130 AM; daytime; 10 kW; EDNA, TX; Owner: SIGA BROADCASTING CORPORATION)
KCTA (1030 AM; 50 kW; CORPUS CHRISTI, TX; Owner: BROADCASTING CORPORATION OF THE SOUTHWEST)
KTKR (760 AM; 50 kW; SAN ANTONIO, TX; Owner: CCB TEXAS LICENSES, L.P.)
WOAI (1200 AM; 50 kW; SAN ANTONIO, TX; Owner: CCB TEXAS LICENSES, L.P.)
KKYX (680 AM; 50 kW; SAN ANTONIO, TX; Owner: CXR HOLDINGS, INC.)
KILE (1560 AM; 50 kW; BELLAIRE, TX; Owner: THE RAFTT CORPORATION)
KTRH (740 AM; 50 kW; HOUSTON, TX; Owner: AMFM TEXAS LICENSES LIMITED PARTNERSHIP)
KGOL (1180 AM; 50 kW; HUMBLE, TX; Owner: ENTRAVISION HOLDINGS, LLC)
KSAH (720 AM; 10 kW; UNIVERSAL CITY, TX; Owner: KSAH LICENSING, INC.)
KENS (1160 AM; 25 kW; SAN ANTONIO, TX; Owner: KENS-TV, INC.)
KSEV (700 AM; 15 kW; TOMBALL, TX; Owner: LIBERMAN BROADCASTING OF HOUSTON LICENSE CORP.)
Strongest FM radio stations in Victoria:
KQVT (92.3 FM; VICTORIA, TX; Owner: CAPSTAR TX LIMITED PARTNERSHIP)
WKSQ (94.5 FM; ELLSWORTH, ME; Owner: CLEAR CHANNEL BROADCASTING LICENSES, INC.)
KTXN-FM (98.7 FM; VICTORIA, TX; Owner: COSMOPOLITAN ENTERPRISES OF VICTORIA)
KVIC (95.1 FM; VICTORIA, TX; Owner: VICTORIA RADIO WORKS, LTD.)
KXBJ (89.3 FM; VICTORIA, TX; Owner: EDUCATIONAL MEDIA FOUNDATION OF VICTORIA, INC.)
K211DR (90.1 FM; VICTORIA, TX; Owner: PAULINO BERNAL EVANGELISM)
KEPG (100.9 FM; VICTORIA, TX; Owner: VICTORIA RADIOWORKS, LTD.)
KVRT (90.7 FM; VICTORIA, TX; Owner: SOUTH TX PUBLIC B/CSTNG SYSTEM, INC.)
KAYK (88.5 FM; VICTORIA, TX; Owner: AMERICAN FAMILY ASSOCIATION)
KIXS (107.9 FM; VICTORIA, TX; Owner: CAPSTAR TX LIMITED PARTNERSHIP)
KZAM (104.7 FM; GANADO, TX; Owner: FORT BEND BROADCASTING COMPANY)
KLUB (106.9 FM; BLOOMINGTON, TX; Owner: CAPSTAR TX LIMITED PARTNERSHIP)
KITE (93.3 FM; PORT LAVACA, TX; Owner: VICTORIA RADIOWORKS, LTD.)
KHMC (95.9 FM; GOLIAD, TX; Owner: CINCO DE MAYO BROADCASTING)
KIOX-FM (96.9 FM; EL CAMPO, TX; Owner: LIBERMAN BROADCASTING OF HOUSTON LICENSE CORP.)
K269CQ (101.7 FM; VICTORIA, TX; Owner: J & J BROADCASTING)
K203BS (88.5 FM; VICTORIA, TX; Owner: AMERICAN FAMILY ASSOCIATION)
TV broadcast stations around Victoria:
KVCT (Channel 19; VICTORIA, TX; Owner: SURTSEY PRODUCTIONS, INC.)
KBGS-LP (Channel 51; VICTORIA, TX; Owner: CLUB COMMUNICATIONS)
KCPV-LP (Channel 57; VICTORIA, TX; Owner: CLUB COMMUNICATIONS)
KXTS-LP (Channel 41; VICTORIA, TX; Owner: SAGA BROADCASTING, LLC)
KUNU-LP (Channel 21; VICTORIA, TX; Owner: SAGA BROADCASTING, LLC)
KVTX-LP (Channel 45; VICTORIA, TX; Owner: SAGA BROADCASTING, LLC)
KVHM-LP (Channel 31; VICTORIA, TX; Owner: HUMBERTO LOPEZ)
K43DV (Channel 43; VICTORIA, TX; Owner: TRINITY BROADCASTING NETWORK)
KAVU-TV (Channel 25; VICTORIA, TX; Owner: SAGA BROADCASTING, LLC)
National Bridge Inventory (NBI) Statistics 168 Number of bridges3,642ft / 1,110m Total length $320,000 Total costs1,496,456 Total average daily traffic212,012 Total average daily truck traffic
New bridges - historical statistics
1 1920-1929 5 1930-1939 1 1940-1949 6 1950-1959 49 1960-1969 18 1970-1979 12 1980-1989 25 1990-1999 27 2000-2009 23 2010-2019 1 2020-2022
See full National Bridge Inventory statistics for Victoria, TX
Home Mortgage Disclosure Act Aggregated Statistics For Year 2009(Based on 12 full and 2 partial tracts) A) FHA, FSA/RHS & VA B) Conventional C) Refinancings D) Home Improvement Loans E) Loans on Dwellings For 5+ Families F) Non-occupant Loans on G) Loans On Manufactured Number Average Value Number Average Value Number Average Value Number Average Value Number Average Value Number Average Value Number Average Value
LOANS ORIGINATED 200 $119,431 151 $116,304 244 $119,872 53 $37,202 2 $1,263,500 71 $85,113 2 $91,550 APPLICATIONS APPROVED, NOT ACCEPTED 4 $117,305 13 $141,828 20 $103,342 8 $22,311 0 $0 5 $64,342 2 $71,500 APPLICATIONS DENIED 10 $89,476 33 $74,967 126 $85,346 88 $27,525 0 $0 15 $53,539 16 $41,612 APPLICATIONS WITHDRAWN 7 $100,169 108 $110,334 89 $90,336 21 $55,551 0 $0 11 $100,730 0 $0 FILES CLOSED FOR INCOMPLETENESS 2 $150,540 2 $107,000 11 $113,873 4 $32,368 0 $0 4 $71,250 0 $0
Aggregated Statistics For Year 2008(Based on 12 full and 2 partial tracts) A) FHA, FSA/RHS & VA B) Conventional C) Refinancings D) Home Improvement Loans E) Loans on Dwellings For 5+ Families F) Non-occupant Loans on G) Loans On Manufactured Number Average Value Number Average Value Number Average Value Number Average Value Number Average Value Number Average Value Number Average Value
LOANS ORIGINATED 194 $109,421 304 $109,250 188 $95,793 72 $32,496 9 $1,690,467 108 $67,890 8 $57,830 APPLICATIONS APPROVED, NOT ACCEPTED 11 $96,818 25 $73,977 33 $89,606 23 $29,241 0 $0 12 $68,207 13 $61,610 APPLICATIONS DENIED 14 $100,136 95 $65,856 185 $79,869 155 $29,226 1 $537,730 28 $44,056 26 $53,094 APPLICATIONS WITHDRAWN 14 $99,926 82 $105,875 75 $99,633 28 $37,762 0 $0 13 $91,231 0 $0 FILES CLOSED FOR INCOMPLETENESS 2 $76,500 3 $88,617 9 $110,924 9 $26,911 1 $3,280,000 1 $44,000 1 $43,400
Aggregated Statistics For Year 2007(Based on 12 full and 2 partial tracts) A) FHA, FSA/RHS & VA B) Conventional C) Refinancings D) Home Improvement Loans E) Loans on Dwellings For 5+ Families F) Non-occupant Loans on G) Loans On Manufactured Number Average Value Number Average Value Number Average Value Number Average Value Number Average Value Number Average Value Number Average Value
LOANS ORIGINATED 147 $96,934 553 $90,680 224 $78,901 110 $35,501 2 $542,680 139 $65,451 14 $67,492 APPLICATIONS APPROVED, NOT ACCEPTED 10 $92,900 74 $74,947 51 $69,926 25 $36,786 0 $0 8 $65,979 18 $58,447 APPLICATIONS DENIED 9 $98,219 140 $73,784 252 $76,817 192 $28,060 1 $513,000 39 $54,721 38 $44,785 APPLICATIONS WITHDRAWN 10 $87,100 96 $84,974 150 $88,516 30 $41,202 1 $452,000 22 $76,663 3 $49,727 FILES CLOSED FOR INCOMPLETENESS 4 $144,532 10 $94,086 25 $116,037 3 $51,877 0 $0 4 $61,408 0 $0
Aggregated Statistics For Year 2006(Based on 12 full and 2 partial tracts) A) FHA, FSA/RHS & VA B) Conventional C) Refinancings D) Home Improvement Loans E) Loans on Dwellings For 5+ Families F) Non-occupant Loans on G) Loans On Manufactured Number Average Value Number Average Value Number Average Value Number Average Value Number Average Value Number Average Value Number Average Value
LOANS ORIGINATED 82 $89,094 528 $82,364 224 $80,632 122 $33,832 7 $1,786,000 119 $89,141 15 $36,403 APPLICATIONS APPROVED, NOT ACCEPTED 8 $72,505 67 $75,272 37 $79,481 25 $26,696 0 $0 14 $64,204 20 $42,036 APPLICATIONS DENIED 9 $59,000 188 $55,800 261 $68,741 163 $26,335 1 $22,500,000 51 $58,150 68 $39,446 APPLICATIONS WITHDRAWN 9 $92,068 84 $89,902 176 $82,946 29 $40,411 1 $440,000 15 $68,287 2 $46,815 FILES CLOSED FOR INCOMPLETENESS 0 $0 14 $83,448 49 $101,003 4 $46,768 0 $0 2 $58,000 0 $0
Aggregated Statistics For Year 2005(Based on 12 full and 2 partial tracts) A) FHA, FSA/RHS & VA B) Conventional C) Refinancings D) Home Improvement Loans E) Loans on Dwellings For 5+ Families F) Non-occupant Loans on G) Loans On Manufactured Number Average Value Number Average Value Number Average Value Number Average Value Number Average Value Number Average Value Number Average Value
LOANS ORIGINATED 172 $82,491 514 $76,275 298 $74,202 104 $56,179 2 $1,229,000 148 $60,766 19 $42,969 APPLICATIONS APPROVED, NOT ACCEPTED 4 $51,500 89 $64,166 48 $64,858 24 $37,338 0 $0 13 $66,497 27 $37,614 APPLICATIONS DENIED 9 $48,171 173 $56,822 349 $64,707 153 $26,120 0 $0 56 $50,536 69 $40,303 APPLICATIONS WITHDRAWN 11 $81,416 85 $79,106 214 $85,043 63 $177,529 0 $0 31 $101,131 4 $42,500 FILES CLOSED FOR INCOMPLETENESS 14 $85,670 22 $83,938 90 $89,844 0 $0 0 $0 9 $69,310 1 $107,000
Aggregated Statistics For Year 2004(Based on 12 full and 2 partial tracts) A) FHA, FSA/RHS & VA B) Conventional C) Refinancings D) Home Improvement Loans E) Loans on Dwellings For 5+ Families F) Non-occupant Loans on G) Loans On Manufactured Number Average Value Number Average Value Number Average Value Number Average Value Number Average Value Number Average Value Number Average Value
LOANS ORIGINATED 188 $81,608 433 $79,404 443 $68,774 137 $30,842 2 $102,500 128 $60,248 23 $58,364 APPLICATIONS APPROVED, NOT ACCEPTED 10 $87,771 94 $61,141 50 $77,174 23 $22,383 0 $0 18 $54,333 36 $36,781 APPLICATIONS DENIED 13 $77,522 189 $49,247 360 $64,898 146 $24,212 0 $0 42 $47,730 125 $38,310 APPLICATIONS WITHDRAWN 12 $66,967 48 $87,193 233 $69,244 20 $58,696 0 $0 10 $43,410 0 $0 FILES CLOSED FOR INCOMPLETENESS 5 $75,002 18 $81,936 101 $84,684 2 $47,385 0 $0 4 $61,222 0 $0
Aggregated Statistics For Year 2003(Based on 12 full and 2 partial tracts) A) FHA, FSA/RHS & VA B) Conventional C) Refinancings D) Home Improvement Loans E) Loans on Dwellings For 5+ Families F) Non-occupant Loans on Number Average Value Number Average Value Number Average Value Number Average Value Number Average Value Number Average Value
LOANS ORIGINATED 179 $75,615 385 $76,082 703 $74,014 93 $23,266 2 $825,000 183 $62,152 APPLICATIONS APPROVED, NOT ACCEPTED 6 $81,630 93 $58,697 85 $69,199 15 $29,617 0 $0 20 $45,700 APPLICATIONS DENIED 14 $64,954 183 $47,224 401 $61,926 86 $14,224 1 $45,000 42 $36,459 APPLICATIONS WITHDRAWN 10 $73,231 44 $87,292 212 $66,149 7 $17,821 0 $0 11 $68,322 FILES CLOSED FOR INCOMPLETENESS 5 $88,970 9 $97,598 23 $84,479 1 $84,420 0 $0 1 $112,000
Aggregated Statistics For Year 2002(Based on 10 full and 2 partial tracts) A) FHA, FSA/RHS & VA B) Conventional C) Refinancings D) Home Improvement Loans E) Loans on Dwellings For 5+ Families F) Non-occupant Loans on Number Average Value Number Average Value Number Average Value Number Average Value Number Average Value Number Average Value
LOANS ORIGINATED 138 $70,230 263 $79,081 303 $68,995 84 $19,173 1 $319,530 98 $51,055 APPLICATIONS APPROVED, NOT ACCEPTED 6 $80,290 85 $46,467 46 $59,053 5 $15,940 0 $0 14 $48,840 APPLICATIONS DENIED 18 $70,017 145 $44,618 159 $54,083 56 $14,985 0 $0 29 $50,886 APPLICATIONS WITHDRAWN 15 $72,651 27 $69,100 135 $53,205 2 $19,500 1 $122,070 16 $69,252 FILES CLOSED FOR INCOMPLETENESS 8 $62,639 3 $106,977 23 $80,623 2 $26,000 0 $0 1 $60,000
Aggregated Statistics For Year 2001(Based on 10 full and 2 partial tracts) A) FHA, FSA/RHS & VA B) Conventional C) Refinancings D) Home Improvement Loans E) Loans on Dwellings For 5+ Families F) Non-occupant Loans on Number Average Value Number Average Value Number Average Value Number Average Value Number Average Value Number Average Value
LOANS ORIGINATED 177 $69,260 297 $69,928 251 $65,166 68 $14,243 4 $2,643,500 80 $49,266 APPLICATIONS APPROVED, NOT ACCEPTED 7 $68,151 120 $50,446 30 $56,421 8 $38,218 0 $0 11 $91,426 APPLICATIONS DENIED 11 $84,486 215 $42,905 162 $45,801 34 $16,408 0 $0 14 $39,860 APPLICATIONS WITHDRAWN 16 $67,383 44 $68,157 113 $47,915 1 $16,000 0 $0 10 $54,480 FILES CLOSED FOR INCOMPLETENESS 4 $47,300 8 $60,021 17 $55,142 0 $0 0 $0 3 $21,080
Aggregated Statistics For Year 2000(Based on 10 full and 2 partial tracts) A) FHA, FSA/RHS & VA B) Conventional C) Refinancings D) Home Improvement Loans E) Loans on Dwellings For 5+ Families F) Non-occupant Loans on Number Average Value Number Average Value Number Average Value Number Average Value Number Average Value Number Average Value
LOANS ORIGINATED 158 $62,698 285 $70,699 103 $46,930 59 $21,081 0 $0 62 $39,174 APPLICATIONS APPROVED, NOT ACCEPTED 18 $56,819 79 $48,716 39 $40,667 6 $18,848 0 $0 8 $31,375 APPLICATIONS DENIED 21 $48,548 211 $40,505 101 $42,472 46 $14,257 1 $4,021,000 18 $41,470 APPLICATIONS WITHDRAWN 12 $58,417 28 $75,458 67 $46,647 6 $22,833 1 $1,910,000 3 $29,333 FILES CLOSED FOR INCOMPLETENESS 2 $60,500 6 $47,635 55 $43,599 2 $11,000 0 $0 6 $41,833
Aggregated Statistics For Year 1999(Based on 11 full and 2 partial tracts) A) FHA, FSA/RHS & VA B) Conventional C) Refinancings D) Home Improvement Loans E) Loans on Dwellings For 5+ Families F) Non-occupant Loans on Number Average Value Number Average Value Number Average Value Number Average Value Number Average Value Number Average Value
LOANS ORIGINATED 225 $63,742 458 $77,572 209 $52,340 97 $15,143 3 $879,333 95 $50,394 APPLICATIONS APPROVED, NOT ACCEPTED 13 $65,186 151 $48,281 55 $47,469 19 $19,513 0 $0 20 $65,448 APPLICATIONS DENIED 27 $55,990 546 $40,868 119 $42,581 66 $10,804 0 $0 41 $51,599 APPLICATIONS WITHDRAWN 4 $65,988 58 $75,258 108 $54,568 4 $19,750 1 $1,061,000 7 $62,726 FILES CLOSED FOR INCOMPLETENESS 3 $57,333 7 $53,764 52 $51,412 1 $5,000 0 $0 5 $41,800
Detailed mortgage data for all 14 tracts in Victoria, TX
Private Mortgage Insurance Companies Aggregated Statistics For Year 2009(Based on 8 full and 1 partial tracts) A) Conventional B) Refinancings C) Non-occupant Loans on Number Average Value Number Average Value Number Average Value
LOANS ORIGINATED 20 $133,392 6 $180,938 0 $0 APPLICATIONS APPROVED, NOT ACCEPTED 2 $203,290 1 $240,580 0 $0 APPLICATIONS DENIED 1 $166,000 0 $0 0 $0 APPLICATIONS WITHDRAWN 0 $0 0 $0 0 $0 FILES CLOSED FOR INCOMPLETENESS 1 $61,000 0 $0 1 $61,000
Aggregated Statistics For Year 2008(Based on 10 full and 1 partial tracts) A) Conventional B) Refinancings C) Non-occupant Loans on Number Average Value Number Average Value Number Average Value
LOANS ORIGINATED 80 $122,276 11 $170,750 7 $77,021 APPLICATIONS APPROVED, NOT ACCEPTED 8 $103,310 2 $116,500 0 $0 APPLICATIONS DENIED 2 $94,075 1 $94,000 2 $94,075 APPLICATIONS WITHDRAWN 4 $87,332 0 $0 0 $0 FILES CLOSED FOR INCOMPLETENESS 1 $81,000 0 $0 1 $81,000
Aggregated Statistics For Year 2007(Based on 12 full and 1 partial tracts) A) Conventional B) Refinancings C) Non-occupant Loans on D) Loans On Manufactured Number Average Value Number Average Value Number Average Value Number Average Value
LOANS ORIGINATED 137 $104,711 10 $111,719 14 $69,403 1 $45,000 APPLICATIONS APPROVED, NOT ACCEPTED 14 $104,187 1 $362,250 3 $54,000 0 $0 APPLICATIONS DENIED 3 $115,000 0 $0 0 $0 0 $0 APPLICATIONS WITHDRAWN 4 $80,518 0 $0 0 $0 0 $0 FILES CLOSED FOR INCOMPLETENESS 0 $0 0 $0 0 $0 0 $0
Aggregated Statistics For Year 2006(Based on 11 full and 2 partial tracts) A) Conventional B) Refinancings C) Non-occupant Loans on D) Loans On Manufactured Number Average Value Number Average Value Number Average Value Number Average Value
LOANS ORIGINATED 95 $94,836 5 $132,234 13 $69,997 1 $48,000 APPLICATIONS APPROVED, NOT ACCEPTED 4 $104,778 0 $0 1 $36,000 0 $0 APPLICATIONS DENIED 1 $38,000 0 $0 0 $0 0 $0 APPLICATIONS WITHDRAWN 3 $117,667 0 $0 1 $81,000 0 $0 FILES CLOSED FOR INCOMPLETENESS 0 $0 0 $0 0 $0 0 $0
Aggregated Statistics For Year 2005(Based on 12 full and 2 partial tracts) A) Conventional B) Refinancings C) Non-occupant Loans on Number Average Value Number Average Value Number Average Value
LOANS ORIGINATED 79 $79,746 11 $87,514 17 $63,056 APPLICATIONS APPROVED, NOT ACCEPTED 6 $84,060 0 $0 1 $107,910 APPLICATIONS DENIED 0 $0 0 $0 0 $0 APPLICATIONS WITHDRAWN 3 $58,897 1 $86,810 3 $58,897 FILES CLOSED FOR INCOMPLETENESS 0 $0 0 $0 0 $0
Aggregated Statistics For Year 2004(Based on 12 full and 1 partial tracts) A) Conventional B) Refinancings C) Non-occupant Loans on D) Loans On Manufactured Number Average Value Number Average Value Number Average Value Number Average Value
LOANS ORIGINATED 85 $88,393 26 $79,440 16 $63,423 1 $50,000 APPLICATIONS APPROVED, NOT ACCEPTED 7 $114,539 5 $101,160 4 $60,788 0 $0 APPLICATIONS DENIED 0 $0 0 $0 0 $0 0 $0 APPLICATIONS WITHDRAWN 2 $88,735 1 $87,170 1 $68,200 0 $0 FILES CLOSED FOR INCOMPLETENESS 0 $0 0 $0 0 $0 0 $0
Aggregated Statistics For Year 2003(Based on 12 full and 1 partial tracts) A) Conventional B) Refinancings C) Non-occupant Loans on Number Average Value Number Average Value Number Average Value
LOANS ORIGINATED 127 $83,916 78 $89,399 24 $58,563 APPLICATIONS APPROVED, NOT ACCEPTED 4 $141,110 7 $120,477 2 $84,000 APPLICATIONS DENIED 2 $228,005 2 $49,500 1 $36,000 APPLICATIONS WITHDRAWN 4 $82,912 4 $84,092 2 $88,000 FILES CLOSED FOR INCOMPLETENESS 0 $0 0 $0 0 $0
Aggregated Statistics For Year 2002(Based on 9 full and 1 partial tracts) A) Conventional B) Refinancings C) Non-occupant Loans on Number Average Value Number Average Value Number Average Value
LOANS ORIGINATED 95 $95,610 25 $88,980 15 $49,770 APPLICATIONS APPROVED, NOT ACCEPTED 5 $116,046 2 $91,500 0 $0 APPLICATIONS DENIED 2 $330,750 0 $0 0 $0 APPLICATIONS WITHDRAWN 1 $231,900 1 $107,000 0 $0 FILES CLOSED FOR INCOMPLETENESS 1 $43,000 0 $0 0 $0
Aggregated Statistics For Year 2001(Based on 10 full and 2 partial tracts) A) Conventional B) Refinancings C) Non-occupant Loans on Number Average Value Number Average Value Number Average Value
LOANS ORIGINATED 73 $80,127 9 $96,273 12 $52,959 APPLICATIONS APPROVED, NOT ACCEPTED 12 $74,710 2 $114,970 4 $74,325 APPLICATIONS DENIED 0 $0 0 $0 0 $0 APPLICATIONS WITHDRAWN 1 $23,000 0 $0 1 $23,000 FILES CLOSED FOR INCOMPLETENESS 1 $107,010 0 $0 1 $65,000
Aggregated Statistics For Year 2000(Based on 9 full and 2 partial tracts) A) Conventional B) Refinancings C) Non-occupant Loans on Number Average Value Number Average Value Number Average Value
LOANS ORIGINATED 60 $69,782 8 $63,448 8 $56,838 APPLICATIONS APPROVED, NOT ACCEPTED 9 $74,138 4 $92,132 0 $0 APPLICATIONS DENIED 2 $130,560 0 $0 0 $0 APPLICATIONS WITHDRAWN 2 $83,000 0 $0 0 $0 FILES CLOSED FOR INCOMPLETENESS 2 $49,500 0 $0 2 $49,500
Aggregated Statistics For Year 1999(Based on 10 full and 1 partial tracts) A) Conventional B) Refinancings C) Non-occupant Loans on Number Average Value Number Average Value Number Average Value
LOANS ORIGINATED 116 $80,025 9 $68,233 6 $47,947 APPLICATIONS APPROVED, NOT ACCEPTED 14 $91,321 3 $59,890 0 $0 APPLICATIONS DENIED 3 $78,467 0 $0 0 $0 APPLICATIONS WITHDRAWN 3 $65,333 1 $88,400 0 $0 FILES CLOSED FOR INCOMPLETENESS 1 $34,660 0 $0 0 $0
Fire-safe hotels and motels in Victoria, Texas:
Motel 6 #0225 Victoria, 3716 Houston Hwy, Victoria, Texas 77901 Phone: (361) 573-1273, Fax: (361) 573-1831
Victoria Fairfield Inn, 7502 N Navarro St, Victoria, Texas 77904 Phone: (361) 582-0660, Fax: (361) 582-0660
Howard Johnson Plaza Hotel Victoria, 2705 E Houston Hwy, Victoria, Texas 77901 Phone: (361) 575-0251, Fax: (361) 575-8362
La Quinta Inn, 11130 NW Fwy, Victoria, Texas 77902 Phone: (713) 680-8282, Fax: (713) 680-1887
Hampton Inn Victoria, 7006 N Navarro, Victoria, Texas 77904 Phone: (361) 573-9911, Fax: (361) 573-1171
Best Western Victoria Inn & Suites, 8106 NE Zac Lentz Pkwy, Victoria, Texas 77904 Phone: (361) 485-2300, Fax: (361) 485-2306
Lone Star Inn & Suites, 1907 Us Hwy 59 N, Victoria, Texas 77905 Phone: (361) 579-0225, Fax: (361) 579-0082
Holiday Inn Express Hotel & Suites, 111 Huvar St, Victoria, Texas 77904 Phone: (361) 575-1600, Fax: (361) 582-0541
10 other hotels and motels
All 18 fire-safe hotels and motels in Victoria, Texas
Most common first names in Victoria, TX among deceased individuals Name Count Lived (average)
Mary 401 76.6 years John 292 71.4 years James 254 70.5 years William 248 74.4 years Robert 207 71.6 years Charles 153 73.4 years George 137 73.6 years Frank 136 72.9 years Joe 133 73.7 years Henry 129 74.1 years
Most common last names in Victoria, TX among deceased individuals Last name Count Lived (average)
Garcia 190 70.1 years Williams 124 72.4 years Smith 115 77.0 years Brown 114 76.7 years Garza 103 68.8 years Rodriguez 100 70.4 years Martinez 100 70.2 years Johnson 94 74.5 years Gonzales 92 68.7 years Hernandez 80 72.7 years
Victoria compared to Texas state average:
Unemployed percentage significantly below state average. Median age above state average. Foreign-born population percentage below state average.
#8 on the list of "Top 101 cities with largest percentage of males in industries: mining, quarrying, and oil and gas extraction (population 50,000+)"
#11 on the list of "Top 101 cities with largest percentage of females in occupations: law enforcement workers including supervisors (population 50,000+)"
#13 on the list of "Top 101 cities with the most people below the poverty level, excluding cities with 15% or more of residents in college and with the median age below 28 (population 50,000+)"
#14 on the list of "Top 101 cities with the most people born in the same U.S. state as the city (population 50,000+)"
#23 on the list of "Top 101 cities with the most people below 50% of the poverty level, excluding cities with 15% or more of residents in college and with the median age below 28 (population 50,000+)"
#25 on the list of "Top 101 cities with the highest average humidity (population 50,000+)"
#27 on the list of "Top 101 cities with largest percentage of workers with very short commute times (9 minutes or less) (population 50,000+)"
#30 on the list of "Top 101 cities with largest percentage of females in occupations: healthcare support occupations (population 50,000+)"
#30 on the list of "Top 101 cities with largest percentage of females in occupations: health technologists and technicians (population 50,000+)"
#33 on the list of "Top 101 cities with largest percentage of males in occupations: production occupations (population 50,000+)"
#38 on the list of "Top 101 cities with largest percentage of females in occupations: food preparation and serving related occupations (population 50,000+)"
#52 on the list of "Top 101 cities with largest percentage of males in occupations: construction and extraction occupations (population 50,000+)"
#55 on the list of "Top 101 cities with largest percentage of females in industries: retail trade (population 50,000+)"
#58 on the list of "Top 101 cities with the most users submitting photos to our site per 10,000 residents (population 50,000+)"
#58 on the list of "Top 101 cities with largest percentage of females in industries: mining, quarrying, and oil and gas extraction (population 50,000+)"
#59 on the list of "Top 101 cities with largest percentage of females in industries: management of companies and enterprises (population 50,000+)"
#63 on the list of "Top 101 cities with the highest maximum monthly morning or afternoon humidity (population 50,000+)"
#66 on the list of "Top 101 cities with the largest city-data.com crime index decrease from 2011 to 2012 (population 50,000+)"
#66 on the list of "Top 100 cities with lowest ratio of median house value to median household income (pop. 50,000+)"
#67 on the list of "Top 101 cities with the hottest summers (population 50,000+)"
#35 (77904) on the list of "Top 101 zip codes with the largest percentage of Czech first ancestries (pop 5,000+)"
Top Patent Applicants
Brent J. Stahlman (5)
Thomas N. Hendryx (5)
Ivan J. Hartley (3)
Kenneth W. Stokley (3)
Gregory A. Carman (2)
James D. Hastings (2)
Phillip Wu (2)
David Lee Valdez (2)
Thomas J. Bradley (2)
Haur-Horng Yang (2)
Total of 62 patent applications in 2008-2024.
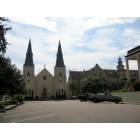
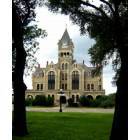

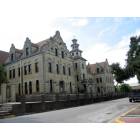
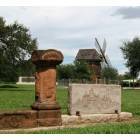
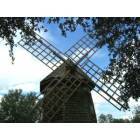
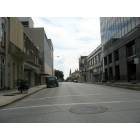
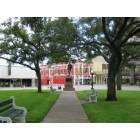
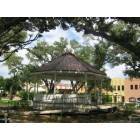
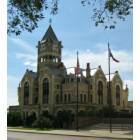
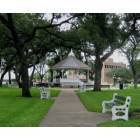
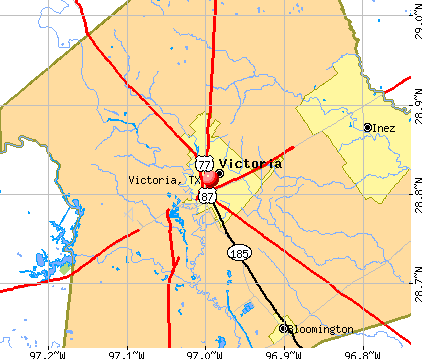


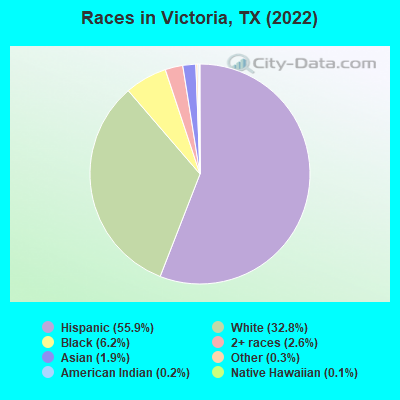
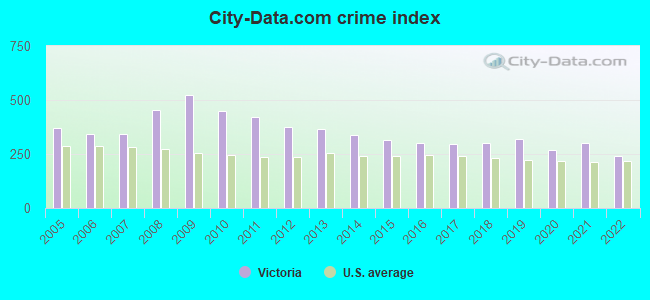
 Recent articles from our blog. Our writers, many of them Ph.D. graduates or candidates, create easy-to-read articles on a wide variety of topics.

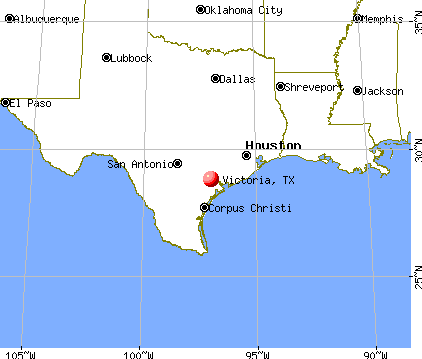
 (78.3 miles
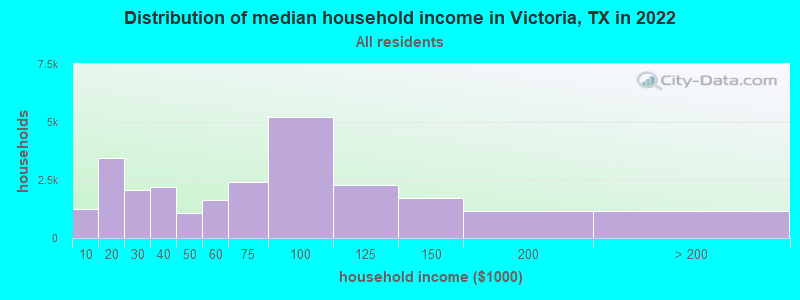
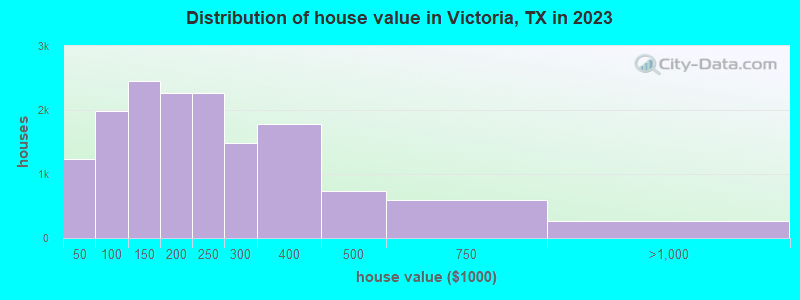

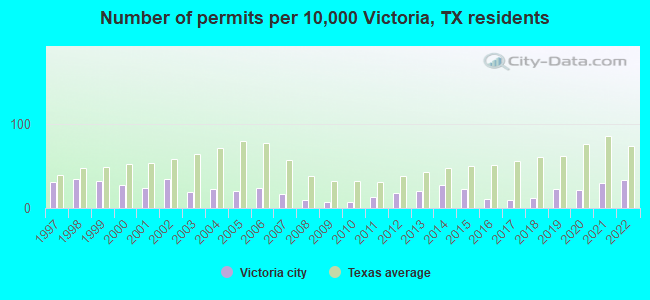
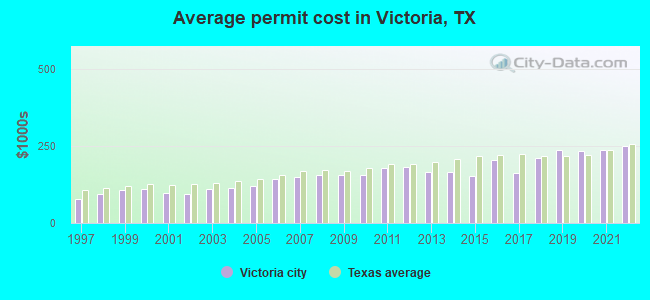
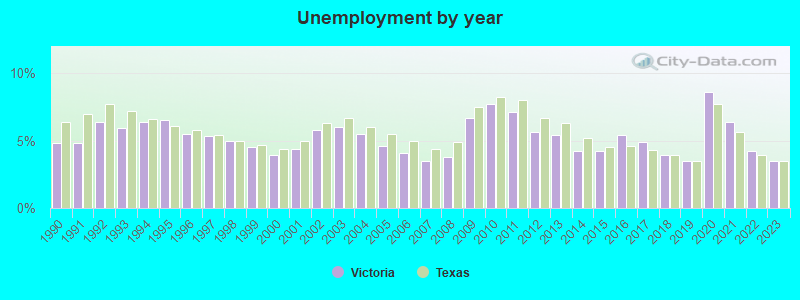
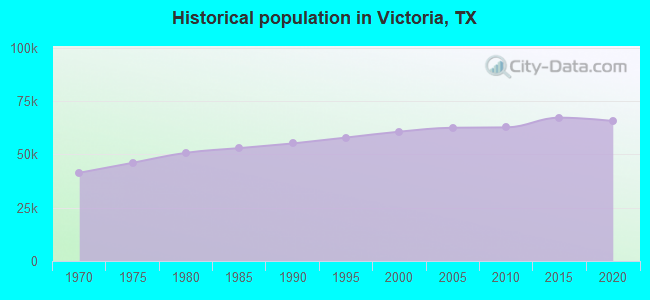
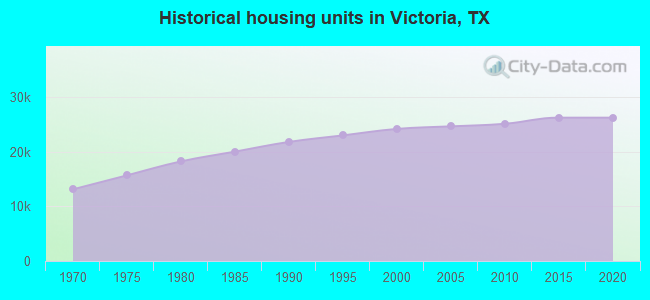
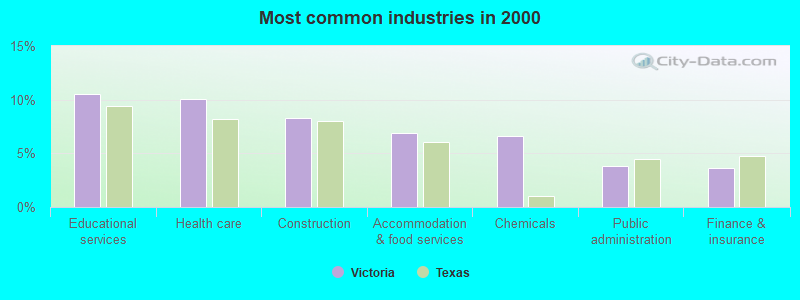
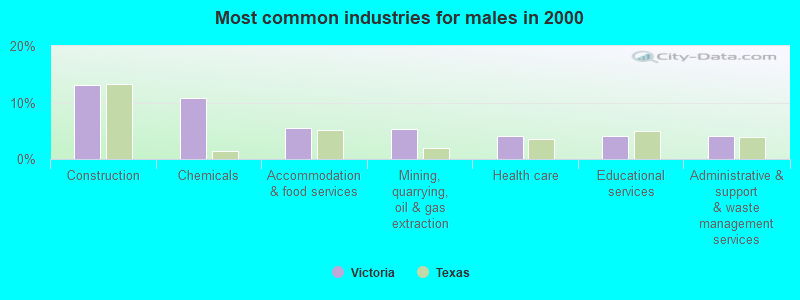
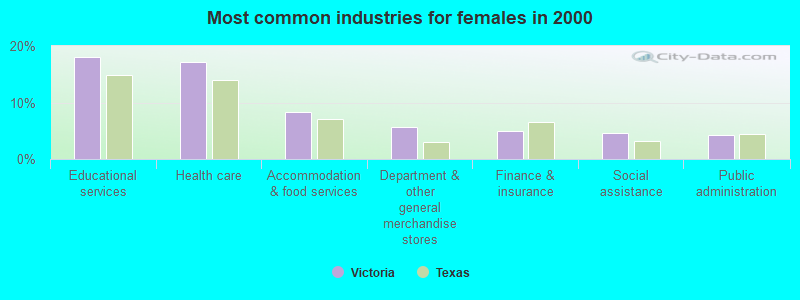
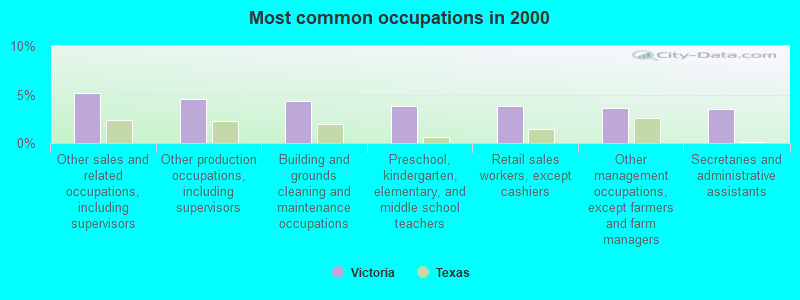
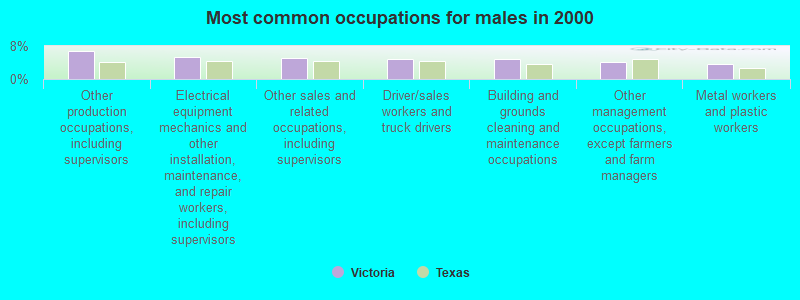
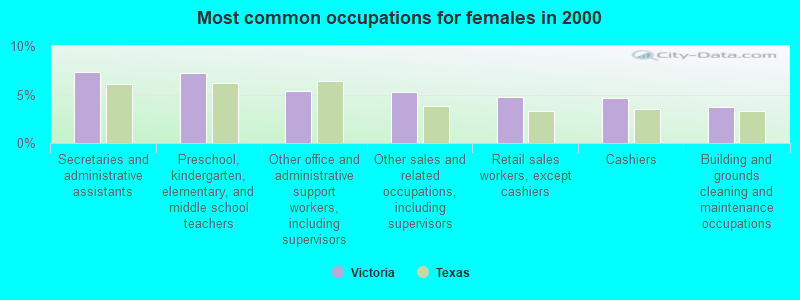

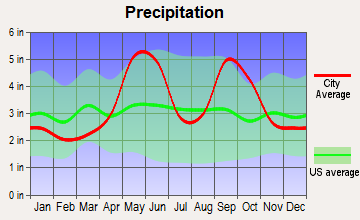
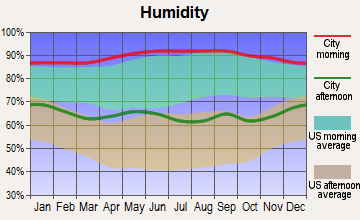
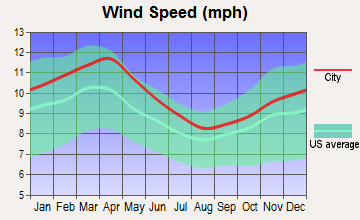
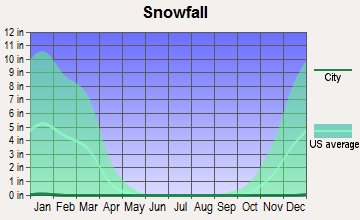
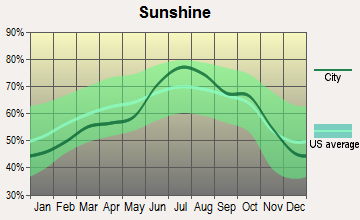
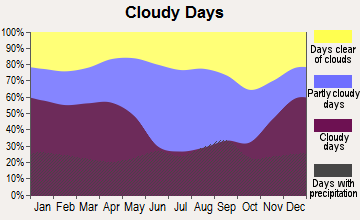
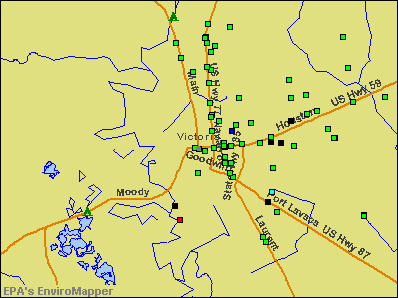

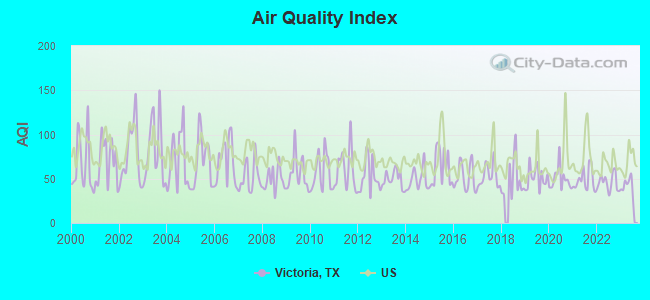
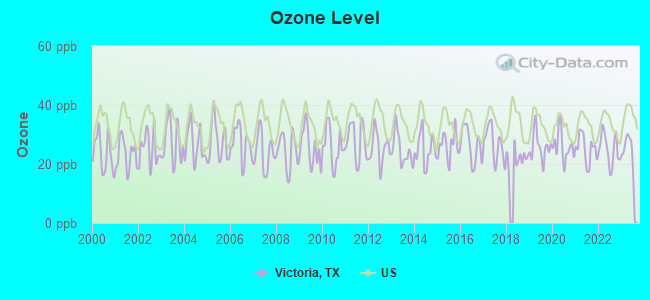

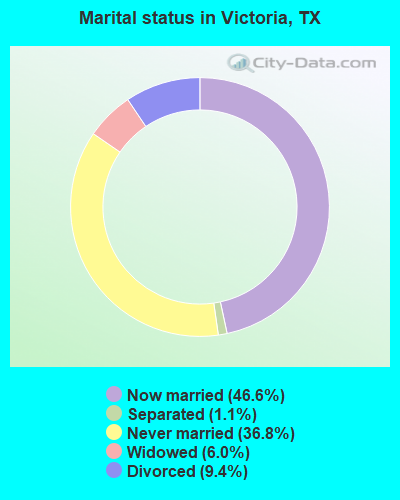
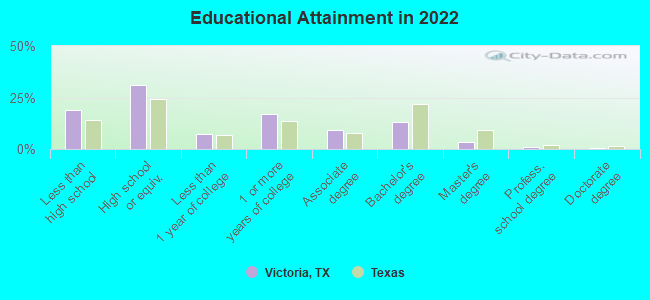
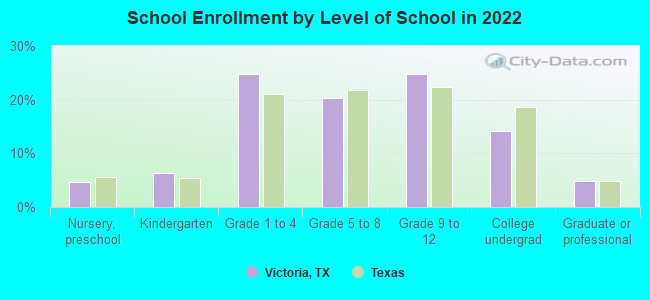
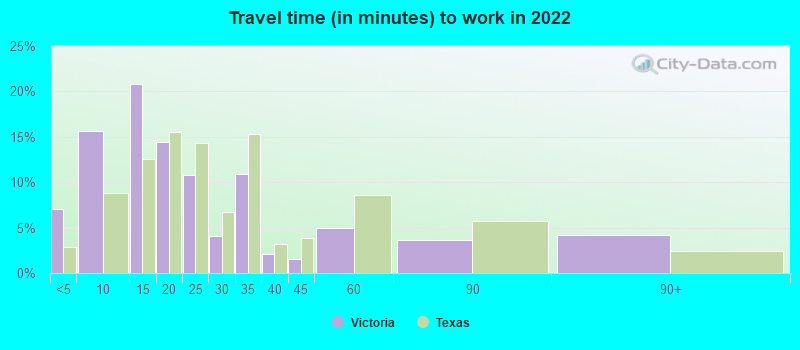
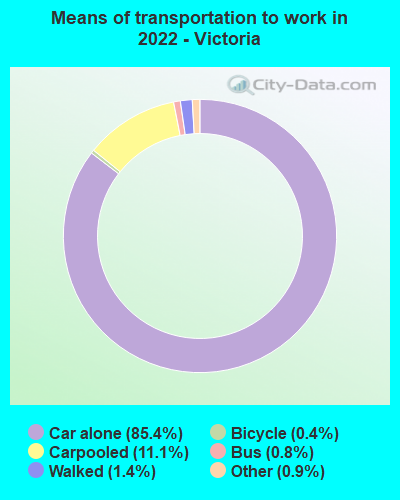

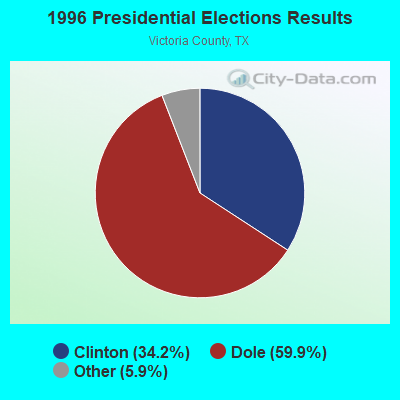

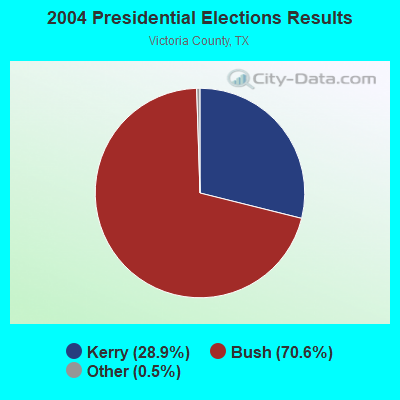
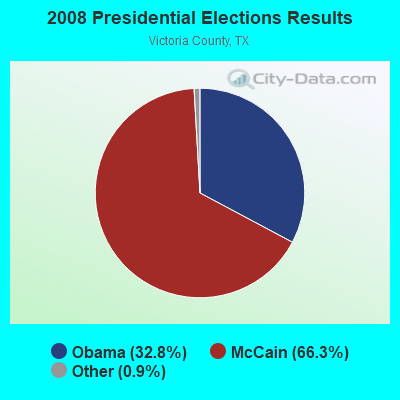

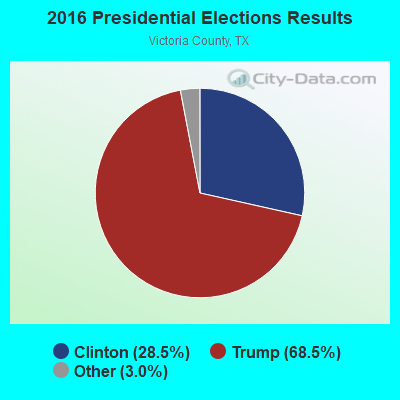

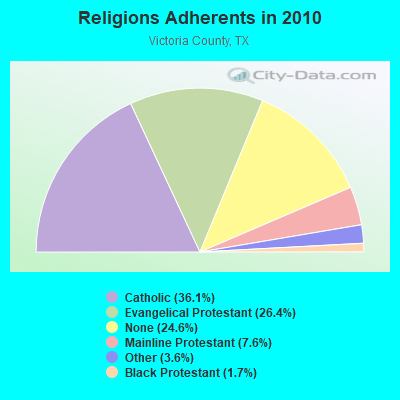
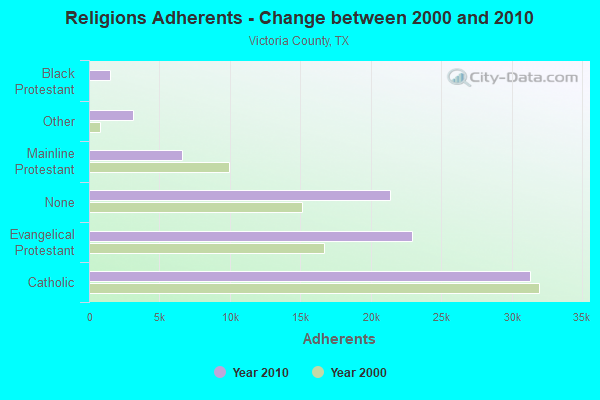
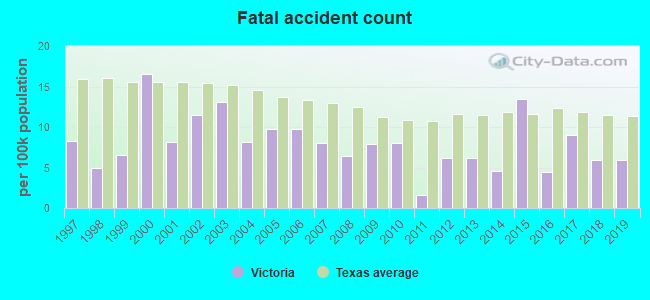
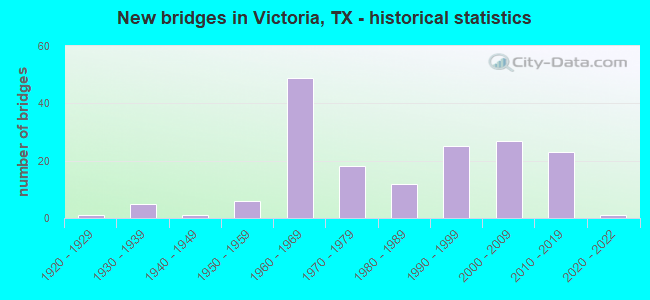
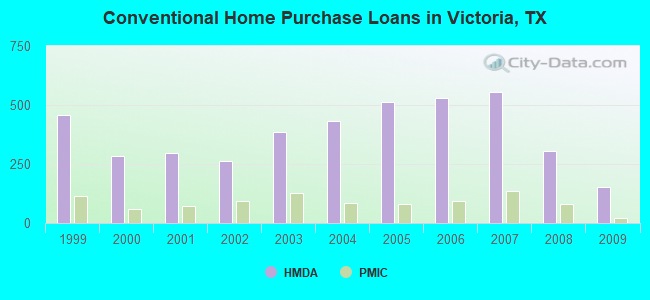
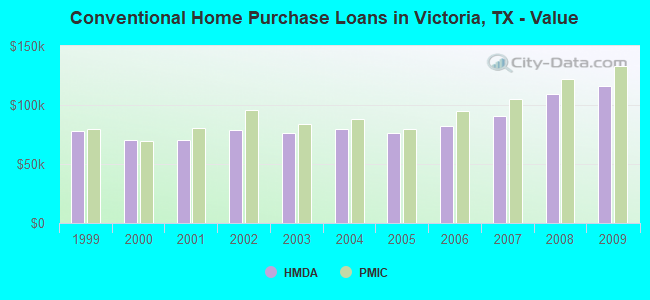
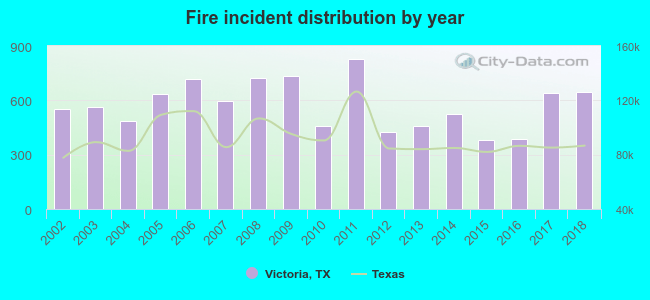 Based on the data from the years 2002 - 2018 the average number of fires per year is 574. The highest number of reported fire incidents - 830 took place in 2011, and the least - 383 in 2015. The data has a growing trend.
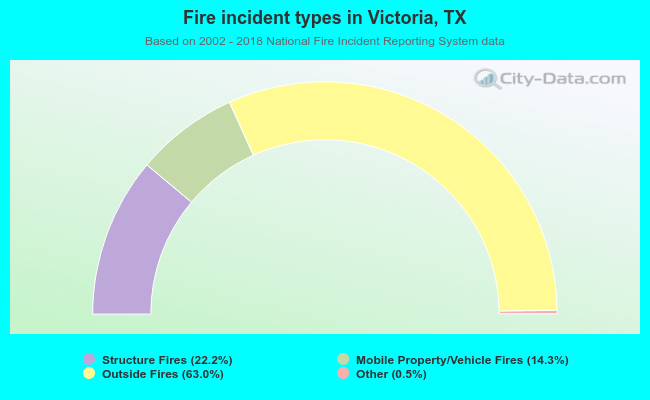 When looking into fire subcategories, the most incidents belonged to: Outside Fires (63.0%), and Structure Fires (22.2%).