Estimated zip code population in 2022: 9,449 Zip code population in 2010: 7,255 Zip code population in 2000: 6,646
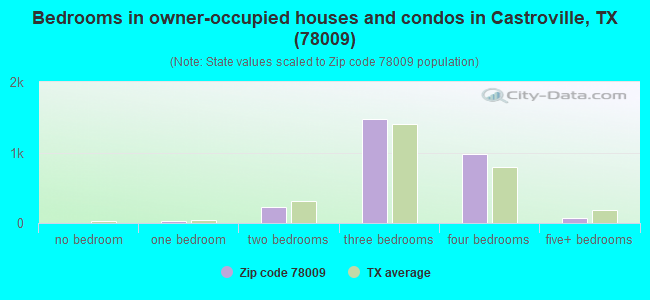
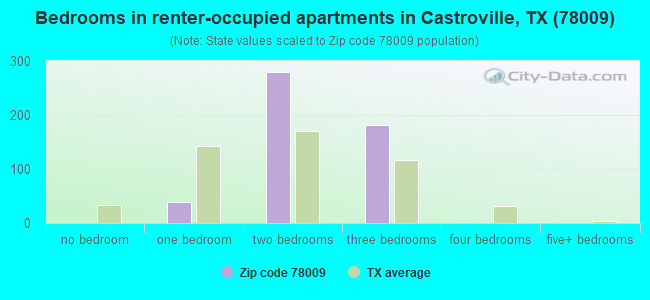
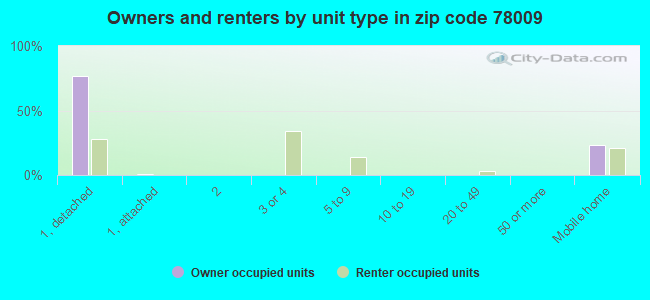
Houses and condos: 3,678 Renter-occupied apartments: 510
% of renters here:
16%
State:
38%
March 2022 cost of living index in zip code 78009: 84.2 (less than average, U.S. average is 100)
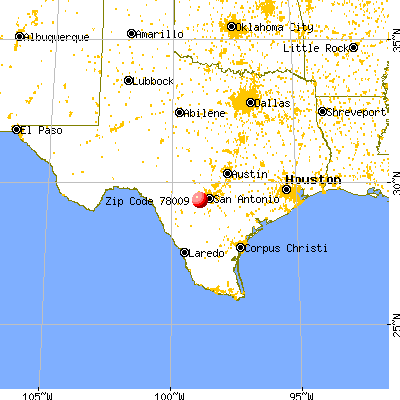
Land area: 71.5 sq. mi. Water area: 0.4 sq. mi.
Population density: 132 people per square mile
(very low).
OSM Map
General Map
Google Map
MSN Map
OSM Map
General Map
Google Map
MSN Map
OSM Map
General Map
Google Map
MSN Map
OSM Map
General Map
Google Map
MSN Map
Please wait while loading the map...
Real estate property taxes paid for housing units in 2022:
This zip code:
1.1% ($3,927)
Texas:
1.5% ($4,050)
Median real estate property taxes paid for housing units with mortgages in 2022: $3,832 (1.0%) Median real estate property taxes paid for housing units with no mortgage in 2022: $4,101 (1.1%)
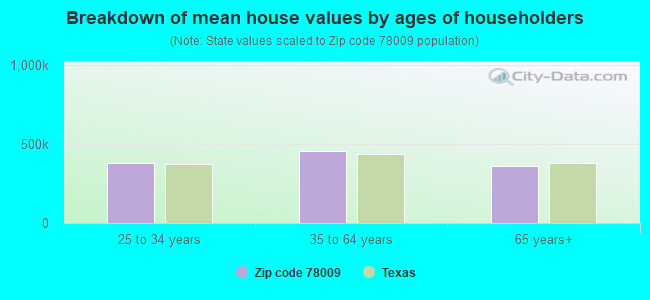
Estimated median house/condo value in 2022: $370,286
78009:
$370,286
Texas:
$275,400
According to our research of Texas and other state lists, there were 15 registered sex offenders living in 78009 zip code as of April 27, 2024. The ratio of all residents to sex offenders in zip code 78009 is 597 to 1. The ratio of registered sex offenders to all residents in this zip code is lower than the state average.
Median resident age:
This zip code:
42.8 years
Texas median age:
35.6 years
Average household size:
This zip code:
2.8 people
Texas:
2.6 people
Averages for the 2020 tax year for zip code 78009, filed in 2021:
Average Adjusted Gross Income (AGI) in 2020: $77,382 (Individual Income Tax Returns)
Here:
$77,382
State:
$77,054
Salary/wage: $66,287 (reported on 80.5% of returns)
Here:
$66,287
State:
$62,766
(% of AGI for various income ranges: 1178.2% for AGIs below $25k, 3394.4% for AGIs $25k-50k, 6353.1% for AGIs $50k-75k, 8950.4% for AGIs $75k-100k, 18382.6% for AGIs $100k-200k, 61343.3% for AGIs over 200k)
Taxable interest for individuals: $1,831 (reported on 32.4% of returns)
This zip code:
$1,831
Texas:
$2,665
(% of AGI for various income ranges: 17.8% for AGIs below $25k, 19.1% for AGIs $25k-50k, 65.2% for AGIs $50k-75k, 127.0% for AGIs $75k-100k, 130.0% for AGIs $100k-200k, 1146.7% for AGIs over 200k)
Ordinary dividends: $4,851 (reported on 16.7% of returns)
Here:
$4,851
State:
$10,044
(% of AGI for various income ranges: 19.6% for AGIs below $25k, 36.1% for AGIs $25k-50k, 80.7% for AGIs $50k-75k, 125.2% for AGIs $75k-100k, 226.4% for AGIs $100k-200k, 1455.6% for AGIs over 200k)
Net capital gain/loss in AGI: +$13,896 (reported on 15.4% of returns)
Here:
+$13,896
State:
+$39,590
(% of AGI for various income ranges: 1.9% for AGIs below $25k, 9.5% for AGIs $25k-50k, 116.0% for AGIs $50k-75k, 143.7% for AGIs $75k-100k, 466.0% for AGIs $100k-200k, 6834.4% for AGIs over 200k)
Profit/loss from business: +$12,364 (reported on 17.4% of returns)
Here:
+$12,364
State:
+$10,888
(% of AGI for various income ranges: 172.0% for AGIs below $25k, 121.0% for AGIs $25k-50k, 234.3% for AGIs $50k-75k, 415.9% for AGIs $75k-100k, 295.0% for AGIs $100k-200k, 3720.0% for AGIs over 200k)
Taxable individual retirement arrangement distribution: $20,254 (reported on 8.4% of returns)
78009:
$20,254
Texas:
$24,740
(% of AGI for various income ranges: 55.2% for AGIs below $25k, 84.4% for AGIs $25k-50k, 197.1% for AGIs $50k-75k, 255.2% for AGIs $75k-100k, 447.8% for AGIs $100k-200k, 2830.0% for AGIs over 200k)
Total itemized deductions: $32,224 (reported on 8.6% of returns)
Here:
$32,224
State:
$40,428
(% of AGI for various income ranges: 131.1% for AGIs $25k-50k, 370.5% for AGIs $50k-75k, 493.3% for AGIs $75k-100k, 1052.8% for AGIs $100k-200k, 3396.7% for AGIs over 200k)
Charity contributions: $9,345 (reported on 7.0% of returns)
Here:
$9,345
State:
$18,201
(% of AGI for various income ranges: 10.5% for AGIs below $25k, 60.0% for AGIs $50k-75k, 78.9% for AGIs $75k-100k, 245.0% for AGIs $100k-200k, 1230.0% for AGIs over 200k)
Taxes paid: $7,989 (reported on 8.1% of returns)
78009:
$7,989
State:
$7,821
(% of AGI for various income ranges: 26.2% for AGIs $25k-50k, 62.6% for AGIs $50k-75k, 131.9% for AGIs $75k-100k, 274.4% for AGIs $100k-200k, 753.3% for AGIs over 200k)
Earned income credit: $2,334 (reported on 14.7% of returns)
Here:
$2,334
State:
$2,584
(% of AGI for various income ranges: 97.3% for AGIs below $25k, 75.1% for AGIs $25k-50k)
Percentage of individuals using paid preparers for their 2020 taxes: 91.6%
Here:
92%
State:
92%
(% for various income ranges: 90.5% for AGIs below $25k, 91.8% for AGIs $25k-50k, 91.8% for AGIs $50k-75k, 90.5% for AGIs $75k-100k, 93.3% for AGIs $100k-200k, 92.6% for AGIs over 200k)
Averages for the 2012 tax year for zip code 78009, filed in 2013:
Average Adjusted Gross Income (AGI) in 2012: $57,354 (Individual Income Tax Returns)
Here:
$57,354
State:
$65,384
Salary/wage: $47,932 (reported on 83.6% of returns)
Here:
$47,932
State:
$52,524
(% of AGI for various income ranges: 76.3% for AGIs below $25k, 77.7% for AGIs $25k-50k, 76.0% for AGIs $50k-75k, 71.7% for AGIs $75k-100k, 75.7% for AGIs $100k-200k, 45.5% for AGIs over 200k)
Taxable interest for individuals: $1,347 (reported on 33.9% of returns)
This zip code:
$1,347
Texas:
$2,372
(% of AGI for various income ranges: 1.2% for AGIs below $25k, 0.9% for AGIs $25k-50k, 0.7% for AGIs $50k-75k, 0.9% for AGIs $75k-100k, 0.7% for AGIs $100k-200k, 0.7% for AGIs over 200k)
Ordinary dividends: $3,100 (reported on 16.4% of returns)
Here:
$3,100
State:
$9,721
(% of AGI for various income ranges: 0.7% for AGIs below $25k, 0.8% for AGIs $25k-50k, 0.4% for AGIs $50k-75k, 1.2% for AGIs $75k-100k, 0.9% for AGIs $100k-200k, 1.2% for AGIs over 200k)
Net capital gain/loss in AGI: +$9,930 (reported on 13.2% of returns)
Here:
+$9,930
State:
+$35,319
(% of AGI for various income ranges: 0.6% for AGIs below $25k, 1.3% for AGIs $25k-50k, 0.8% for AGIs $50k-75k, 0.4% for AGIs $75k-100k, 1.2% for AGIs $100k-200k, 8.2% for AGIs over 200k)
Profit/loss from business: +$12,195 (reported on 19.0% of returns)
Here:
+$12,195
State:
+$13,732
(% of AGI for various income ranges: 7.5% for AGIs below $25k, 3.6% for AGIs $25k-50k, 2.1% for AGIs $50k-75k, 3.0% for AGIs $75k-100k, 2.6% for AGIs $100k-200k, 7.5% for AGIs over 200k)
Taxable individual retirement arrangement distribution: $13,311 (reported on 8.0% of returns)
78009:
$13,311
Texas:
$19,511
(% of AGI for various income ranges: 1.8% for AGIs below $25k, 2.4% for AGIs $25k-50k, 1.5% for AGIs $50k-75k, 2.1% for AGIs $75k-100k, 1.4% for AGIs $100k-200k, 2.4% for AGIs over 200k)
Total itemized deductions: $20,512 (19% of AGI, reported on 24.1% of returns)
Here:
$20,512
State:
$24,724
Here:
18.9% of AGI
State:
15.9% of AGI
(% of AGI for various income ranges: 6.9% for AGIs below $25k, 9.3% for AGIs $25k-50k, 8.2% for AGIs $50k-75k, 9.5% for AGIs $75k-100k, 10.2% for AGIs $100k-200k, 6.1% for AGIs over 200k)
Charity contributions: $3,986 (reported on 18.7% of returns)
Here:
$3,986
State:
$6,808
(% of AGI for various income ranges: 0.5% for AGIs below $25k, 0.9% for AGIs $25k-50k, 1.0% for AGIs $50k-75k, 1.4% for AGIs $75k-100k, 1.6% for AGIs $100k-200k, 1.6% for AGIs over 200k)
Taxes paid: $5,829 (reported on 24.1% of returns)
78009:
$5,829
State:
$6,921
(% of AGI for various income ranges: 1.4% for AGIs below $25k, 2.1% for AGIs $25k-50k, 2.0% for AGIs $50k-75k, 2.9% for AGIs $75k-100k, 3.3% for AGIs $100k-200k, 2.0% for AGIs over 200k)
Earned income credit: $2,420 (reported on 19.0% of returns)
Here:
$2,420
State:
$2,570
(% of AGI for various income ranges: 7.5% for AGIs below $25k, 1.3% for AGIs $25k-50k)
Percentage of individuals using paid preparers for their 2012 taxes: 49.7%
Here:
50%
State:
51%
(% for various income ranges: 46.6% for AGIs below $25k, 48.1% for AGIs $25k-50k, 51.0% for AGIs $50k-75k, 50.0% for AGIs $75k-100k, 53.5% for AGIs $100k-200k, 80.0% for AGIs over 200k)
Averages for the 2004 tax year for zip code 78009, filed in 2005:
Average Adjusted Gross Income (AGI) in 2004: $42,764 (Individual Income Tax Returns)
Here:
$42,764
State:
$47,881
Salary/wage: $39,127 (reported on 83.7% of returns)
Here:
$39,127
State:
$41,947
(% of AGI for various income ranges: 108.9% for AGIs below $10k, 75.6% for AGIs $10k-25k, 79.3% for AGIs $25k-50k, 78.5% for AGIs $50k-75k, 81.1% for AGIs $75k-100k, 69.5% for AGIs over 100k)
Taxable interest for individuals: $1,492 (reported on 40.7% of returns)
This zip code:
$1,492
Texas:
$2,255
(% of AGI for various income ranges: 4.5% for AGIs below $10k, 2.4% for AGIs $10k-25k, 1.4% for AGIs $25k-50k, 1.4% for AGIs $50k-75k, 0.8% for AGIs $75k-100k, 1.3% for AGIs over 100k)
Taxable dividends: $2,180 (reported on 18.9% of returns)
Here:
$2,180
State:
$4,261
(% of AGI for various income ranges: 1.7% for AGIs below $10k, 0.9% for AGIs $10k-25k, 0.8% for AGIs $25k-50k, 0.6% for AGIs $50k-75k, 1.0% for AGIs $75k-100k, 1.2% for AGIs over 100k)
Net capital gain/loss: +$6,716 (reported on 16.0% of returns)
Here:
+$6,716
State:
+$16,110
(% of AGI for various income ranges: 0.0% for AGIs below $10k, 0.5% for AGIs $10k-25k, 0.9% for AGIs $25k-50k, 0.9% for AGIs $50k-75k, 1.7% for AGIs $75k-100k, 6.0% for AGIs over 100k)
Profit/loss from business: +$9,918 (reported on 18.9% of returns)
Here:
+$9,918
State:
+$11,013
(% of AGI for various income ranges: 13.0% for AGIs below $10k, 5.2% for AGIs $10k-25k, 3.2% for AGIs $25k-50k, 4.7% for AGIs $50k-75k, 2.9% for AGIs $75k-100k, 5.1% for AGIs over 100k)
IRA payment deduction: $2,878 (reported on 3.1% of returns)
78009:
$2,878
Texas:
$3,120
(% of AGI for various income ranges: 0.2% for AGIs $10k-25k, 0.3% for AGIs $25k-50k, 0.2% for AGIs $50k-75k, 0.3% for AGIs $75k-100k, 0.2% for AGIs over 100k)
Self-employed pension: $12,500 (reported on 0.6% of returns)
Here:
$12,500
Texas:
$16,401
Total itemized deductions: $15,776 (20% of AGI, reported on 21.9% of returns)
Here:
$15,776
State:
$19,631
Here:
20.2% of AGI
State:
18.9% of AGI
(% of AGI for various income ranges: 6.3% for AGIs below $10k, 6.6% for AGIs $10k-25k, 7.8% for AGIs $25k-50k, 8.4% for AGIs $50k-75k, 9.8% for AGIs $75k-100k, 7.7% for AGIs over 100k)
Charity contributions deductions: $2,601 (3% of AGI, reported on 18.2% of returns)
Here:
$2,601
State:
$4,753
Here:
3.2% of AGI
State:
4.2% of AGI
(% of AGI for various income ranges: 0.7% for AGIs $10k-25k, 1.0% for AGIs $25k-50k, 1.1% for AGIs $50k-75k, 1.2% for AGIs $75k-100k, 1.4% for AGIs over 100k)
Total tax: $6,375 (reported on 72.9% of returns)
78009:
$6,375
State:
$9,058
(% of AGI for various income ranges: 4.3% for AGIs below $10k, 3.6% for AGIs $10k-25k, 6.3% for AGIs $25k-50k, 8.9% for AGIs $50k-75k, 10.3% for AGIs $75k-100k, 18.4% for AGIs over 100k)
Earned income credit: $1,910 (reported on 18.0% of returns)
Here:
$1,910
State:
$2,024
Percentage of individuals using paid preparers for their 2004 taxes: 57.2%
Here:
57%
State:
57%
(% for various income ranges: 53.6% for AGIs below $10k, 60.2% for AGIs $10k-25k, 55.8% for AGIs $25k-50k, 56.3% for AGIs $50k-75k, 56.6% for AGIs $75k-100k, 63.7% for AGIs over 100k)
Likely homosexual households (counted as self-reported same-sex unmarried-partner households)
Lesbian couples: 0.2% of all households
Gay men: 0.0% of all households
Household received Food Stamps/SNAP in the past 12 months: 114 Household did not receive Food Stamps/SNAP in the past 12 months: 3,150
Women who had a birth in the past 12 months: 108 (55 now married, 51 unmarried) Women who did not have a birth in the past 12 months: 1,689 (860 now married, 825 unmarried)
Housing units in zip code 78009 with a mortgage: 1,258 (114 second mortgage, 123 both second mortgage and home equity loan) Houses without a mortgage: 25
Median monthly owner costs for units with a mortgage: $2,028 Median monthly owner costs for units without a mortgage: $752
Residents with income below the poverty level in 2022:
This zip code:
9.0%
Whole state:
14.0%
Residents with income below 50% of the poverty level in 2022:
This zip code:
2.2%
Whole state:
7.4%
Median number of rooms in houses and condos:
Here:
6.7
State:
6.3
Median number of rooms in apartments:
Here:
4.3
State:
4.0
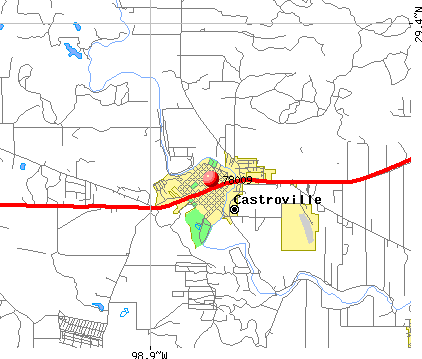
Notable locations in this zip code not listed on our city pages
Notable locations in zip code 78009: Castroville Historic District (A), Landmark Inn Complex (B), Castroville Volunteer Fire Department (C), Medina Valley Emergency Medical Service (D), Charles de Montel House (E). Display/hide their locations on the map
In group quarters: 103 (-1 institutionalized population)
Size of family households: 1,367 2-persons, 625 3-persons, 360 4-persons, 325 5-persons, 29 6-persons, 85 7-or-more-persons
Size of nonfamily households: 424 1-person, 32 2-persons, 15 3-persons
1,301 married couples with children.
510 single-parent households (142 men, 368 women).
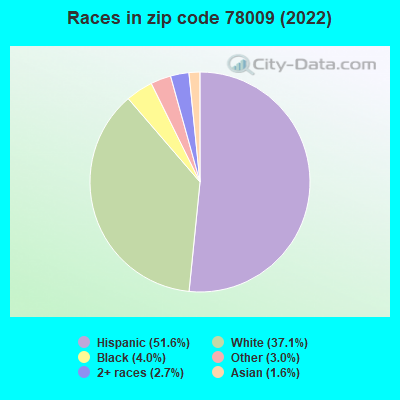
76.2% of residents of 78009 zip code speak English at home.
22.6% of residents speak Spanish at home (67% very well, 23% well, 4% not well, 6% not at all).
1.4% of residents speak other Indo-European language at home (88% very well, 12% well).
0.1% of residents speak Asian or Pacific Island language at home (100% well).
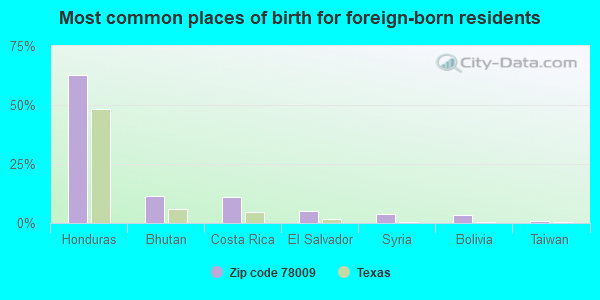
Foreign born population: 866 (9.2%) (51.4% of them are naturalized citizens)
This zip code:
9.2%
Whole state:
17.2%
63%Honduras
11%Bhutan
11%Costa Rica
5%El Salvador
4%Syria
3%Bolivia
1%Taiwan
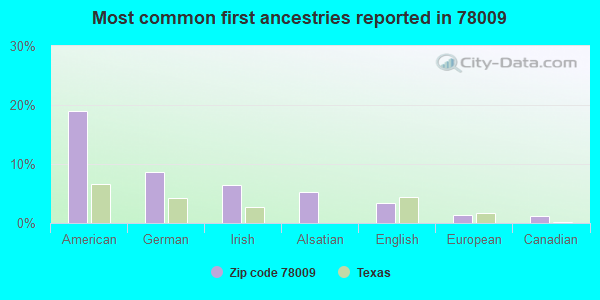
19%American
9%German
6%Irish
5%Alsatian
3%English
1%European
1%Canadian
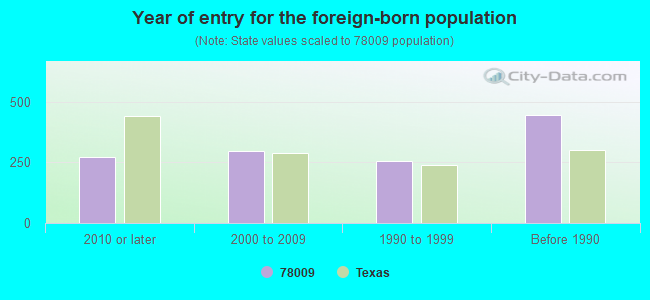
Year of entry for the foreign-born population
2742010 or later
2982000 to 2009
2571990 to 1999
445Before 1990
Housing units lacking complete plumbing facilities: 1.8% Housing units lacking complete kitchen facilities: 1.7%
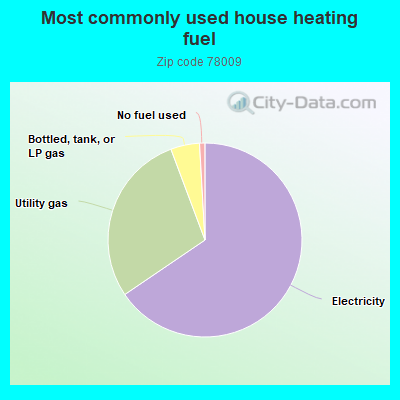
65.5%Electricity
28.8%Utility gas
4.8%Bottled, tank, or LP gas
0.9%No fuel used
Population in 1990: 4,262. Population change in the 1990s: +2,384 (+55.9%).
Place of birth for U.S.-born residents:
This state: 5,824
Northeast: 240
Midwest: 341
South: 1,285
West: 419
59% of the 78009 zip code residents lived in the same house 5 years ago. Out of people who lived in different houses, 33% lived in this county. Out of people who lived in different counties, 50% lived in Texas.
86% of the 78009 zip code residents lived in the same house 1 year ago. Out of people who lived in different houses, 38% moved from this county. Out of people who lived in different houses, 46% moved from different county within same state. Out of people who lived in different houses, 11% moved from different state. Out of people who lived in different houses, 6% moved from abroad.
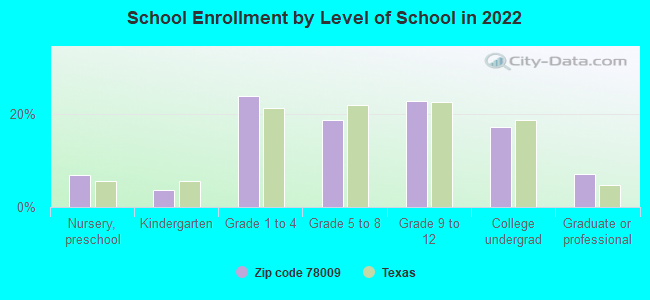
Private vs. public school enrollment:
Students in private schools in grades 1 to 8 (elementary and middle school): 164
Here:
18.5%
Texas:
8.8%
Students in private schools in grades 9 to 12 (high school): 92
Here:
19.7%
Texas:
8.0%
Students in private undergraduate colleges: 9
Here:
2.8%
Texas:
16.2%
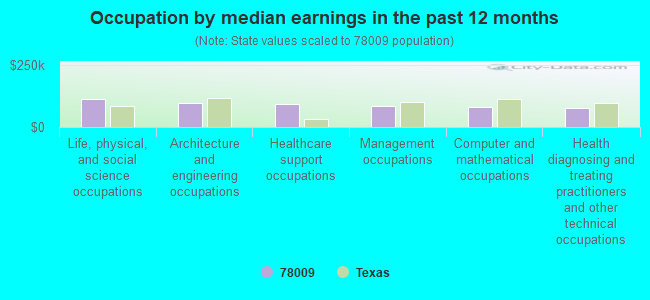
Occupation by median earnings in the past 12 months ($)
111,274Life, physical, and social science occupations
98,936Architecture and engineering occupations
91,480Healthcare support occupations
84,306Management occupations
81,906Computer and mathematical occupations
78,168Health diagnosing and treating practitioners and other technical occupations
Companies with federal contracts located in this zip code:
BEXAR CHEMICAL & SUPPLY INC (2235 HWY 90 WEST in CASTROVILLE, TX; small business) : $1,607,488 in 4 contractsfrom 1999 to 2002
$420,903 with Air Force for Custodial Janitorial Services. Signed on 2002-10-01. Completion date: 2002-11-04.
$400,438, same as above.Signed on 2001-10-01. Completion date: 2002-09-30.
$400,437, same as above.Signed on 2000-10-01. Completion date: 2001-09-30.
$385,710, same as above.Signed on 1999-10-05. Completion date: 2000-09-30.
P & L ENTERPRISES (4020 HWY 90 W in CASTROVILLE, TX; small business)
$62,475 with Defense Logistics Agency for Hardware, Commercial. Signed on 2004-04-08. Completion date: 2004-08-20.
BELL, JAMES F P A (8223FM 471 S in CASTROVILLE, TX; small business) : $37,556 in 10 contractsfrom 2004 to 2005
Contracts for Animal and Fisheries Studies, Veterinary/Animal Care Services by Army Signed by year:2000: $0; 2001: $0; 2002: $0; 2003: $0; 2004: $16,056; 2005: $21,500; 2006: $0.
Biggest contracts:
$14,500 with Army for Animal and Fisheries Studies. Signed on 2005-03-21. Completion date: 2005-12-31.
$12,000 with Army for Veterinary/Animal Care Services. Signed on 2005-03-21. Completion date: 2005-09-30.
$7,055 with Army for Animal and Fisheries Studies. Signed on 2004-02-02. Completion date: 2004-09-30.
$3,033, same as above.Signed on 2004-06-04. Completion date: 2004-03-31.
Top industries in this zip code by the number of employees in 2005:
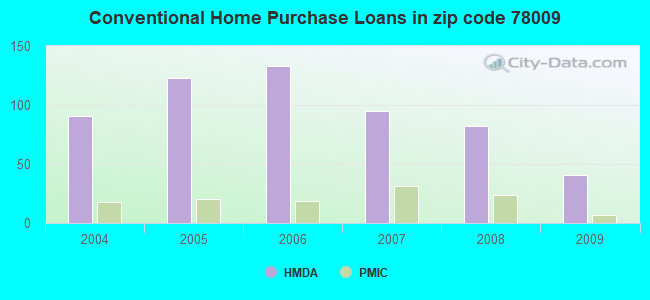
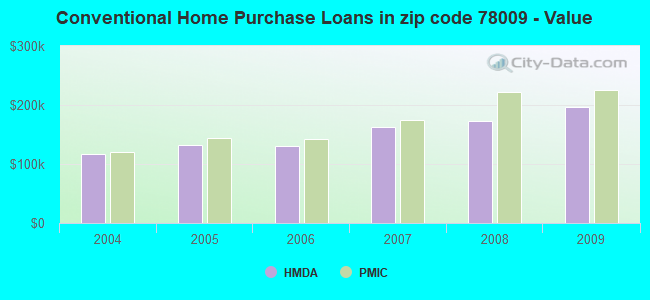
Detailed PMIC statistics for the following Tracts:9901.00
2002 - 2018 National Fire Incident Reporting System (NFIRS) incidents
According to the data from the years 2002 - 2018 the average number of fires per year is 42. The highest number of reported fire incidents - 71 took place in 2008, and the least - 26 in 2016. The data has a rising trend.
When looking into fire subcategories, the most reports belonged to: Outside Fires (61.4%), and Structure Fires (19.9%).
Fire incident types reported to NFIRS in Zip Code 78009


 Nearest zip codes: 78039, 78253, 78066, 78245, 78059, 78002.


 : $1,607,488 in 4 contracts from 1999 to 2002
 According to the data from the years 2002 - 2018 the average number of fires per year is 42. The highest number of reported fire incidents - 71 took place in 2008, and the least - 26 in 2016. The data has a rising trend.
 When looking into fire subcategories, the most reports belonged to: Outside Fires (61.4%), and Structure Fires (19.9%).