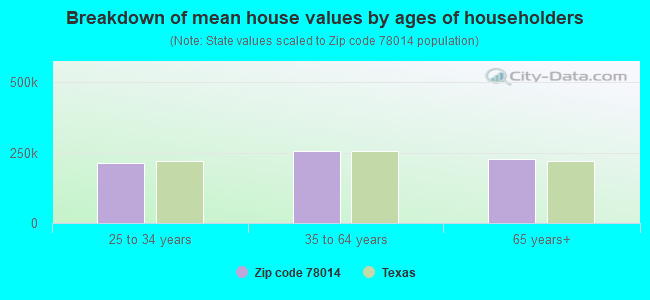
Estimated median house/condo value in 2022: $109,929
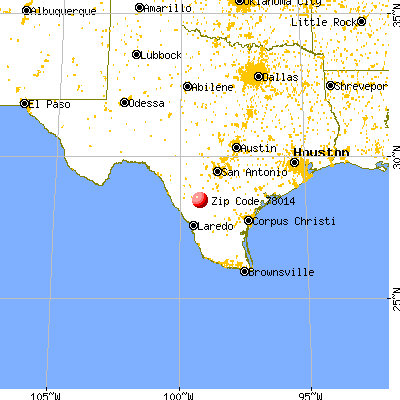
78014:
$109,929
Texas:
$275,400
According to our research of Texas and other state lists, there were 15 registered sex offenders living in 78014 zip code as of April 26, 2024. The ratio of all residents to sex offenders in zip code 78014 is 363 to 1. The ratio of registered sex offenders to all residents in this zip code is near the state average.
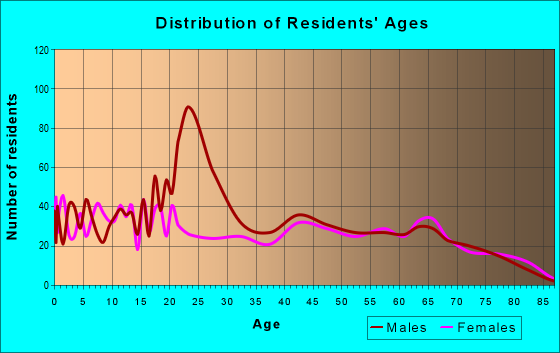
Median resident age:
This zip code:
36.1 years
Texas median age:
35.6 years
Average household size:
This zip code:
3.3 people
Texas:
2.6 people
Averages for the 2020 tax year for zip code 78014, filed in 2021:
Average Adjusted Gross Income (AGI) in 2020: $59,732 (Individual Income Tax Returns)
Here:
$59,732
State:
$77,054
Salary/wage: $38,869 (reported on 84.7% of returns)
Here:
$38,869
State:
$62,766
(% of AGI for various income ranges: 1404.8% for AGIs below $25k, 3760.9% for AGIs $25k-50k, 6279.0% for AGIs $50k-75k, 9530.0% for AGIs $75k-100k, 15297.5% for AGIs $100k-200k)
Taxable interest for individuals: $4,507 (reported on 14.8% of returns)
This zip code:
$4,507
Texas:
$2,665
(% of AGI for various income ranges: 1.1% for AGIs below $25k, 5.0% for AGIs $25k-50k, 11.0% for AGIs $50k-75k, 6.7% for AGIs $75k-100k, 151.2% for AGIs $100k-200k)
Ordinary dividends: $20,220 (reported on 5.1% of returns)
Here:
$20,220
State:
$10,044
(% of AGI for various income ranges: 84.8% for AGIs $50k-75k, 226.3% for AGIs $100k-200k)
Net capital gain/loss in AGI: +$56,764 (reported on 5.6% of returns)
Here:
+$56,764
State:
+$39,590
(% of AGI for various income ranges: 34.8% for AGIs $25k-50k, 316.2% for AGIs $100k-200k)
Taxable individual retirement arrangement distribution: $4,875 (reported on 2.0% of returns)
78014:
$4,875
Texas:
$24,740
(% of AGI for various income ranges: 92.9% for AGIs $50k-75k)
Total itemized deductions: $46,440 (reported on 5.1% of returns)
Here:
$46,440
State:
$40,428
(% of AGI for various income ranges: 315.7% for AGIs $25k-50k, 1510.0% for AGIs $75k-100k)
Charity contributions: $26,471 (reported on 3.6% of returns)
Here:
$26,471
State:
$18,201
(% of AGI for various income ranges: 160.0% for AGIs $50k-75k, 1896.2% for AGIs $100k-200k)
Taxes paid: $6,189 (reported on 4.6% of returns)
78014:
$6,189
State:
$7,821
(% of AGI for various income ranges: 46.3% for AGIs $25k-50k, 224.4% for AGIs $75k-100k)
Earned income credit: $2,656 (reported on 32.1% of returns)
Here:
$2,656
State:
$2,584
(% of AGI for various income ranges: 174.5% for AGIs below $25k, 120.9% for AGIs $25k-50k)
Percentage of individuals using paid preparers for their 2020 taxes: 89.8%
Here:
90%
State:
92%
(% for various income ranges: 88.0% for AGIs below $25k, 90.9% for AGIs $25k-50k, 88.5% for AGIs $50k-75k, 100.0% for AGIs $75k-100k, 92.9% for AGIs $100k-200k, 83.3% for AGIs over 200k)
Averages for the 2012 tax year for zip code 78014, filed in 2013:
Average Adjusted Gross Income (AGI) in 2012: $99,252 (Individual Income Tax Returns)
Here:
$99,252
State:
$65,384
Salary/wage: $35,781 (reported on 88.6% of returns)
Here:
$35,781
State:
$52,524
(% of AGI for various income ranges: 97.3% for AGIs below $25k, 91.6% for AGIs $25k-50k, 85.7% for AGIs $50k-75k, 84.8% for AGIs $75k-100k, 67.6% for AGIs $100k-200k, 2.6% for AGIs over 200k)
Taxable interest for individuals: $2,683 (reported on 14.4% of returns)
This zip code:
$2,683
Texas:
$2,372
(% of AGI for various income ranges: 0.2% for AGIs $50k-75k, 0.2% for AGIs $75k-100k, 0.3% for AGIs $100k-200k, 0.5% for AGIs over 200k)
Ordinary dividends: $5,136 (reported on 5.5% of returns)
Here:
$5,136
State:
$9,721
(% of AGI for various income ranges: 0.6% for AGIs below $25k, 0.4% for AGIs $75k-100k, 0.3% for AGIs over 200k)
Net capital gain/loss in AGI: +$116,610 (reported on 5.0% of returns)
Here:
+$116,610
State:
+$35,319
(% of AGI for various income ranges: 4.4% for AGIs $75k-100k, 8.6% for AGIs over 200k)
Profit/loss from business: +$2,936 (reported on 22.4% of returns)
Here:
+$2,936
State:
+$13,732
(% of AGI for various income ranges: 2.0% for AGIs $25k-50k, 2.6% for AGIs $50k-75k, 0.5% for AGIs $75k-100k, 7.4% for AGIs $100k-200k)
Taxable individual retirement arrangement distribution: $5,520 (reported on 2.5% of returns)
78014:
$5,520
Texas:
$19,511
Total itemized deductions: $26,279 (8% of AGI, reported on 14.4% of returns)
Here:
$26,279
State:
$24,724
Here:
8.1% of AGI
State:
15.9% of AGI
(% of AGI for various income ranges: 2.9% for AGIs below $25k, 7.5% for AGIs $25k-50k, 10.4% for AGIs $50k-75k, 10.0% for AGIs $75k-100k, 6.2% for AGIs $100k-200k, 1.8% for AGIs over 200k)
Charity contributions: $11,350 (reported on 9.0% of returns)
Here:
$11,350
State:
$6,808
(% of AGI for various income ranges: 0.5% for AGIs $25k-50k, 1.0% for AGIs $50k-75k, 1.1% for AGIs $75k-100k, 1.2% for AGIs $100k-200k, 1.2% for AGIs over 200k)
Taxes paid: $4,192 (reported on 11.9% of returns)
78014:
$4,192
State:
$6,921
(% of AGI for various income ranges: 0.3% for AGIs below $25k, 0.7% for AGIs $25k-50k, 1.2% for AGIs $50k-75k, 1.4% for AGIs $75k-100k, 1.2% for AGIs $100k-200k, 0.3% for AGIs over 200k)
Earned income credit: $2,721 (reported on 33.8% of returns)
Here:
$2,721
State:
$2,570
(% of AGI for various income ranges: 12.3% for AGIs below $25k, 1.7% for AGIs $25k-50k)
Percentage of individuals using paid preparers for their 2012 taxes: 57.2%
Here:
57%
State:
51%
(% for various income ranges: 51.5% for AGIs below $25k, 59.2% for AGIs $25k-50k, 59.1% for AGIs $50k-75k, 66.7% for AGIs $75k-100k, 63.6% for AGIs $100k-200k, 85.7% for AGIs over 200k)
Averages for the 2004 tax year for zip code 78014, filed in 2005:
Average Adjusted Gross Income (AGI) in 2004: $25,327 (Individual Income Tax Returns)
Here:
$25,327
State:
$47,881
Salary/wage: $22,808 (reported on 89.0% of returns)
Here:
$22,808
State:
$41,947
(% of AGI for various income ranges: 127.3% for AGIs below $10k, 86.9% for AGIs $10k-25k, 85.8% for AGIs $25k-50k, 84.5% for AGIs $50k-75k, 79.7% for AGIs $75k-100k, 35.8% for AGIs over 100k)
Taxable interest for individuals: $1,046 (reported on 18.0% of returns)
This zip code:
$1,046
Texas:
$2,255
(% of AGI for various income ranges: 2.8% for AGIs below $10k, 0.9% for AGIs $10k-25k, 0.5% for AGIs $25k-50k, 1.1% for AGIs $50k-75k, 0.3% for AGIs $75k-100k, 0.3% for AGIs over 100k)
Taxable dividends: $1,079 (reported on 6.0% of returns)
Here:
$1,079
State:
$4,261
(% of AGI for various income ranges: 0.9% for AGIs below $10k, 0.2% for AGIs $10k-25k, 0.3% for AGIs $25k-50k, 0.2% for AGIs $50k-75k, 0.1% for AGIs $75k-100k, 0.1% for AGIs over 100k)
Net capital gain/loss: +$1,726 (reported on 5.0% of returns)
Here:
+$1,726
State:
+$16,110
(% of AGI for various income ranges: -1.0% for AGIs below $10k, -0.0% for AGIs $10k-25k, 0.3% for AGIs $25k-50k, 0.3% for AGIs $50k-75k, 1.7% for AGIs over 100k)
Profit/loss from business: +$4,262 (reported on 16.2% of returns)
Here:
+$4,262
State:
+$11,013
(% of AGI for various income ranges: 9.0% for AGIs below $10k, 5.0% for AGIs $10k-25k, 2.6% for AGIs $25k-50k, 0.4% for AGIs $50k-75k, 3.8% for AGIs $75k-100k)
IRA payment deduction: $3,077 (reported on 0.8% of returns)
78014:
$3,077
Texas:
$3,120
Total itemized deductions: $16,896 (35% of AGI, reported on 11.4% of returns)
Here:
$16,896
State:
$19,631
Here:
35.2% of AGI
State:
18.9% of AGI
(% of AGI for various income ranges: 5.0% for AGIs $10k-25k, 11.2% for AGIs $25k-50k, 9.4% for AGIs $50k-75k, 7.0% for AGIs $75k-100k, 3.4% for AGIs over 100k)
Charity contributions deductions: $2,292 (4% of AGI, reported on 7.7% of returns)
Here:
$2,292
State:
$4,753
Here:
4.4% of AGI
State:
4.2% of AGI
(% of AGI for various income ranges: 0.2% for AGIs $10k-25k, 0.7% for AGIs $25k-50k, 0.8% for AGIs $50k-75k, 1.4% for AGIs $75k-100k, 1.3% for AGIs over 100k)
Total tax: $3,114 (reported on 54.8% of returns)
78014:
$3,114
State:
$9,058
(% of AGI for various income ranges: 3.3% for AGIs below $10k, 2.7% for AGIs $10k-25k, 5.4% for AGIs $25k-50k, 7.8% for AGIs $50k-75k, 10.9% for AGIs $75k-100k, 13.8% for AGIs over 100k)
Earned income credit: $2,116 (reported on 39.8% of returns)
Here:
$2,116
State:
$2,024
Percentage of individuals using paid preparers for their 2004 taxes: 70.1%
Here:
70%
State:
57%
(% for various income ranges: 64.1% for AGIs below $10k, 74.4% for AGIs $10k-25k, 71.4% for AGIs $25k-50k, 71.8% for AGIs $50k-75k, 61.1% for AGIs $75k-100k, 79.3% for AGIs over 100k)
Household received Food Stamps/SNAP in the past 12 months: 135 Household did not receive Food Stamps/SNAP in the past 12 months: 1,271
Women who did not have a birth in the past 12 months: 797 (184 now married, 617 unmarried)
Housing units in zip code 78014 with a mortgage: 408 Median monthly owner costs for units with a mortgage: $1,461 Median monthly owner costs for units without a mortgage: $458
Residents with income below the poverty level in 2022:
This zip code:
31.8%
Whole state:
14.0%
Residents with income below 50% of the poverty level in 2022:
This zip code:
18.9%
Whole state:
7.4%
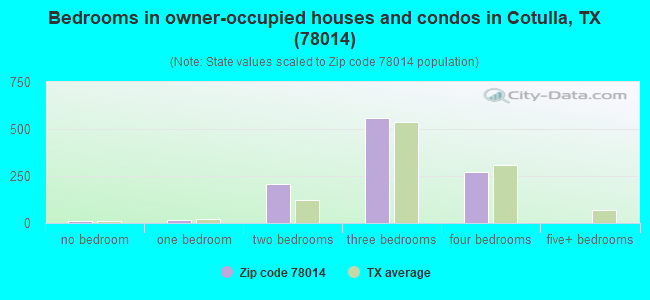
Median number of rooms in houses and condos:
Here:
6.0
State:
6.3
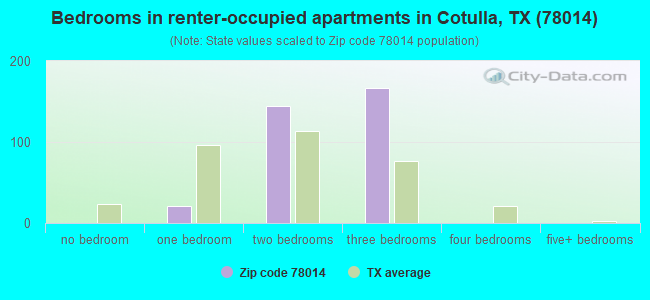
Median number of rooms in apartments:
Here:
4.3
State:
4.0
Notable locations in this zip code not listed on our city pages
Notable locations in zip code 78014: Sharp Ranch (A), Baylor Ranch (B), Manley Windmill (C), Quintana Camp (D), The White Kitchen (E), A H Giesecke (F), B Couger (G), Black Ranch (H), C Newton (I), Cameron Ranch (J), Cochina Ranch (K), E A Juvenal (L), G Sutton (M), G W Chapman (N), H O Brien (O), J McGowan (P), Light (Q), Pelon Ciz Ranch (R), R Wray (S), Burns Ranch (T). Display/hide their locations on the map
Reservoirs: Allerkamp Ranch Lake (A), Cameron Ranch Lake Number 4 (B), Cameron Ranch Lake Number 7 (C), Cameron Ranch Lake Number 5 (D), Charamusca Lake Number 7 (E), Charamusca Lake Number 4 (F), Arnold Lake Dam (G), Harrison Lake Number 2 (H). Display/hide their locations on the map
Streams, rivers, and creeks: Black Creek (A), San Casimiro Creek (B), Pelon Ciz Creek (C), Sauz Creek (D), Salt Creek (E), Sage Creek (F), Ruiz Creek (G), Slaughter Creek (H), Quintania Creek (I). Display/hide their locations on the map
In group quarters: 713 (-1 institutionalized population)
Size of family households: 299 2-persons, 337 3-persons, 262 4-persons, 122 5-persons, 55 6-persons, 57 7-or-more-persons
Size of nonfamily households: 196 1-person, 51 2-persons, 14 3-persons
459 married couples with children.
672 single-parent households (155 men, 517 women).
42.4% of residents of 78014 zip code speak English at home.
58.3% of residents speak Spanish at home (81% very well, 9% well, 6% not well, 5% not at all).
0.1% of residents speak Asian or Pacific Island language at home (100% well).
0.1% of residents speak other language at home (100% very well).
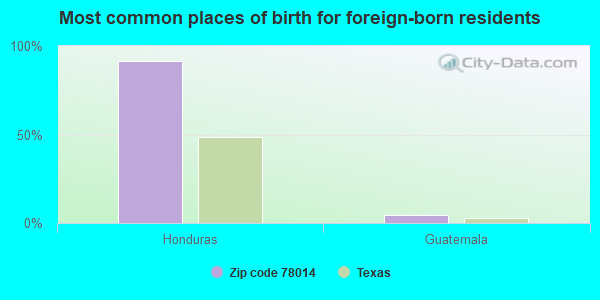
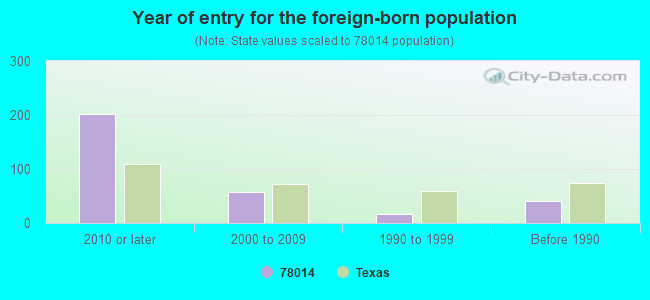
Foreign born population: 164 (3.1%) (0.0% of them are naturalized citizens)
:
3.1%
Whole state:
17.2%
91%Honduras
5%Guatemala
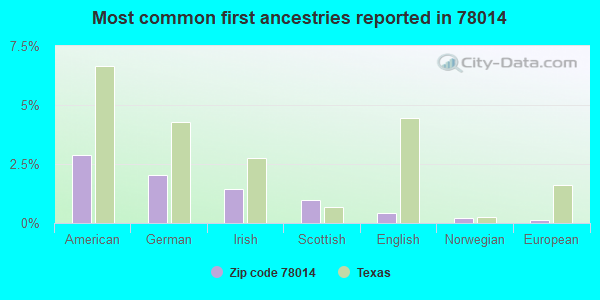
3%American
2%German
1%Irish
1%Scottish
0%English
0%Norwegian
0%European
Year of entry for the foreign-born population
2022010 or later
572000 to 2009
171990 to 1999
41Before 1990
Facilities with environmental interests located in this zip code:
AMERICAN TELEPHONE AND TELEGRAPH COMPANY (HIGHWAY 81 3.7 MI S in COTULLA, TX)
(Resource Conservation and Recovery Act (tracking hazardous waste)) Alternative names: AMERICAN TEL & TEL CO LONG LINES
Housing units lacking complete plumbing facilities: 9.2% Housing units lacking complete kitchen facilities: 4.9%
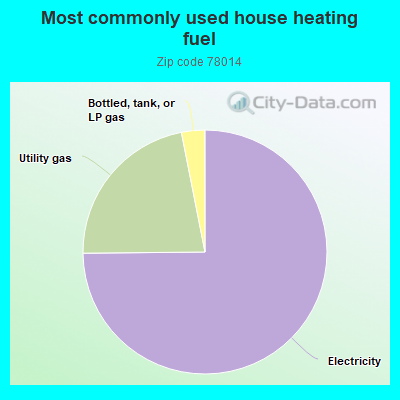
75.0%Electricity
22.1%Utility gas
3.1%Bottled, tank, or LP gas
Population in 1990: 4,369. Population change in the 1990s: +469 (+10.7%).
Place of birth for U.S.-born residents:
This state: 4,557
Northeast: 14
Midwest: 291
South: 102
West: 71
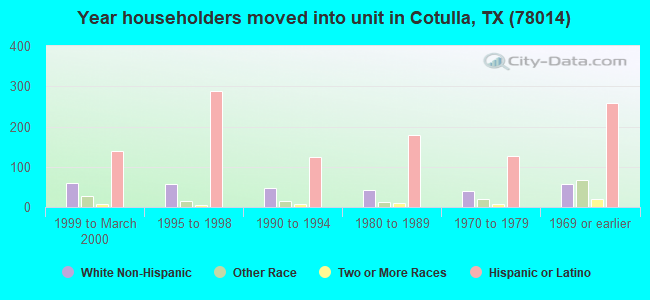
70% of the 78014 zip code residents lived in the same house 5 years ago. Out of people who lived in different houses, 49% lived in this county. Out of people who lived in different counties, 50% lived in Texas.
88% of the 78014 zip code residents lived in the same house 1 year ago. Out of people who lived in different houses, 25% moved from this county. Out of people who lived in different houses, 65% moved from different county within same state. Out of people who lived in different houses, 12% moved from different state.
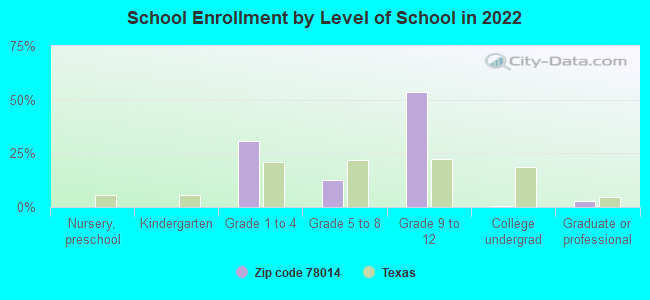
Private vs. public school enrollment:
Students in private schools in grades 1 to 8 (elementary and middle school): 59
Here:
9.7%
Texas:
8.8%
Students in private schools in grades 9 to 12 (high school): 123
Here:
16.4%
Texas:
8.0%
Students in private undergraduate colleges:
Here:
0.0%
Texas:
16.2%
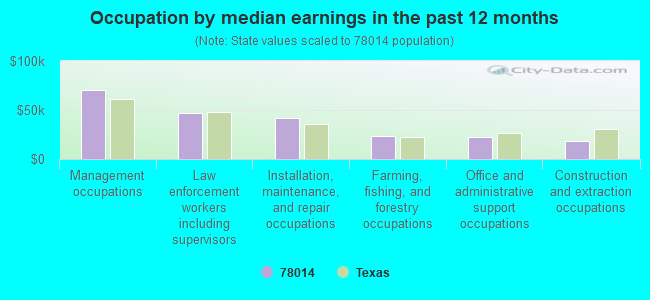
Occupation by median earnings in the past 12 months ($)
70,135Management occupations
47,245Law enforcement workers including supervisors
42,177Installation, maintenance, and repair occupations
23,221Farming, fishing, and forestry occupations
22,246Office and administrative support occupations
18,186Construction and extraction occupations
Companies with federal contracts located in this zip code:
C H H MANAGEMENT INC (IH 35 FM 468 in COTULLA, TX)
$12,650 with Army for Food Cooking, Baking, and Serving Equipment. Signed on 2002-07-25. Completion date: 2002-08-20.
Top industries in this zip code by the number of employees in 2005:
Administrative and Support and Waste Management and Remediation Services: Facilities Support Services (500-999 employees: 1 establishment)
Health Care and Social Assistance: All Other Outpatient Care Centers (20-49: 2, 10-19: 1)
Accommodation and Food Services: Full-Service Restaurants (20-49: 2, 1-4: 1)
Accommodation and Food Services: Hotels (except Casino Hotels) and Motels (10-19: 1, 5-9: 1, 1-4: 3)
Mining: Support Activities for Oil and Gas Operations (10-19: 1, 5-9: 1, 1-4: 2)
Arts, Entertainment, and Recreation: All Other Amusement and Recreation Industries (10-19: 1)
People in group quarters in 2010:
580 people in state prisons
8 people in local jails and other municipal confinement facilities
People in group quarters in 2000:
551 people in state prisons
48 people in short-term care, detention or diagnostic centers for delinquent children
2 people in nursing homes
2 people in other noninstitutional group quarters
Fatal accident statistics in 2014:
Fatal accident count: 10
Vehicles involved in fatal accidents: 14
Fatal accidents caused by drunken drivers: 1
Fatalities: 14
Persons involved in fatal accidents: 19
Pedestrians involved in fatal accidents: 2
Fatal accident statistics in 2013:
Fatal accident count: 7
Vehicles involved in fatal accidents: 14
Fatal accidents caused by drunken drivers: 1
Fatalities: 7
Persons involved in fatal accidents: 19
Pedestrians involved in fatal accidents: 0
2006 - 2018 National Fire Incident Reporting System (NFIRS) incidents
Based on the data from the years 2006 - 2018 the average number of fires per year is 85. The highest number of fires - 183 took place in 2011, and the least - 6 in 2007. The data has an increasing trend.
When looking into fire subcategories, the most incidents belonged to: Outside Fires (66.8%), and Mobile Property/Vehicle Fires (18.6%).
Fire incident types reported to NFIRS in Zip Code 78014


 Nearest zip codes: 78001, 78017, 78021, 78830, 78019, 78061.


 Based on the data from the years 2006 - 2018 the average number of fires per year is 85. The highest number of fires - 183 took place in 2011, and the least - 6 in 2007. The data has an increasing trend.
 When looking into fire subcategories, the most incidents belonged to: Outside Fires (66.8%), and Mobile Property/Vehicle Fires (18.6%).