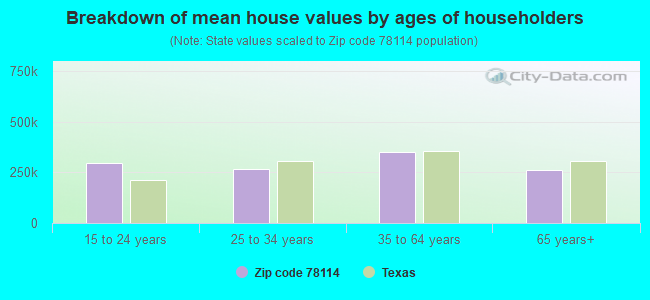
Estimated zip code population in 2022: 23,978 Zip code population in 2010: 20,103 Zip code population in 2000: 16,665
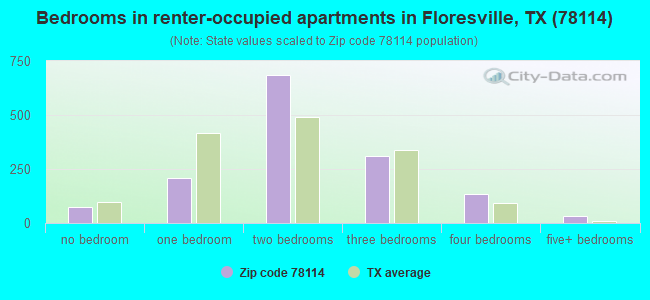
Houses and condos: 9,335 Renter-occupied apartments: 1,450
% of renters here:
17%
State:
38%
March 2022 cost of living index in zip code 78114: 80.6 (low, U.S. average is 100)
Land area: 366.9 sq. mi. Water area: 1.9 sq. mi.
Population density: 65 people per square mile
(very low).
OSM Map
General Map
Google Map
MSN Map
OSM Map
General Map
Google Map
MSN Map
OSM Map
General Map
Google Map
MSN Map
OSM Map
General Map
Google Map
MSN Map
Please wait while loading the map...
Real estate property taxes paid for housing units in 2022:
This zip code:
1.2% ($3,486)
Texas:
1.5% ($4,050)
Median real estate property taxes paid for housing units with mortgages in 2022: $4,676 (1.4%) Median real estate property taxes paid for housing units with no mortgage in 2022: $2,522 (1.1%)
Averages for the 2020 tax year for zip code 78114, filed in 2021:
Average Adjusted Gross Income (AGI) in 2020: $63,966 (Individual Income Tax Returns)
Here:
$63,966
State:
$77,054
Salary/wage: $57,080 (reported on 80.7% of returns)
Here:
$57,080
State:
$62,766
(% of AGI for various income ranges: 1132.0% for AGIs below $25k, 3432.9% for AGIs $25k-50k, 6048.2% for AGIs $50k-75k, 8979.3% for AGIs $75k-100k, 16490.6% for AGIs $100k-200k, 53610.0% for AGIs over 200k)
Taxable interest for individuals: $1,155 (reported on 28.1% of returns)
This zip code:
$1,155
Texas:
$2,665
(% of AGI for various income ranges: 17.0% for AGIs below $25k, 16.8% for AGIs $25k-50k, 37.3% for AGIs $50k-75k, 38.6% for AGIs $75k-100k, 109.3% for AGIs $100k-200k, 579.2% for AGIs over 200k)
Ordinary dividends: $3,061 (reported on 11.9% of returns)
Here:
$3,061
State:
$10,044
(% of AGI for various income ranges: 11.7% for AGIs below $25k, 18.1% for AGIs $25k-50k, 25.4% for AGIs $50k-75k, 50.7% for AGIs $75k-100k, 126.6% for AGIs $100k-200k, 878.3% for AGIs over 200k)
Net capital gain/loss in AGI: +$16,261 (reported on 11.2% of returns)
Here:
+$16,261
State:
+$39,590
(% of AGI for various income ranges: 10.4% for AGIs below $25k, 23.1% for AGIs $25k-50k, 78.2% for AGIs $50k-75k, 101.8% for AGIs $75k-100k, 364.9% for AGIs $100k-200k, 10290.8% for AGIs over 200k)
Profit/loss from business: +$11,443 (reported on 18.1% of returns)
Here:
+$11,443
State:
+$10,888
(% of AGI for various income ranges: 162.7% for AGIs below $25k, 121.4% for AGIs $25k-50k, 201.0% for AGIs $50k-75k, 238.6% for AGIs $75k-100k, 466.8% for AGIs $100k-200k, 4753.3% for AGIs over 200k)
Taxable individual retirement arrangement distribution: $16,484 (reported on 6.7% of returns)
78114:
$16,484
Texas:
$24,740
(% of AGI for various income ranges: 32.6% for AGIs below $25k, 50.0% for AGIs $25k-50k, 151.2% for AGIs $50k-75k, 183.2% for AGIs $75k-100k, 459.0% for AGIs $100k-200k, 1255.0% for AGIs over 200k)
Total itemized deductions: $32,109 (reported on 5.6% of returns)
Here:
$32,109
State:
$40,428
(% of AGI for various income ranges: 24.9% for AGIs below $25k, 85.8% for AGIs $25k-50k, 242.9% for AGIs $50k-75k, 334.5% for AGIs $75k-100k, 637.7% for AGIs $100k-200k, 3370.0% for AGIs over 200k)
Charity contributions: $11,495 (reported on 4.1% of returns)
Here:
$11,495
State:
$18,201
(% of AGI for various income ranges: 17.6% for AGIs $25k-50k, 44.4% for AGIs $50k-75k, 54.2% for AGIs $75k-100k, 158.8% for AGIs $100k-200k, 1588.3% for AGIs over 200k)
Taxes paid: $6,961 (reported on 5.5% of returns)
78114:
$6,961
State:
$7,821
(% of AGI for various income ranges: 3.0% for AGIs below $25k, 17.1% for AGIs $25k-50k, 54.7% for AGIs $50k-75k, 78.4% for AGIs $75k-100k, 145.3% for AGIs $100k-200k, 630.0% for AGIs over 200k)
Earned income credit: $2,539 (reported on 17.4% of returns)
Here:
$2,539
State:
$2,584
(% of AGI for various income ranges: 112.9% for AGIs below $25k, 81.0% for AGIs $25k-50k, 1.5% for AGIs $50k-75k)
Percentage of individuals using paid preparers for their 2020 taxes: 90.9%
Here:
91%
State:
92%
(% for various income ranges: 89.5% for AGIs below $25k, 91.8% for AGIs $25k-50k, 91.3% for AGIs $50k-75k, 90.2% for AGIs $75k-100k, 92.1% for AGIs $100k-200k, 91.4% for AGIs over 200k)
Averages for the 2012 tax year for zip code 78114, filed in 2013:
Average Adjusted Gross Income (AGI) in 2012: $54,609 (Individual Income Tax Returns)
Here:
$54,609
State:
$65,384
Salary/wage: $46,214 (reported on 85.0% of returns)
Here:
$46,214
State:
$52,524
(% of AGI for various income ranges: 77.2% for AGIs below $25k, 82.1% for AGIs $25k-50k, 77.8% for AGIs $50k-75k, 80.6% for AGIs $75k-100k, 77.1% for AGIs $100k-200k, 33.3% for AGIs over 200k)
Taxable interest for individuals: $1,159 (reported on 27.4% of returns)
This zip code:
$1,159
Texas:
$2,372
(% of AGI for various income ranges: 0.8% for AGIs below $25k, 0.5% for AGIs $25k-50k, 0.5% for AGIs $50k-75k, 0.4% for AGIs $75k-100k, 0.6% for AGIs $100k-200k, 0.8% for AGIs over 200k)
Ordinary dividends: $2,568 (reported on 11.3% of returns)
Here:
$2,568
State:
$9,721
(% of AGI for various income ranges: 1.3% for AGIs below $25k, 0.3% for AGIs $25k-50k, 0.4% for AGIs $50k-75k, 0.4% for AGIs $75k-100k, 0.5% for AGIs $100k-200k, 0.8% for AGIs over 200k)
Net capital gain/loss in AGI: +$9,688 (reported on 9.4% of returns)
Here:
+$9,688
State:
+$35,319
(% of AGI for various income ranges: 0.3% for AGIs below $25k, 0.2% for AGIs $25k-50k, 0.6% for AGIs $50k-75k, 0.6% for AGIs $75k-100k, 1.2% for AGIs $100k-200k, 7.2% for AGIs over 200k)
Profit/loss from business: +$12,998 (reported on 16.9% of returns)
Here:
+$12,998
State:
+$13,732
(% of AGI for various income ranges: 9.0% for AGIs below $25k, 2.8% for AGIs $25k-50k, 2.2% for AGIs $50k-75k, 2.6% for AGIs $75k-100k, 2.7% for AGIs $100k-200k, 8.4% for AGIs over 200k)
Taxable individual retirement arrangement distribution: $13,930 (reported on 6.6% of returns)
78114:
$13,930
Texas:
$19,511
(% of AGI for various income ranges: 1.8% for AGIs below $25k, 1.1% for AGIs $25k-50k, 1.8% for AGIs $50k-75k, 1.2% for AGIs $75k-100k, 3.0% for AGIs $100k-200k)
Total itemized deductions: $20,101 (19% of AGI, reported on 22.6% of returns)
Here:
$20,101
State:
$24,724
Here:
19.5% of AGI
State:
15.9% of AGI
(% of AGI for various income ranges: 5.5% for AGIs below $25k, 7.0% for AGIs $25k-50k, 8.8% for AGIs $50k-75k, 10.1% for AGIs $75k-100k, 10.0% for AGIs $100k-200k, 5.6% for AGIs over 200k)
Charity contributions: $3,727 (reported on 16.8% of returns)
Here:
$3,727
State:
$6,808
(% of AGI for various income ranges: 0.5% for AGIs below $25k, 0.6% for AGIs $25k-50k, 0.9% for AGIs $50k-75k, 1.2% for AGIs $75k-100k, 1.4% for AGIs $100k-200k, 1.9% for AGIs over 200k)
Taxes paid: $6,083 (reported on 22.2% of returns)
78114:
$6,083
State:
$6,921
(% of AGI for various income ranges: 1.2% for AGIs below $25k, 1.8% for AGIs $25k-50k, 2.2% for AGIs $50k-75k, 2.8% for AGIs $75k-100k, 3.7% for AGIs $100k-200k, 1.6% for AGIs over 200k)
Earned income credit: $2,437 (reported on 20.5% of returns)
Here:
$2,437
State:
$2,570
(% of AGI for various income ranges: 8.1% for AGIs below $25k, 1.4% for AGIs $25k-50k)
Percentage of individuals using paid preparers for their 2012 taxes: 50.3%
Here:
50%
State:
51%
(% for various income ranges: 48.2% for AGIs below $25k, 49.3% for AGIs $25k-50k, 52.8% for AGIs $50k-75k, 50.0% for AGIs $75k-100k, 51.9% for AGIs $100k-200k, 77.8% for AGIs over 200k)
Averages for the 2004 tax year for zip code 78114, filed in 2005:
Average Adjusted Gross Income (AGI) in 2004: $38,172 (Individual Income Tax Returns)
Here:
$38,172
State:
$47,881
Salary/wage: $35,705 (reported on 86.0% of returns)
Here:
$35,705
State:
$41,947
(% of AGI for various income ranges: 201.4% for AGIs below $10k, 81.0% for AGIs $10k-25k, 85.0% for AGIs $25k-50k, 82.7% for AGIs $50k-75k, 84.0% for AGIs $75k-100k, 65.1% for AGIs over 100k)
Taxable interest for individuals: $1,376 (reported on 33.6% of returns)
This zip code:
$1,376
Texas:
$2,255
(% of AGI for various income ranges: 11.6% for AGIs below $10k, 1.5% for AGIs $10k-25k, 0.9% for AGIs $25k-50k, 1.2% for AGIs $50k-75k, 0.7% for AGIs $75k-100k, 1.3% for AGIs over 100k)
Taxable dividends: $1,406 (reported on 13.7% of returns)
Here:
$1,406
State:
$4,261
(% of AGI for various income ranges: 2.9% for AGIs below $10k, 0.4% for AGIs $10k-25k, 0.3% for AGIs $25k-50k, 0.5% for AGIs $50k-75k, 0.2% for AGIs $75k-100k, 0.9% for AGIs over 100k)
Net capital gain/loss: +$7,889 (reported on 12.8% of returns)
Here:
+$7,889
State:
+$16,110
(% of AGI for various income ranges: 9.5% for AGIs below $10k, 0.9% for AGIs $10k-25k, 0.3% for AGIs $25k-50k, 1.2% for AGIs $50k-75k, 1.0% for AGIs $75k-100k, 8.3% for AGIs over 100k)
Profit/loss from business: +$8,208 (reported on 16.5% of returns)
Here:
+$8,208
State:
+$11,013
(% of AGI for various income ranges: 6.3% for AGIs below $10k, 5.3% for AGIs $10k-25k, 2.0% for AGIs $25k-50k, 2.3% for AGIs $50k-75k, 3.1% for AGIs $75k-100k, 5.7% for AGIs over 100k)
IRA payment deduction: $3,140 (reported on 1.8% of returns)
78114:
$3,140
Texas:
$3,120
(% of AGI for various income ranges: 0.7% for AGIs below $10k, 0.1% for AGIs $10k-25k, 0.2% for AGIs $25k-50k, 0.1% for AGIs $50k-75k, 0.2% for AGIs $75k-100k, 0.1% for AGIs over 100k)
Self-employed pension: $6,154 (reported on 0.2% of returns)
Here:
$6,154
Texas:
$16,401
Total itemized deductions: $15,862 (22% of AGI, reported on 20.3% of returns)
Here:
$15,862
State:
$19,631
Here:
21.8% of AGI
State:
18.9% of AGI
(% of AGI for various income ranges: 13.5% for AGIs below $10k, 4.7% for AGIs $10k-25k, 6.7% for AGIs $25k-50k, 9.2% for AGIs $50k-75k, 11.3% for AGIs $75k-100k, 9.0% for AGIs over 100k)
Charity contributions deductions: $2,655 (3% of AGI, reported on 16.1% of returns)
Here:
$2,655
State:
$4,753
Here:
3.5% of AGI
State:
4.2% of AGI
(% of AGI for various income ranges: 0.6% for AGIs below $10k, 0.4% for AGIs $10k-25k, 0.7% for AGIs $25k-50k, 1.0% for AGIs $50k-75k, 1.5% for AGIs $75k-100k, 1.8% for AGIs over 100k)
Total tax: $5,176 (reported on 71.1% of returns)
78114:
$5,176
State:
$9,058
(% of AGI for various income ranges: 6.8% for AGIs below $10k, 3.8% for AGIs $10k-25k, 6.1% for AGIs $25k-50k, 8.4% for AGIs $50k-75k, 10.7% for AGIs $75k-100k, 16.9% for AGIs over 100k)
Earned income credit: $1,943 (reported on 22.1% of returns)
Here:
$1,943
State:
$2,024
Percentage of individuals using paid preparers for their 2004 taxes: 56.9%
Here:
57%
State:
57%
(% for various income ranges: 54.8% for AGIs below $10k, 59.6% for AGIs $10k-25k, 56.8% for AGIs $25k-50k, 54.4% for AGIs $50k-75k, 53.9% for AGIs $75k-100k, 61.1% for AGIs over 100k)
Likely homosexual households (counted as self-reported same-sex unmarried-partner households)
Lesbian couples: 0.2% of all households
Gay men: 0.2% of all households
Household received Food Stamps/SNAP in the past 12 months: 634 Household did not receive Food Stamps/SNAP in the past 12 months: 8,064
Women who had a birth in the past 12 months: 146 (108 now married, 38 unmarried) Women who did not have a birth in the past 12 months: 5,051 (2,758 now married, 2,275 unmarried)
Housing units in zip code 78114 with a mortgage: 3,979 (115 second mortgage, 95 both second mortgage and home equity loan) Houses without a mortgage: 123
Median monthly owner costs for units with a mortgage: $1,860 Median monthly owner costs for units without a mortgage: $606
Residents with income below the poverty level in 2022:
This zip code:
7.7%
Whole state:
14.0%
Residents with income below 50% of the poverty level in 2022:
This zip code:
2.3%
Whole state:
7.4%
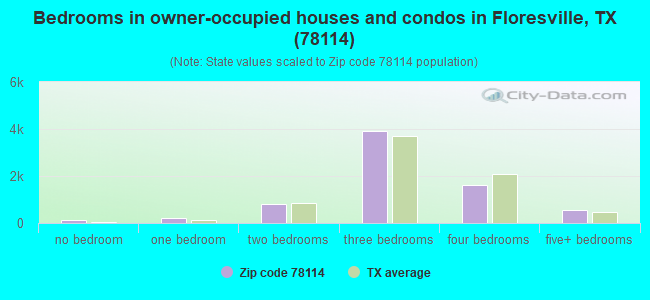
Median number of rooms in houses and condos:
Here:
6.2
State:
6.3
Median number of rooms in apartments:
Here:
4.0
State:
4.0
Notable locations in this zip code not listed on our city pages
Notable locations in zip code 78114: Connally Ranch (A), Dewees Ranch (B), Mission of Las Cabreras (C), Camp Ranch (D), Eagle Creek Volunteer Emergency Services (E), Floresville Volunteer Fire Department (F), Floresville - Canada Verde Volunteer Fire Department (G), Three Oaks Volunteer Fire Department (H), Apollo Ambulance Service (I), Wilson County Volunteer Ambulance Association (J). Display/hide their locations on the map
Churches in zip code 78114 include: Three Oaks Church (A), Guadalupe Church (B), Marcelina Church (C), First Lutheran Church (D), Sacred Heart Catholic Church (E), Iglesia BautistaelCalvario Church (F). Display/hide their locations on the map
Reservoirs and swamps: Heinen Lake (A), Kilgore Lake (B), Seale Ranch Lake (C), Connally Lake Dam 2 (D), Connally Lake (E), Grass Ponds (F). Display/hide their locations on the map
Streams, rivers, and creeks: Wallace Branch (A), Seguin Branch (B), Mariana Creek (C), Calaveras Creek (D), Sandpit Creek (E), Picosa Creek (F), Pajarito Creek (G), Lodi Branch (H), Kicaster Creek (I). Display/hide their locations on the map
In group quarters: 362 (-1 institutionalized population)
Size of family households: 2,689 2-persons, 1,621 3-persons, 1,037 4-persons, 930 5-persons, 260 6-persons, 138 7-or-more-persons
Size of nonfamily households: 1,718 1-person, 261 2-persons, 29 3-persons
3,674 married couples with children.
453 single-parent households (51 men, 402 women).
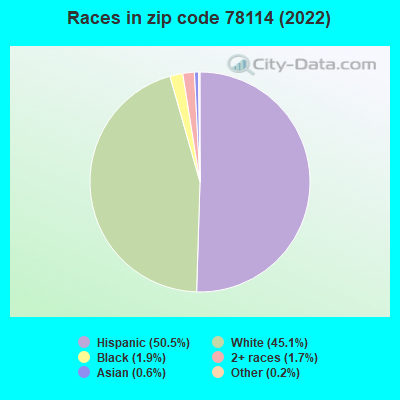
75.0% of residents of 78114 zip code speak English at home.
24.0% of residents speak Spanish at home (71% very well, 20% well, 8% not well, 1% not at all).
0.7% of residents speak other Indo-European language at home (76% very well, 15% well, 8% not well).
0.5% of residents speak Asian or Pacific Island language at home (76% very well, 24% well).
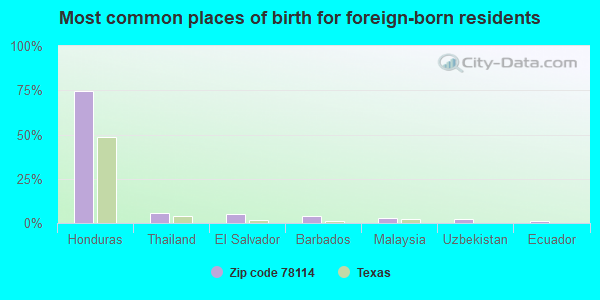
Foreign born population: 870 (3.6%) (45.0% of them are naturalized citizens)
This zip code:
3.6%
Whole state:
17.2%
75%Honduras
6%Thailand
5%El Salvador
4%Barbados
3%Malaysia
2%Uzbekistan
1%Ecuador
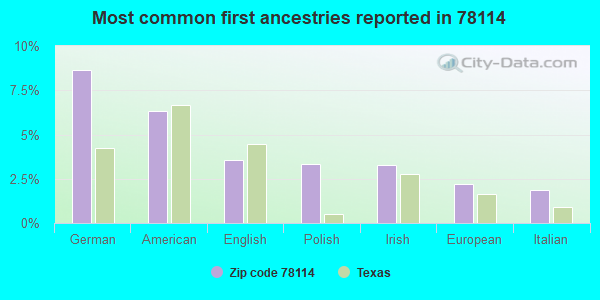
9%German
6%American
4%English
3%Polish
3%Irish
2%European
2%Italian
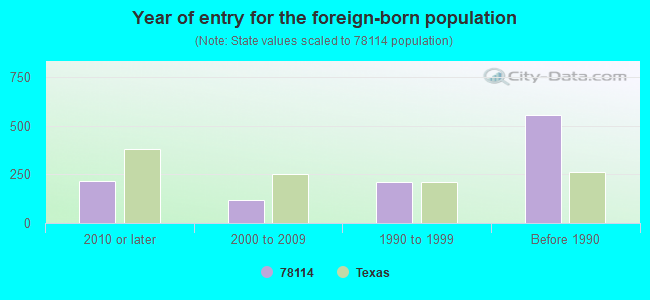
Year of entry for the foreign-born population
2142010 or later
1202000 to 2009
2131990 to 1999
556Before 1990
Facilities with environmental interests located in this zip code:
ALAMO CONCRETE PRODUCTS, LTD. (503 10TH STREET in FLORESVILLE, TX)
National Pollutant Discharge Elimination System NON-MAJOR (Tracking pollutant discharge elimination systems) - permit Business SIC classification: READY-MIXED CONCRETE
AMPAK OIL COMPANY (ST HWY 97, T MILES WEST OF FLO in FLORESVILLE, TX)
AIR MINOR (AIRS/AFS) CRITERIA AND HAZARDOUS AIR POLLUTANT INVENTORY (Inventory of air pollution sources) Business SIC classification: CRUDE PETROLEUM AND NATURAL GAS
AMERICAN TELEPHONE AND TELEGRAPH COMPANY (HWY 97, 5MI E OF in FLORESVILLE, TX)
(Resource Conservation and Recovery Act (tracking hazardous waste)) Alternative names: AMERICAN TEL & TEL CO LONG LINES
Housing units lacking complete plumbing facilities: 3.6% Housing units lacking complete kitchen facilities: 2.1%
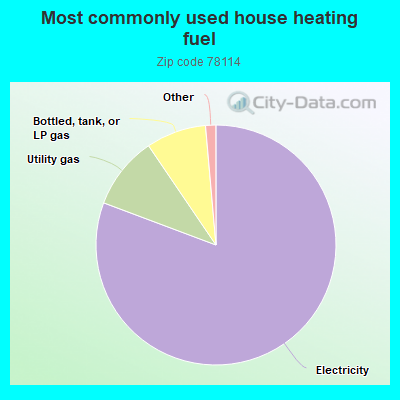
80.8%Electricity
9.8%Utility gas
8.1%Bottled, tank, or LP gas
0.7%No fuel used
0.6%Wood
Population in 1990: 11,510. Population change in the 1990s: +5,155 (+44.8%).
Place of birth for U.S.-born residents:
This state: 18,723
Northeast: 259
Midwest: 1,216
South: 1,416
West: 1,055
58% of the 78114 zip code residents lived in the same house 5 years ago. Out of people who lived in different houses, 33% lived in this county. Out of people who lived in different counties, 50% lived in Texas.
90% of the 78114 zip code residents lived in the same house 1 year ago. Out of people who lived in different houses, 27% moved from this county. Out of people who lived in different houses, 53% moved from different county within same state. Out of people who lived in different houses, 23% moved from different state. Out of people who lived in different houses, 1% moved from abroad.
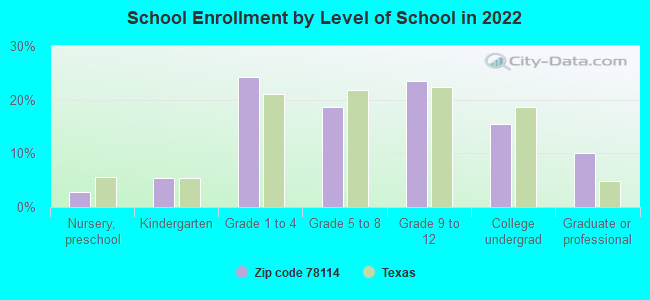
Private vs. public school enrollment:
Students in private schools in grades 1 to 8 (elementary and middle school): 331
Here:
13.8%
Texas:
8.8%
Students in private schools in grades 9 to 12 (high school): 200
Here:
15.3%
Texas:
8.0%
Students in private undergraduate colleges: 161
Here:
18.6%
Texas:
16.2%
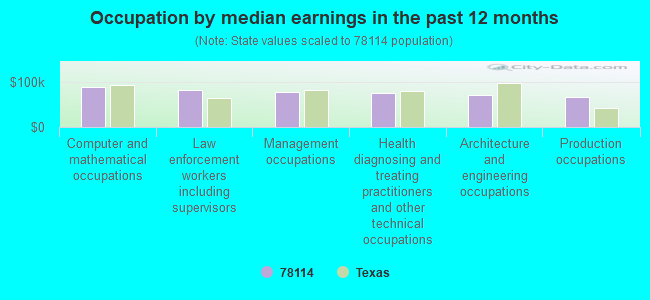
Occupation by median earnings in the past 12 months ($)
87,773Computer and mathematical occupations
82,181Law enforcement workers including supervisors
76,839Management occupations
75,883Health diagnosing and treating practitioners and other technical occupations
71,500Architecture and engineering occupations
66,808Production occupations
Companies with federal contracts located in this zip code (FLORESVILLE, TX):
F & W ELECTRICAL CONTRACTORS (6880 HWY 181 N; small business) : $573,736 in 10 contractsfrom 2000 to 2003
Contracts for Maintenance, Repair or Alteration of Real Property -- Other Non-Building Facilities, Maintenance, Repair or Alteration of Real Property -- Other Utilities, Maintenance, Repair or Alteration of Real Property -- Miscellaneous Buildings, Maintenance, Repair or Alteration of Real Property -- Radar and Navigational Facilities by Navy, Army Signed by year:2000: $337,000; 2001: $78,900; 2002: $146,761; 2003: $11,075; 2004: $0; 2005: $0; 2006: $0.
Biggest contracts:
$330,000 with Navy for Maintenance, Repair or Alteration of Real Property -- Other Non-Building Facilities. Signed on 2000-09-28. Completion date: 2001-10-08.
$267,000, same as above.Signed on 2002-03-13. Completion date: 2002-08-14.
$40,700 with Navy for Maintenance, Repair or Alteration of Real Property -- Other Utilities. Signed on 2001-06-06. Completion date: 2010-06-20.
$36,200, same as above.Signed on 2001-07-24. Completion date: 2001-06-20.
FOUR STARS QUALITY PAINTING PR (400 COUNTY ROAD 118; small business) : $317,624 in 39 contractsfrom 2001 to 2005
Contracts for Maintenance, Repair or Alteration of Real Property -- Miscellaneous Buildings, Sewage Treatment Equipment, Air Conditioning Equipment, Maintenance, Repair or Alteration of Real Property -- Restoration of real property, and moreby Army Signed by year:2000: $0; 2001: $15,975; 2002: $60,336; 2003: $127,337; 2004: $82,974; 2005: $31,002; 2006: $0.
Biggest contracts:
$75,898 with Army for Maintenance, Repair or Alteration of Real Property -- Miscellaneous Buildings. Signed on 2002-08-08. Completion date: 2002-10-04.
$24,480 with Army for Sewage Treatment Equipment. Signed on 2004-02-24. Completion date: 2004-03-01.
$22,531 with Army for Air Conditioning Equipment. Signed on 2003-09-26. Completion date: 2003-12-15.
$21,200 with Army for Maintenance, Repair or Alteration of Real Property -- Restoration of real property. Signed on 2005-02-03. Completion date: 2005-04-30.
CARAVAJAL FABRICATING CO (1315 3RD ST; small business) : $88,800 in 2 contractsfrom 2000 to 2001
$52,800 with Defense Logistics Agency for Flags and Pennants. Signed on 2000-08-11. Completion date: 2001-05-18.
$36,000, same as above.Signed on 2001-11-29. Completion date: 2002-05-20.
WOLF GROUP (8563 N HWY 181; small business) : $50,425 in 3 contractsin 2005
$43,136 with Army for Office Devices and Accessories. Taking place in GA. Signed on 2005-09-12. Completion date: 2005-11-21.
$7,289 with Army for Miscellaneous Alarm, Signal and Security Detection Systems. Signed on 2005-09-30. Completion date: 2006-09-29.
$0, same as above.Signed on 2005-10-21. Effective on 2005-10-03. Completion date: 2006-09-29.
GILBERT PERALEZ WELDING SERVIC (110 HUNTERS GLEN; small business)
$9,250 with Air Force for Recreational Services. Signed on 2003-09-30. Completion date: 2003-12-31.
RODRIGUEZ, MARCELLA (137 CHAPARRAL DR; small business)
$7,300 with Army for Food Services. Signed on 2005-01-25. Completion date: 2005-01-28.
Top industries in this zip code by the number of employees in 2005:
Health Care and Social Assistance: General Medical and Surgical Hospitals (250-499 employees: 1 establishment)
2002 - 2018 National Fire Incident Reporting System (NFIRS) incidents
Based on the data from the years 2002 - 2018 the average number of fires per year is 38. The highest number of fire incidents - 96 took place in 2004, and the least - 7 in 2012. The data has a growing trend.
When looking into fire subcategories, the most reports belonged to: Outside Fires (67.9%), and Structure Fires (20.5%).
Fire incident types reported to NFIRS in Zip Code 78114

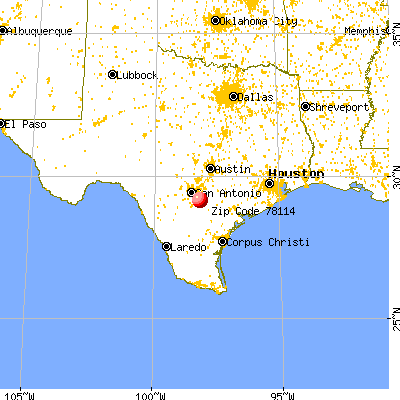


 Nearest zip codes: 78147, 78112, 78161, 78101, 78113, 78121.
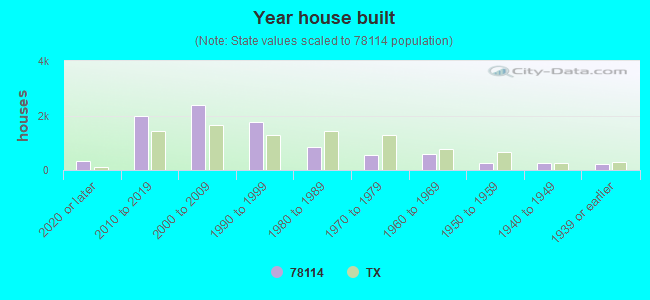


 Based on the data from the years 2002 - 2018 the average number of fires per year is 38. The highest number of fire incidents - 96 took place in 2004, and the least - 7 in 2012. The data has a growing trend.
 When looking into fire subcategories, the most reports belonged to: Outside Fires (67.9%), and Structure Fires (20.5%).