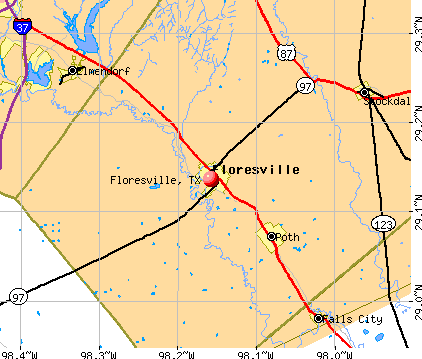
Floresville, Texas
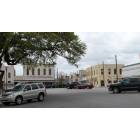
Floresville: Downtown Floresville, Texas.
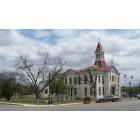
Floresville: Wilson County Courthouse in Floresville, Texas.
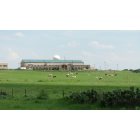
Floresville: Country Hospital
- add
your
Submit your own pictures of this city and show them to the world
- OSM Map
- General Map
- Google Map
- MSN Map
Population change since 2000: +37.2%
 |
| Males: 4,213 | |
| Females: 3,837 |
| Median resident age: | 38.5 years |
| Texas median age: | 35.6 years |
Zip codes: 78114.
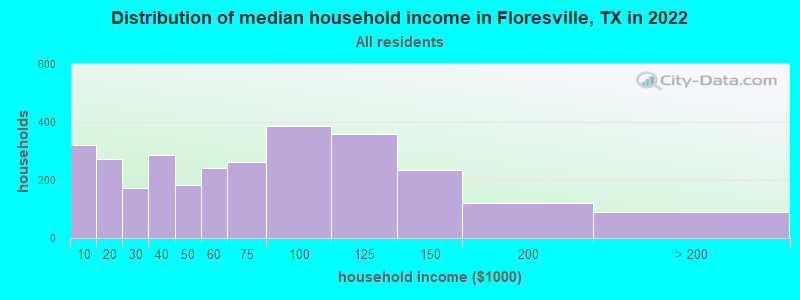
| Floresville: | $59,933 |
| TX: | $72,284 |
Estimated per capita income in 2022: $27,997 (it was $13,340 in 2000)
Floresville city income, earnings, and wages data
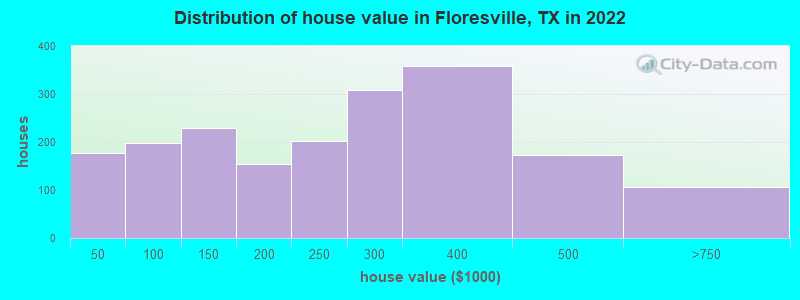
Estimated median house or condo value in 2022: $256,076 (it was $56,800 in 2000)
| Floresville: | $256,076 |
| TX: | $275,400 |
Mean prices in 2022: all housing units: $242,603; detached houses: $265,386; mobile homes: $121,248
Median gross rent in 2022: $1,063.
(10.6% for White Non-Hispanic residents, 33.8% for Black residents, 16.3% for Hispanic or Latino residents, 39.1% for other race residents, 22.0% for two or more races residents)
Detailed information about poverty and poor residents in Floresville, TX


Compare current foreclosures near Floresville, TX:
| Photo | Address | Area | Beds / Baths | Price | Details |
|---|---|---|---|---|---|

|
#1
8th St
Floresville, TX 78114
|
1,197 sq. feet
|
1 baths 3 beds |
show details | |

|
#2
Quail Ln
Floresville, TX 78114
|
- sq. feet
|
2 baths 4 beds |
show details | |

|
#3
3rd St
Floresville, TX 78114
|
- sq. feet
|
4 baths 4 beds |
show details | |

|
#4
Scenic Oak Dr
Floresville, TX 78114
|
2,056 sq. feet
|
2 baths 3 beds |
show details | |

|
#5
Fm 536
Floresville, TX 78114
|
1,676 sq. feet
|
- baths - beds |
show details | |

|
#6
County Road 144
Floresville, TX 78114
|
1,904 sq. feet
|
- baths - beds |
show details | |

|
#7
Hogans Aly
Floresville, TX 78114
|
- sq. feet
|
- baths - beds |
show details | |

|
#8
County Road 401
Floresville, TX 78114
|
- sq. feet
|
- baths - beds |
show details | |

|
#9
County Road 117 Lot C
Floresville, TX 78114
|
- sq. feet
|
- baths - beds |
show details | |

|
#10
S 2nd St
Floresville, TX 78114
|
2,628 sq. feet
|
- baths - beds |
show details |
| Photo | Address | Area | Beds / Baths | Price | Details |
|---|---|---|---|---|---|

|
#11
Goliad Rd
Floresville, TX 78114
|
- sq. feet
|
- baths - beds |
show details | |

|
#12
Willow Creek Dr
Floresville, TX 78114
|
- sq. feet
|
- baths - beds |
show details | |

|
#13
County Road 104
Floresville, TX 78114
|
924 sq. feet
|
- baths - beds |
show details | |

|
#14
Flores Oaks Dr
Floresville, TX 78114
|
1,216 sq. feet
|
- baths - beds |
show details | |

|
#15
Hidden Fern
Floresville, TX 78114
|
- sq. feet
|
- baths - beds |
show details | |

|
#16
F St
Floresville, TX 78114
|
1,040 sq. feet
|
- baths - beds |
show details | |

|
#17
Mariposa Ln
Floresville, TX 78114
|
- sq. feet
|
- baths - beds |
show details | |

|
#18
Creekbend Dr
Floresville, TX 78114
|
- sq. feet
|
- baths - beds |
show details | |

|
#19
Crosscreek Dr
Floresville, TX 78114
|
- sq. feet
|
- baths - beds |
show details | |

|
#20
Terrace Hill Ln
Floresville, TX 78114
|
- sq. feet
|
- baths - beds |
show details |
| Photo | Address | Area | Beds / Baths | Price | Details |
|---|---|---|---|---|---|

|
#21
Homecrest Dr
La Vernia, TX 78121
|
2,400 sq. feet
|
4 baths 4 beds |
show details | |

|
#22
Kimball
La Vernia, TX 78121
|
- sq. feet
|
1 baths 4 beds |
show details | |

|
#23
Palm Park Blvd
San Antonio, TX 78223
|
1,176 sq. feet
|
2 baths 3 beds |
show details | |

|
#24
Palm Park Blvd
San Antonio, TX 78223
|
1,176 sq. feet
|
2 baths 3 beds |
show details | |

|
#25
Kosub Ln
San Antonio, TX 78223
|
1,864 sq. feet
|
2 baths 4 beds |
show details | |

|
#26
Schultz Rd
Elmendorf, TX 78112
|
1,228 sq. feet
|
1 baths 2 beds |
show details | |

|
#27
S 8th St
Stockdale, TX 78160
|
1,500 sq. feet
|
2 baths 4 beds |
show details | |

|
#28
County Road 341
La Vernia, TX 78121
|
- sq. feet
|
3 baths 3 beds |
show details | |

|
#29
County Road 342
La Vernia, TX 78121
|
2,980 sq. feet
|
2 baths - beds |
show details | |

|
#30
County Road 427
Stockdale, TX 78160
|
- sq. feet
|
- baths - beds |
show details |
| Photo | Address | Area | Beds / Baths | Price | Details |
|---|---|---|---|---|---|

|
#31
Hickory Hill Dr
La Vernia, TX 78121
|
1,400 sq. feet
|
- baths - beds |
show details | |

|
#32
S. Fm 1604 East
Adkins, TX 78101
|
- sq. feet
|
- baths - beds |
show details | |

|
#33
Dragon Rock Rd
Elmendorf, TX 78112
|
- sq. feet
|
- baths - beds |
show details | |

|
#34
Kimball
La Vernia, TX 78121
|
- sq. feet
|
- baths - beds |
show details | |

|
#35
Shady Forest Dr
Elmendorf, TX 78112
|
1,216 sq. feet
|
- baths - beds |
show details | |

|
#36
Old Corpus Christi Rd Unit 6
Elmendorf, TX 78112
|
1,120 sq. feet
|
- baths - beds |
show details | |

|
#37
Polly Ln
La Vernia, TX 78121
|
1,368 sq. feet
|
- baths - beds |
show details | |

|
#38
County Road 326
Adkins, TX 78101
|
- sq. feet
|
- baths - beds |
show details | |

|
#39
Rosewood Dr
La Vernia, TX 78121
|
2,738 sq. feet
|
- baths - beds |
show details | |

|
#40
Moss Ln
Adkins, TX 78101
|
1,680 sq. feet
|
- baths - beds |
show details |
| Photo | Address | Area | Beds / Baths | Price | Details |
|---|---|---|---|---|---|

|
#41
Westfield Lndg
La Vernia, TX 78121
|
- sq. feet
|
- baths - beds |
show details | |

|
#42
County Road 204
Falls City, TX 78113
|
2,128 sq. feet
|
- baths - beds |
show details | |

|
#43
Ranchview Estates Dr
Elmendorf, TX 78112
|
1,344 sq. feet
|
- baths - beds |
show details | |

|
#44
Cr 433
Stockdale, TX 78160
|
- sq. feet
|
- baths - beds |
show details | |

|
#45
Roddy Rd Lot 5
San Antonio, TX 78263
|
- sq. feet
|
- baths - beds |
show details | |

|
#46
Grand Spg
Elmendorf, TX 78112
|
- sq. feet
|
- baths - beds |
show details | |

|
#47
Opportunity Dr
Elmendorf, TX 78112
|
- sq. feet
|
- baths - beds |
show details | |

|
#48
Liedecke Rd Apt 6205
San Antonio, TX 78264
|
- sq. feet
|
- baths - beds |
show details | |

|
#49
Hickory Shadow
Elmendorf, TX 78112
|
- sq. feet
|
- baths - beds |
show details | |

|
Check over 1 million property listings on Foreclosure.com!
|
browse all offers | |||


- 4,73662.0%Hispanic
- 2,57033.6%White alone
- 1201.6%Two or more races
- 971.3%Black alone
- 991.3%Asian alone
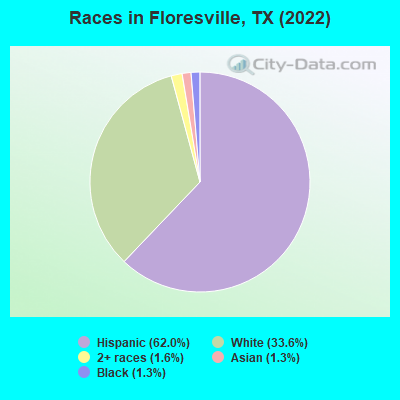
Races in Floresville detailed stats: ancestries, foreign born residents, place of birth
According to our research of Texas and other state lists, there were 67 registered sex offenders living in Floresville, Texas as of April 28, 2024.
The ratio of all residents to sex offenders in Floresville is 110 to 1.
Type |
2009 |
2010 |
2011 |
2012 |
2013 |
2014 |
2015 |
2016 |
2017 |
2018 |
2019 |
2020 |
2021 |
2022 |
|---|---|---|---|---|---|---|---|---|---|---|---|---|---|---|
| Murders (per 100,000) | 0 (0.0) | 0 (0.0) | 0 (0.0) | 0 (0.0) | 0 (0.0) | 0 (0.0) | 0 (0.0) | 0 (0.0) | 0 (0.0) | 0 (0.0) | 0 (0.0) | 0 (0.0) | 0 (0.0) | 0 (0.0) |
| Rapes (per 100,000) | 0 (0.0) | 3 (46.5) | 0 (0.0) | 2 (30.0) | 0 (0.0) | 0 (0.0) | 1 (13.7) | 4 (53.3) | 1 (13.0) | 0 (0.0) | 0 (0.0) | 6 (72.8) | 4 (48.0) | 3 (37.6) |
| Robberies (per 100,000) | 1 (12.7) | 1 (15.5) | 0 (0.0) | 2 (30.0) | 0 (0.0) | 2 (27.9) | 1 (13.7) | 3 (40.0) | 1 (13.0) | 4 (51.6) | 1 (12.5) | 0 (0.0) | 3 (36.0) | 1 (12.5) |
| Assaults (per 100,000) | 7 (89.1) | 10 (155.1) | 1 (15.2) | 5 (74.9) | 13 (188.9) | 22 (307.3) | 17 (232.1) | 18 (240.0) | 14 (182.4) | 10 (129.0) | 18 (225.8) | 17 (206.1) | 20 (239.8) | 12 (150.5) |
| Burglaries (per 100,000) | 55 (699.8) | 49 (759.9) | 40 (607.5) | 30 (449.6) | 38 (552.2) | 37 (516.8) | 37 (505.2) | 19 (253.4) | 31 (403.8) | 24 (309.7) | 49 (614.8) | 33 (400.1) | 33 (395.7) | 38 (476.7) |
| Thefts (per 100,000) | 154 (1,960) | 194 (3,009) | 175 (2,658) | 202 (3,028) | 221 (3,211) | 239 (3,338) | 237 (3,236) | 210 (2,800) | 117 (1,524) | 26 (335.5) | 93 (1,167) | 55 (666.9) | 60 (719.5) | 73 (915.8) |
| Auto thefts (per 100,000) | 5 (63.6) | 3 (46.5) | 3 (45.6) | 8 (119.9) | 14 (203.4) | 20 (279.3) | 12 (163.8) | 20 (266.7) | 12 (156.3) | 6 (77.4) | 11 (138.0) | 12 (145.5) | 11 (131.9) | 23 (288.5) |
| Arson (per 100,000) | 0 (0.0) | 0 (0.0) | 1 (15.2) | 0 (0.0) | 0 (0.0) | 0 (0.0) | 1 (13.7) | 0 (0.0) | 0 (0.0) | 1 (12.9) | 2 (25.1) | 0 (0.0) | 1 (12.0) | 1 (12.5) |
| City-Data.com crime index | 154.1 | 250.2 | 155.5 | 210.1 | 221.2 | 261.9 | 239.4 | 253.8 | 152.5 | 82.6 | 149.7 | 165.8 | 164.2 | 157.1 |
The City-Data.com crime index weighs serious crimes and violent crimes more heavily. Higher means more crime, U.S. average is 246.1. It adjusts for the number of visitors and daily workers commuting into cities.
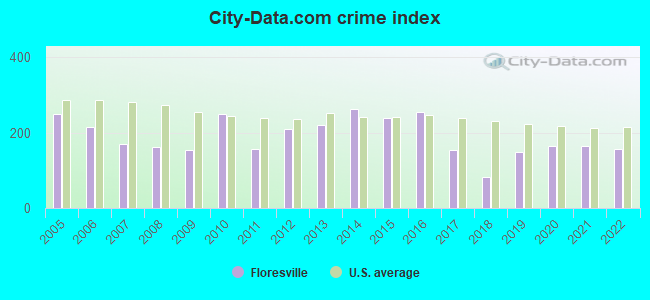
Crime rate in Floresville detailed stats: murders, rapes, robberies, assaults, burglaries, thefts, arson
Full-time law enforcement employees in 2021, including police officers: 19 (18 officers - 17 male; 1 female).
| Officers per 1,000 residents here: | 2.16 |
| Texas average: | 2.07 |
 Recent articles from our blog. Our writers, many of them Ph.D. graduates or candidates, create easy-to-read articles on a wide variety of topics.

 | What about south of SA (e.g. Floresville)?? (10 replies) |
| Floresville (8 replies) |
| Uvalde vs Castroville vs Hondo (32 replies) |
| Living in Floresville (1 reply) |
| whats going on in converse? (11 replies) |
| Pros and Cons for Floresville (8 replies) |
Latest news from Floresville, TX collected exclusively by city-data.com from local newspapers, TV, and radio stations
Ancestries: European (7.5%), German (5.6%), American (3.9%), Polish (2.9%), English (2.8%), Italian (2.1%).
Current Local Time: CST time zone
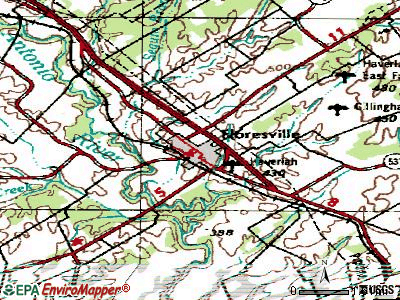
Land area: 4.75 square miles.
Population density: 1,694 people per square mile (low).
172 residents are foreign born (1.2% Latin America, 1.0% Asia).
| This city: | 2.3% |
| Texas: | 17.1% |
Median real estate property taxes paid for housing units with mortgages in 2022: $4,245 (1.4%)
Median real estate property taxes paid for housing units with no mortgage in 2022: $1,747 (1.3%)
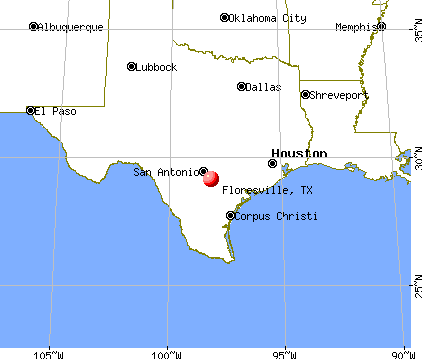
Nearest city with pop. 50,000+: San Antonio, TX  (30.6 miles , pop. 1,144,646).
Nearest cities:
), ), ), )Latitude: 29.14 N, Longitude: 98.16 W
Daytime population change due to commuting: +1,084 (+14.2%)
Workers who live and work in this city: 1,304 (40.6%)
Area code: 830
Floresville, Texas accommodation & food services, waste management - Economy and Business Data
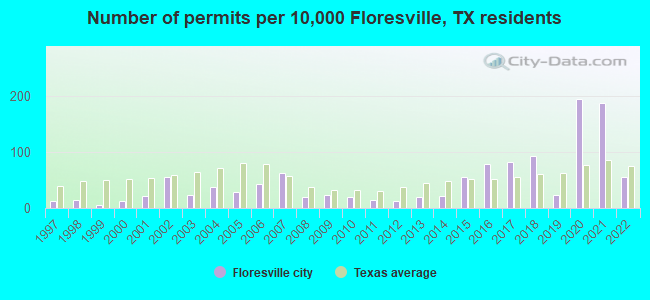
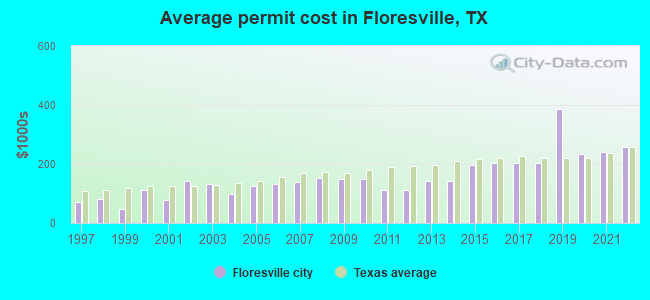
Single-family new house construction building permits:
- 2022: 32 buildings, average cost: $255,700
- 2021: 110 buildings, average cost: $239,200
- 2020: 113 buildings, average cost: $233,100
- 2019: 14 buildings, average cost: $385,700
- 2018: 54 buildings, average cost: $202,900
- 2017: 48 buildings, average cost: $202,500
- 2016: 46 buildings, average cost: $204,200
- 2015: 33 buildings, average cost: $195,200
- 2014: 13 buildings, average cost: $143,700
- 2013: 12 buildings, average cost: $143,700
- 2012: 7 buildings, average cost: $112,200
- 2011: 8 buildings, average cost: $112,200
- 2010: 11 buildings, average cost: $149,200
- 2009: 14 buildings, average cost: $148,800
- 2008: 12 buildings, average cost: $150,900
- 2007: 37 buildings, average cost: $138,400
- 2006: 25 buildings, average cost: $131,300
- 2005: 17 buildings, average cost: $124,400
- 2004: 22 buildings, average cost: $98,300
- 2003: 14 buildings, average cost: $132,300
- 2002: 32 buildings, average cost: $143,200
- 2001: 13 buildings, average cost: $78,800
- 2000: 7 buildings, average cost: $110,700
- 1999: 3 buildings, average cost: $48,700
- 1998: 8 buildings, average cost: $81,900
- 1997: 7 buildings, average cost: $70,700
| Here: | 2.6% |
| Texas: | 3.5% |
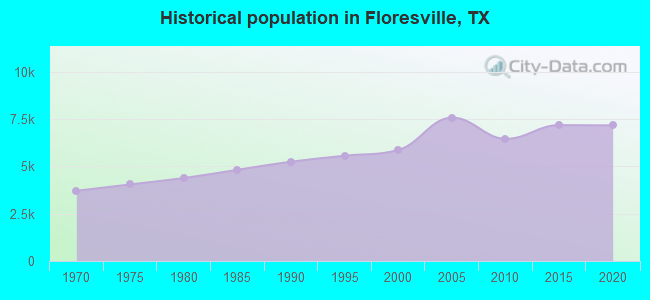
Population change in the 1990s: +544 (+10.2%).
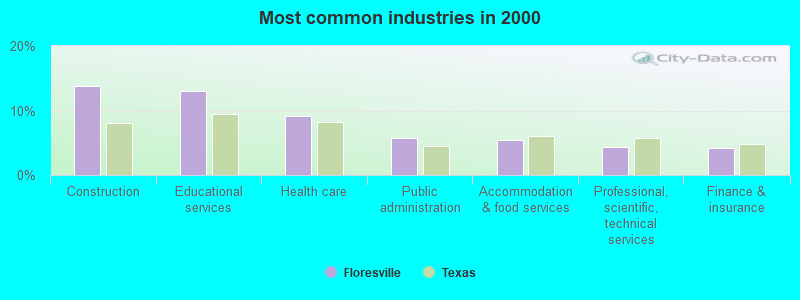
- Construction (13.8%)
- Educational services (13.1%)
- Health care (9.1%)
- Public administration (5.7%)
- Accommodation & food services (5.5%)
- Professional, scientific, technical services (4.3%)
- Finance & insurance (4.2%)
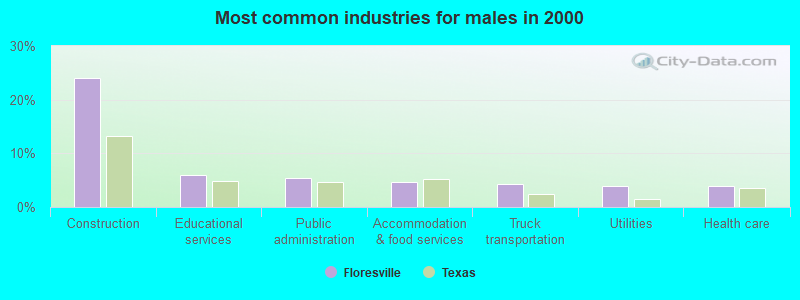
- Construction (24.1%)
- Educational services (5.9%)
- Public administration (5.4%)
- Accommodation & food services (4.6%)
- Truck transportation (4.3%)
- Utilities (4.0%)
- Health care (4.0%)
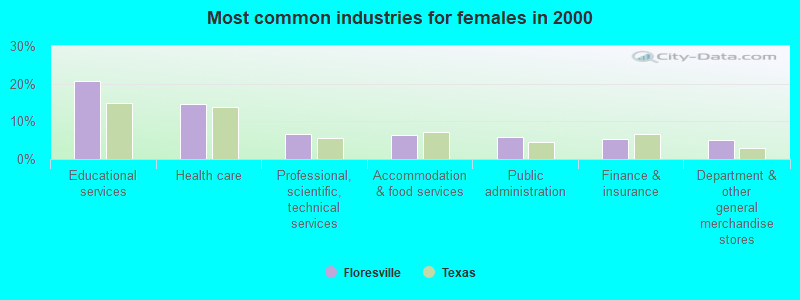
- Educational services (20.6%)
- Health care (14.6%)
- Professional, scientific, technical services (6.7%)
- Accommodation & food services (6.3%)
- Public administration (6.0%)
- Finance & insurance (5.4%)
- Department & other general merchandise stores (5.0%)

- Driver/sales workers and truck drivers (4.9%)
- Secretaries and administrative assistants (4.4%)
- Building and grounds cleaning and maintenance occupations (4.3%)
- Preschool, kindergarten, elementary, and middle school teachers (4.2%)
- Other management occupations, except farmers and farm managers (4.2%)
- Cashiers (3.7%)
- Nursing, psychiatric, and home health aides (3.4%)
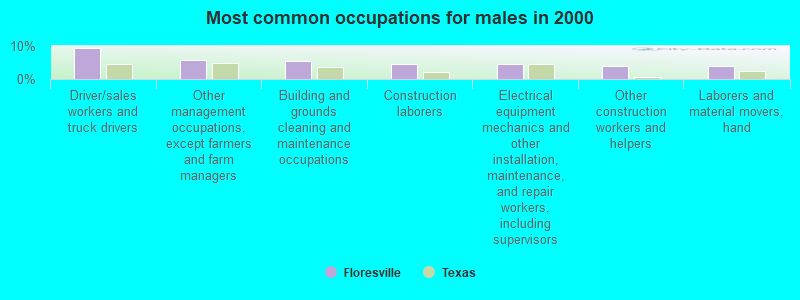
- Driver/sales workers and truck drivers (9.5%)
- Other management occupations, except farmers and farm managers (5.9%)
- Building and grounds cleaning and maintenance occupations (5.4%)
- Construction laborers (4.6%)
- Electrical equipment mechanics and other installation, maintenance, and repair workers, including supervisors (4.4%)
- Other construction workers and helpers (4.0%)
- Laborers and material movers, hand (3.9%)
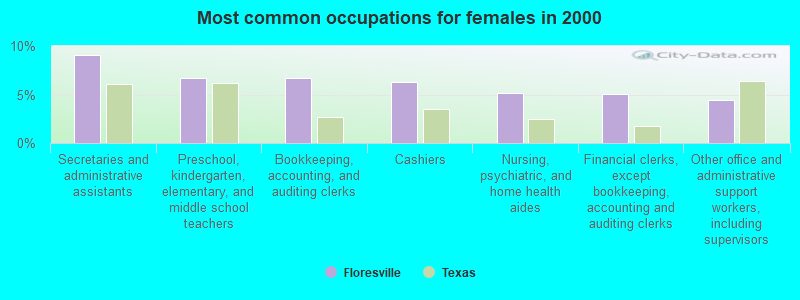
- Secretaries and administrative assistants (9.1%)
- Preschool, kindergarten, elementary, and middle school teachers (6.7%)
- Bookkeeping, accounting, and auditing clerks (6.7%)
- Cashiers (6.2%)
- Nursing, psychiatric, and home health aides (5.2%)
- Financial clerks, except bookkeeping, accounting and auditing clerks (5.0%)
- Other office and administrative support workers, including supervisors (4.4%)
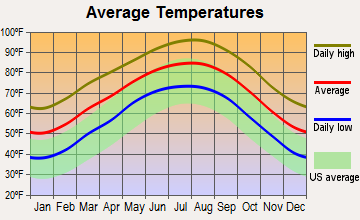
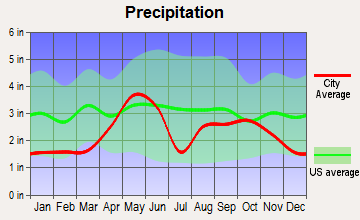
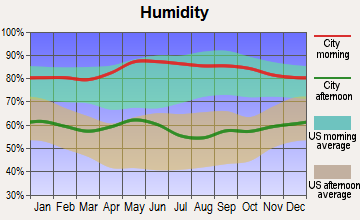
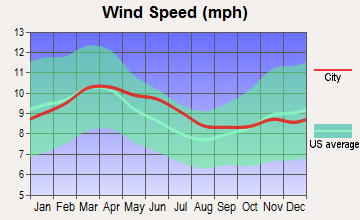
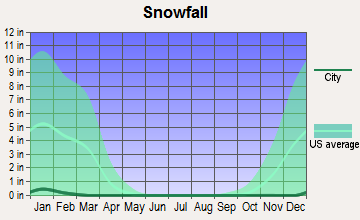
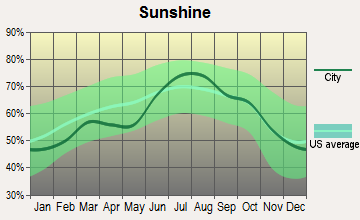
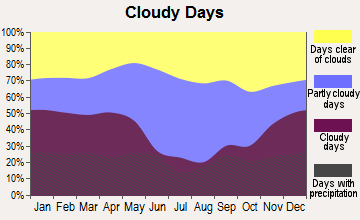
Average climate in Floresville, Texas
Based on data reported by over 4,000 weather stations
|
|

(lower is better)
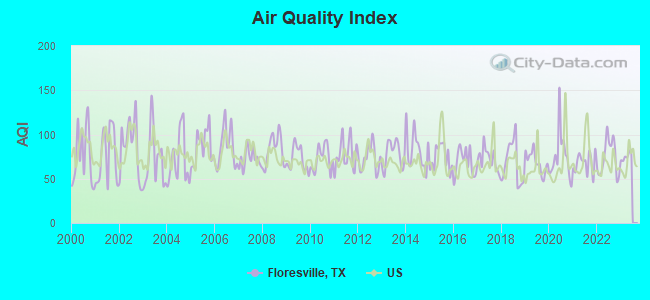
Air Quality Index (AQI) level in 2022 was 73.9. This is about average.
| City: | 73.9 |
| U.S.: | 72.6 |
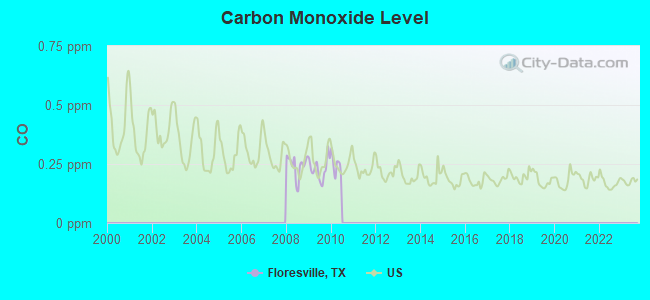
Carbon Monoxide (CO) [ppm] level in 2009 was 0.231. This is about average. Closest monitor was 18.3 miles away from the city center.
| City: | 0.231 |
| U.S.: | 0.251 |
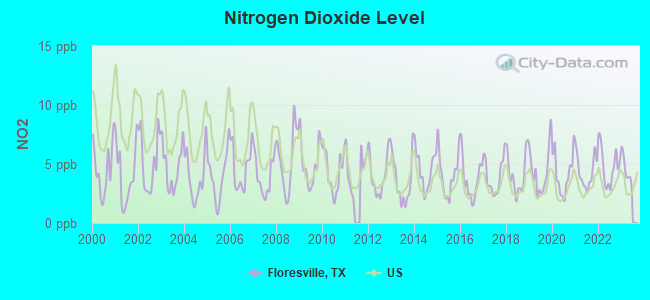
Nitrogen Dioxide (NO2) [ppb] level in 2022 was 4.83. This is about average. Closest monitor was 13.4 miles away from the city center.
| City: | 4.83 |
| U.S.: | 5.11 |
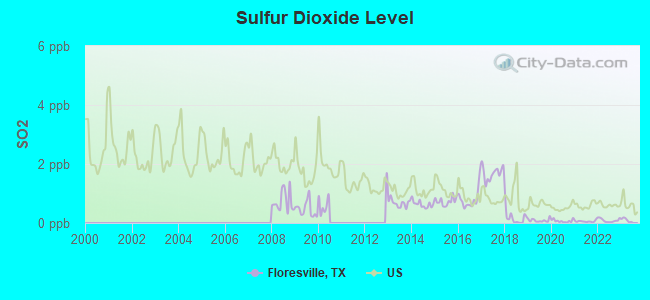
Sulfur Dioxide (SO2) [ppb] level in 2022 was 0.0888. This is significantly better than average. Closest monitor was 13.4 miles away from the city center.
| City: | 0.0888 |
| U.S.: | 1.5147 |
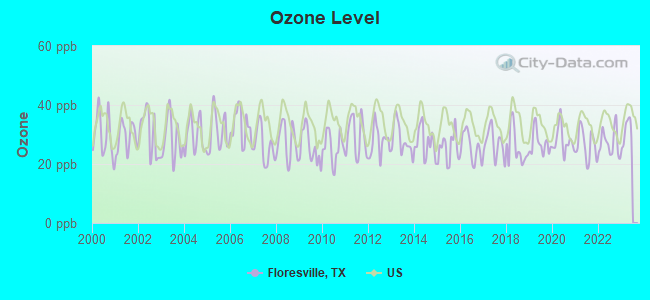
Ozone [ppb] level in 2022 was 27.2. This is better than average. Closest monitor was 13.1 miles away from the city center.
| City: | 27.2 |
| U.S.: | 33.3 |
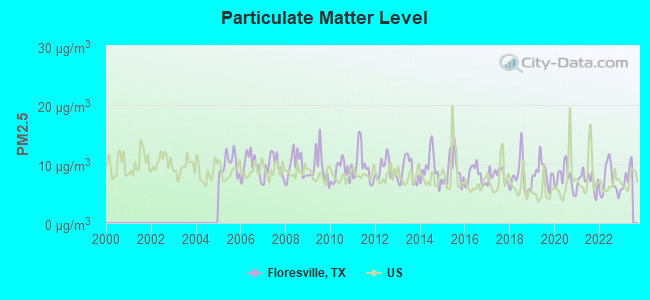
Particulate Matter (PM2.5) [µg/m3] level in 2022 was 7.03. This is about average. Closest monitor was 13.4 miles away from the city center.
| City: | 7.03 |
| U.S.: | 8.11 |
Tornado activity:
Floresville-area historical tornado activity is below Texas state average. It is 10% smaller than the overall U.S. average.
On 4/28/1953, a category F4 (max. wind speeds 207-260 mph) tornado 44.4 miles away from the Floresville city center killed 2 people and injured 15 people.
On 4/15/1973, a category F4 tornado 46.2 miles away from the city center killed 5 people and injured 12 people.
Earthquake activity:
Floresville-area historical earthquake activity is significantly above Texas state average. It is 31% smaller than the overall U.S. average.On 10/20/2011 at 12:24:41, a magnitude 4.8 (4.8 MW, Depth: 3.1 mi, Class: Light, Intensity: IV - V) earthquake occurred 19.4 miles away from the city center
On 4/9/1993 at 12:29:19, a magnitude 4.3 (4.1 MB, 4.3 LG, Depth: 3.1 mi) earthquake occurred 22.6 miles away from the city center
On 4/14/1995 at 00:32:56, a magnitude 5.7 (5.6 MB, 5.7 MS, 5.7 MW, Depth: 11.1 mi, Class: Moderate, Intensity: VI - VII) earthquake occurred 322.7 miles away from the city center
On 5/1/2018 at 16:28:56, a magnitude 4.0 (4.0 MW, Depth: 3.1 mi) earthquake occurred 16.1 miles away from Floresville center
On 4/7/2008 at 09:51:12, a magnitude 3.9 (3.9 MW, Depth: 3.1 mi, Class: Light, Intensity: II - III) earthquake occurred 16.8 miles away from Floresville center
On 6/16/1978 at 11:46:54, a magnitude 5.3 (4.4 MB, 4.6 UK, 5.3 ML) earthquake occurred 310.5 miles away from Floresville center
Magnitude types: regional Lg-wave magnitude (LG), body-wave magnitude (MB), local magnitude (ML), surface-wave magnitude (MS), moment magnitude (MW)
Natural disasters:
The number of natural disasters in Wilson County (12) is smaller than the US average (15).Major Disasters (Presidential) Declared: 5
Emergencies Declared: 6
Causes of natural disasters: Floods: 4, Storms: 4, Fires: 3, Hurricanes: 3, Tornadoes: 3, Winds: 2, Tropical Storm: 1, Other: 1 (Note: some incidents may be assigned to more than one category).
Hospitals and medical centers in Floresville:
- CONNALLY MEMORIAL MEDICAL CENTER (Government - Hospital District or Authority, 499 10TH STREET)
- FLORESVILLE NURSING AND REHABILITATION CENTER (1811 SIXTH ST)
- FLORESVILLE NURSING CENTER (1811 6TH STREET)
- FRANK M TEJEDA TEXAS STATE VETERANS HOME (200 VETERANS DR)
- REGENCY MANOR NURSING AND REHABILITATION LP (1615 ELEVENTH ST)
- FLORESVILLE DIALYSIS (543 10TH STREET)
- CONNALLY MEMORIAL HOME HEALTH (497 10TH STREET SUITE #202)
- NURSES IN TOUCH HOME HEALTH (1815 TENTH STREET)
Airports located in Floresville:
- Boening Brothers Airport (7TE9) (Runways: 1)
- Circle P Ranch Airport (82XS) (Runways: 1)
- John B Connally Ranch Airport (8TA0) (Runways: 1)
- Ray Farm Airport (1TE7) (Runways: 1)
Colleges/universities with over 2000 students nearest to Floresville:
- St Philip's College (about 27 miles; San Antonio, TX; Full-time enrollment: 5,970)
- Palo Alto College (about 27 miles; San Antonio, TX; FT enrollment: 5,055)
- San Antonio College (about 30 miles; San Antonio, TX; FT enrollment: 15,182)
- University of the Incarnate Word (about 30 miles; San Antonio, TX; FT enrollment: 6,875)
- Trinity University (about 30 miles; San Antonio, TX; FT enrollment: 2,467)
- Our Lady of the Lake University (about 31 miles; San Antonio, TX; FT enrollment: 2,133)
- Northwest Vista College (about 41 miles; San Antonio, TX; FT enrollment: 9,683)
Biggest public high schools in Floresville:
- FLORESVILLE H S (Students: 1,135, Location: 1813 TIGER LN, Grades: 9-12)
- EAST CENTRAL CHOICE PROGAM (Location: 501 10TH ST, Grades: 4-12)
- FLORESVILLE ALTER CTR (Location: 335 ALTERNATIVE LANE, Grades: 11)
- FLORESVILLE ALTER CTR (Location: 1813 TIGER LN, Grades: 5-12)
- WILSON CO J J A E P (Location: 335 ALTERNATIVE LN, Grades: 7-12)
- FLORESVILLE ALTERNATIVE (Location: 335 ALTERNATIVE LANE, Grades: 7-12)
- FLORESVILLE CHOICE PROGRAM (Location: 501 10TH ST, Grades: 12)
- FLORESVILLE ALTER ED CTR (Location: 335 ALTERNATIVE LN, Grades: 8-11)
- WILSON CO J J A E P (Location: 335 ALTERNATIVE LN, Grades: 8-12)
- FLORESVILLE ED ALTER CTR (Location: 335 ALTERNATIVE LN, Grades: KG-12)
Public elementary/middle schools in Floresville:
- FLORESVILLE MIDDLE (Students: 838, Location: 2601 B ST, Grades: 6-8)
- WILSON COUNTY BOOT CAMP (Location: 335 ALTERNATIVE LN, Grades: 7-8)
- NORTH EL (Location: 14905 FM 775, Grades: PK-5)
- SOUTH EL (Location: 2000 TIGER LN, Grades: PK-5)
- WILSON CO JJAEP (Location: 335 ALTERNATIVE LN, Grades: 6)
Private elementary/middle school in Floresville:
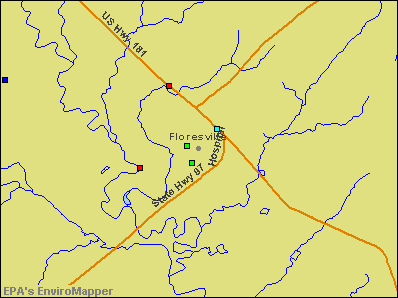
Points of interest:
Notable locations in Floresville: Floresville Volunteer Fire Department (A), Wilson County Volunteer Ambulance Association (B). Display/hide their locations on the map
Churches in Floresville include: First Lutheran Church (A), Sacred Heart Catholic Church (B), Iglesia BautistaelCalvario Church (C). Display/hide their locations on the map
Cemeteries: Sacred Heart Cemetery (1), Lodi Cemetery (2). Display/hide their locations on the map
Streams, rivers, and creeks: Seguin Branch (A). Display/hide its location on the map
Park in Floresville: Eschenburg Field (1). Display/hide its location on the map
Hotel: Best Western Floresville Inn (1720 10th Street).
Court: Floresville City - Municipal Court Judge (1120 D Street).
Birthplace of: John Connally - (1963-1969), governor of Texas, Shelley Sekula-Gibbs - Politician, Jermane Mayberry - 2005 NFL player (New Orleans Saints, born: Aug 29, 1973), John Teltschik - Football player.
Drinking water stations with addresses in Floresville and their reported violations in the past:
ARROWHEAD WATER SYSTEM (Population served: 96, Groundwater):Past monitoring violations:
- Monitoring and Reporting (DBP) - Between APR-2013 and JUN-2013, Contaminant: Chlorine. Follow-up actions: St Violation/Reminder Notice (NOV-13-2013), St Public Notif requested (NOV-13-2013), St Public Notif received (DEC-12-2013), St Compliance achieved (JUL-17-2014)
- One routine major monitoring violation
- One minor monitoring violation
| This city: | 2.9 people |
| Texas: | 2.8 people |
| This city: | 74.7% |
| Whole state: | 69.9% |
| This city: | 7.2% |
| Whole state: | 6.0% |
Likely homosexual households (counted as self-reported same-sex unmarried-partner households)
- Lesbian couples: 0.2% of all households
- Gay men: 0.1% of all households
59 people in federal prisons in 2010
People in group quarters in Floresville in 2000:
- 183 people in nursing homes
- 158 people in local jails and other confinement facilities (including police lockups)
- 9 people in homes for the mentally retarded
Banks with branches in Floresville (2011 data):
- Wells Fargo Bank, National Association: Floresville Main Branch at 1112 B Street, branch established on 1902/07/19; Floresville Plaza Branch at 538 10th St, branch established on 1921/01/01. Info updated 2011/04/05: Bank assets: $1,161,490.0 mil, Deposits: $905,653.0 mil, headquarters in Sioux Falls, SD, positive income, 6395 total offices, Holding Company: Wells Fargo & Company
- First National Bank Texas: Floresville Banking Center - Rc 448 at 925 10th Street, branch established on 2010/08/01. Info updated 2006/11/03: Bank assets: $944.3 mil, Deposits: $815.9 mil, headquarters in Killeen, TX, positive income, Mortgage Lending Specialization, 250 total offices, Holding Company: First Community Bancshares, Inc.
- The Falls City National Bank: Eagle Creek Branch at 14565 Fm 775, branch established on 2000/08/18. Info updated 2006/11/03: Bank assets: $199.2 mil, Deposits: $180.9 mil, headquarters in Falls City, TX, positive income, 3 total offices
- First National Bank: Floresville Branch at 545 Tenth Street, branch established on 1997/08/11. Info updated 2006/11/03: Bank assets: $230.2 mil, Deposits: $204.7 mil, headquarters in George West, TX, positive income, Commercial Lending Specialization, 4 total offices, Holding Company: Live Oak Bancshares Corporation
For population 15 years and over in Floresville:
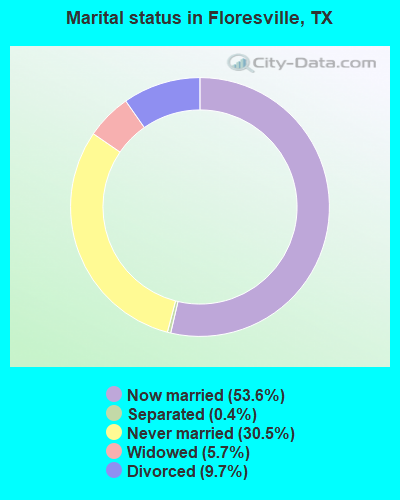
- Never married: 30.5%
- Now married: 53.6%
- Separated: 0.4%
- Widowed: 5.7%
- Divorced: 9.7%
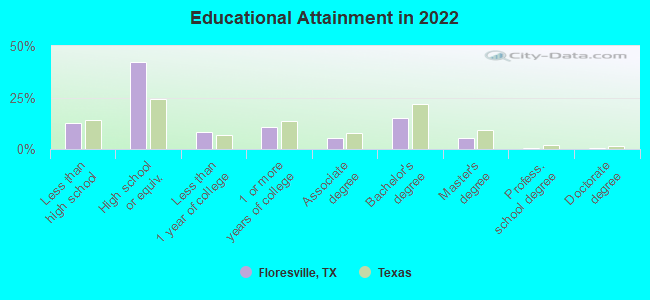
For population 25 years and over in Floresville:
- High school or higher: 86.9%
- Bachelor's degree or higher: 20.2%
- Graduate or professional degree: 5.8%
- Unemployed: 8.0%
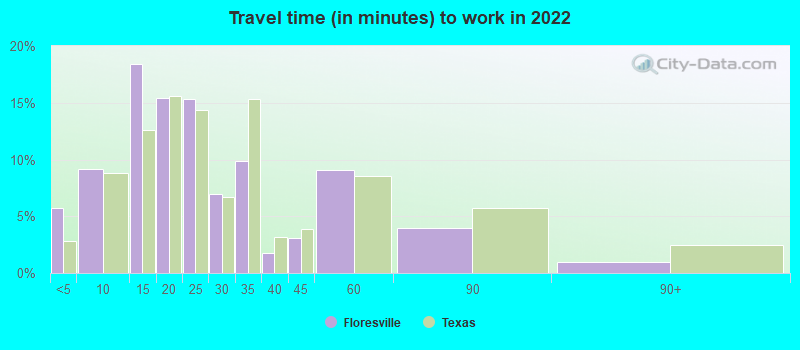
- Mean travel time to work (commute): 28.0 minutes
| Here: | 10.7 |
| Texas average: | 14.0 |
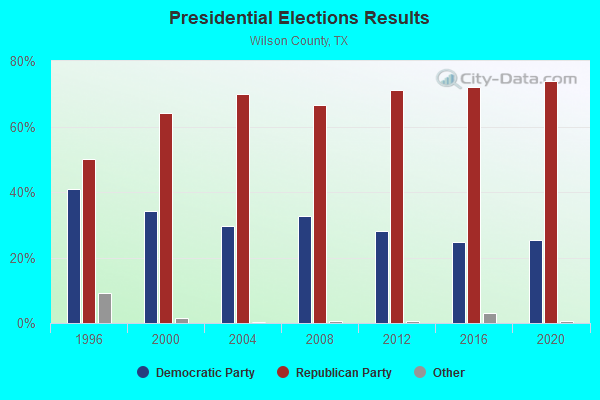
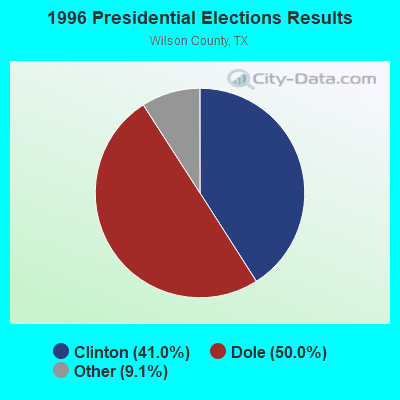
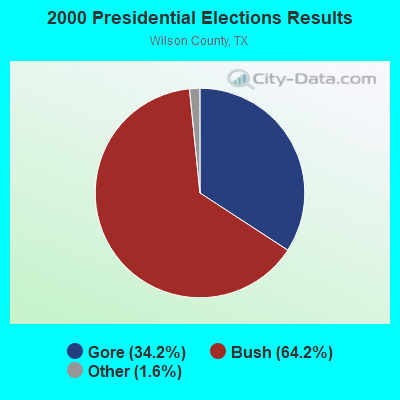
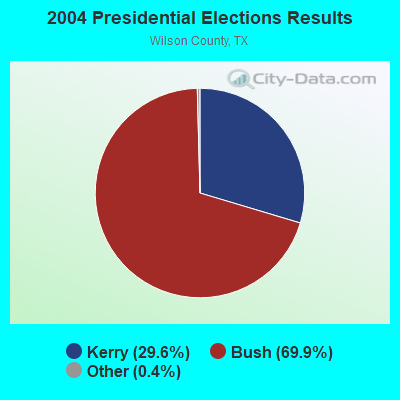
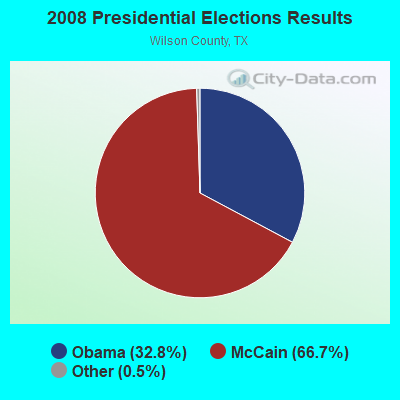

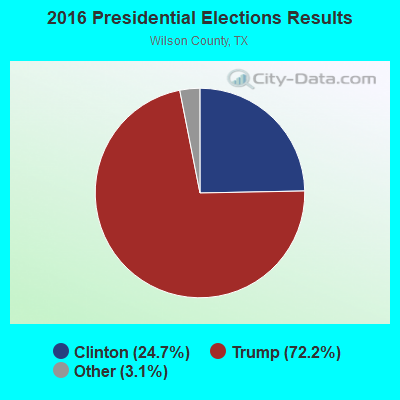
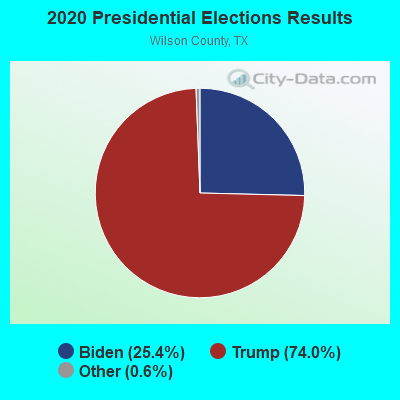
Graphs represent county-level data. Detailed 2008 Election Results
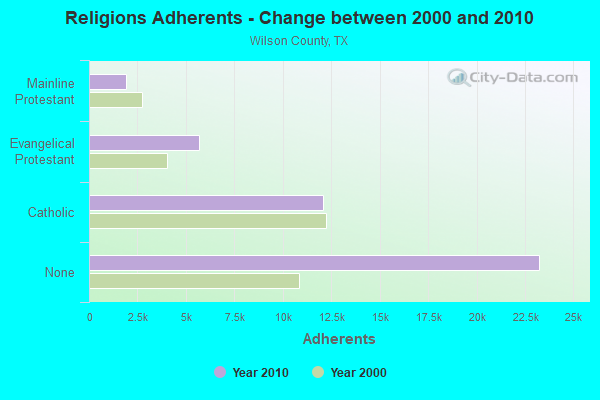
Religion statistics for Floresville, TX (based on Wilson County data)
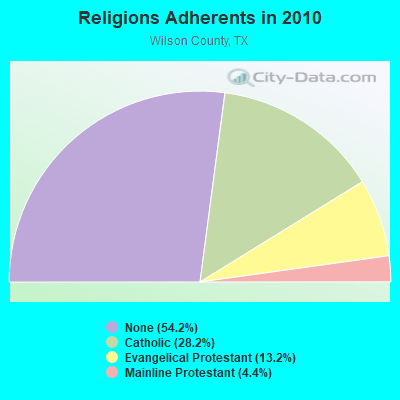
| Religion | Adherents | Congregations |
|---|---|---|
| Catholic | 12,088 | 5 |
| Evangelical Protestant | 5,681 | 31 |
| Mainline Protestant | 1,904 | 6 |
| Other | - | 2 |
| None | 23,245 | - |
Food Environment Statistics:
| This county: | 1.53 / 10,000 pop. |
| Texas: | 1.47 / 10,000 pop. |
| Here: | 1.28 / 10,000 pop. |
| Texas: | 1.11 / 10,000 pop. |
| Wilson County: | 2.55 / 10,000 pop. |
| Texas: | 3.95 / 10,000 pop. |
| Wilson County: | 6.13 / 10,000 pop. |
| State: | 6.13 / 10,000 pop. |
| Here: | 9.5% |
| Texas: | 8.9% |
| Wilson County: | 27.3% |
| State: | 26.6% |
| Wilson County: | 18.1% |
| Texas: | 15.7% |
Health and Nutrition:
| Floresville: | 47.8% |
| Texas: | 48.6% |
| Floresville: | 46.2% |
| State: | 47.4% |
| This city: | 28.7 |
| Texas: | 28.5 |
| This city: | 23.1% |
| State: | 20.6% |
| Here: | 11.7% |
| Texas: | 10.3% |
| Floresville: | 6.8 |
| Texas: | 6.8 |
| Floresville: | 35.0% |
| State: | 33.1% |
| Here: | 53.2% |
| State: | 56.2% |
| Floresville: | 79.7% |
| Texas: | 80.7% |
More about Health and Nutrition of Floresville, TX Residents
| Local government employment and payroll (March 2022) | |||||
| Function | Full-time employees | Monthly full-time payroll | Average yearly full-time wage | Part-time employees | Monthly part-time payroll |
|---|---|---|---|---|---|
| Electric Power | 57 | $295,768 | $62,267 | 9 | $5,616 |
| Police Protection - Officers | 19 | $111,588 | $70,477 | 0 | $0 |
| Water Supply | 10 | $38,744 | $46,493 | 0 | $0 |
| Parks and Recreation | 8 | $28,569 | $42,854 | 0 | $0 |
| Other Government Administration | 6 | $32,952 | $65,904 | 6 | $475 |
| Other and Unallocable | 5 | $21,352 | $51,245 | 0 | $0 |
| Streets and Highways | 4 | $14,519 | $43,557 | 0 | $0 |
| Sewerage | 3 | $14,918 | $59,672 | 0 | $0 |
| Financial Administration | 3 | $14,771 | $59,084 | 0 | $0 |
| Police - Other | 2 | $6,092 | $36,552 | 0 | $0 |
| Judicial and Legal | 1 | $4,250 | $51,000 | 0 | $0 |
| Totals for Government | 118 | $583,523 | $59,341 | 15 | $6,091 |
Floresville government finances - Expenditure in 2021 (per resident):
- Current Operations - Police Protection: $2,092,000 ($259.88)
Solid Waste Management: $1,791,000 ($222.48)
Parks and Recreation: $1,395,000 ($173.29)
Central Staff Services: $1,166,000 ($144.84)
Financial Administration: $1,166,000 ($144.84)
Water Utilities: $973,000 ($120.87)
Sewerage: $800,000 ($99.38)
Judicial and Legal Services: $254,000 ($31.55)
General Public Buildings: $182,000 ($22.61)
Miscellaneous Commercial Activities - Other: $19,000 ($2.36)
- Water Utilities - Interest on Debt: $37,000 ($4.60)
Floresville government finances - Revenue in 2021 (per resident):
- Charges - Sewerage: $1,856,000 ($230.56)
Solid Waste Management: $1,243,000 ($154.41)
Parks and Recreation: $149,000 ($18.51)
Miscellaneous Commercial Activities: $13,000 ($1.61)
- Federal Intergovernmental - Water Utilities: $376,000 ($46.71)
General Local Government Support: $87,000 ($10.81)
- Miscellaneous - Fines and Forfeits: $283,000 ($35.16)
Interest Earnings: $7,000 ($0.87)
- Revenue - Water Utilities: $2,343,000 ($291.06)
- State Intergovernmental - Other: $135,000 ($16.77)
General Local Government Support: $9,000 ($1.12)
- Tax - General Sales and Gross Receipts: $4,222,000 ($524.47)
Property: $1,732,000 ($215.16)
Other License: $315,000 ($39.13)
Floresville government finances - Debt in 2021 (per resident):
- Long Term Debt - Outstanding Unspecified Public Purpose: $1,008,000 ($125.22)
Beginning Outstanding - Unspecified Public Purpose: $1,008,000 ($125.22)
| Businesses in Floresville, TX | ||||
| Name | Count | Name | Count | |
|---|---|---|---|---|
| AT&T | 2 | H&R Block | 1 | |
| AutoZone | 1 | La-Z-Boy | 1 | |
| Best Western | 1 | Lane Furniture | 1 | |
| Chevrolet | 1 | McDonald's | 1 | |
| Church's Chicken | 1 | Pizza Hut | 1 | |
| Cricket Wireless | 2 | RadioShack | 1 | |
| Curves | 1 | SONIC Drive-In | 1 | |
| Domino's Pizza | 1 | U-Haul | 1 | |
| FedEx | 1 | UPS | 4 | |
| Ford | 1 | Walmart | 1 | |
Strongest AM radio stations in Floresville:
- KTKR (760 AM; 50 kW; SAN ANTONIO, TX; Owner: CCB TEXAS LICENSES, L.P.)
- WOAI (1200 AM; 50 kW; SAN ANTONIO, TX; Owner: CCB TEXAS LICENSES, L.P.)
- KKYX (680 AM; 50 kW; SAN ANTONIO, TX; Owner: CXR HOLDINGS, INC.)
- KSAH (720 AM; 10 kW; UNIVERSAL CITY, TX; Owner: KSAH LICENSING, INC.)
- KSLR (630 AM; 5 kW; SAN ANTONIO, TX; Owner: SALEM MEDIA OF TEXAS, INC.)
- KENS (1160 AM; 25 kW; SAN ANTONIO, TX; Owner: KENS-TV, INC.)
- KDRY (1100 AM; 11 kW; ALAMO HEIGHTS, TX; Owner: KDRY RADIO, INC.)
- KTSA (550 AM; 5 kW; SAN ANTONIO, TX; Owner: INFINITY BROADCASTING CORPORATION OF SAN ANTONIO)
- KEDA (1540 AM; 5 kW; SAN ANTONIO, TX; Owner: D & E BROADCASTING CO., INC.)
- KONO (860 AM; 5 kW; SAN ANTONIO, TX; Owner: CXR HOLDINGS, INC.)
- KXTN (1310 AM; 5 kW; SAN ANTONIO, TX)
- KLUP (930 AM; 5 kW; TERRELL HILLS, TX; Owner: SOUTH TEXAS BROADCASTING, INC.)
- KFNI (1380 AM; 4 kW; PLEASANTON, TX; Owner: WAY BROADCASTING, INC.)
Strongest FM radio stations in Floresville:
- KXTN-FM (107.5 FM; SAN ANTONIO, TX; Owner: TICHENOR LICENSE CORPORATION ("TLC"))
- KROM (92.9 FM; SAN ANTONIO, TX; Owner: TICHENOR LICENSE CORPORATION ("TLC"))
- KSMG (105.3 FM; SEGUIN, TX; Owner: CXR HOLDINGS, INC.)
- KISS-FM (99.5 FM; SAN ANTONIO, TX; Owner: CXR HOLDINGS, INC.)
- KCJZ (106.7 FM; TERRELL HILLS, TX; Owner: CXR HOLDINGS, INC.)
- KBBT (98.5 FM; SCHERTZ, TX; Owner: HBC LICENSE CORPORATION)
- KLEY-FM (94.1 FM; FLORESVILLE, TX; Owner: KLEY LICENSING, INC.)
- KCYY (100.3 FM; SAN ANTONIO, TX; Owner: CXR HOLDINGS, INC.)
- KXXM (96.1 FM; SAN ANTONIO, TX; Owner: CCB TEXAS LICENSES, L.P.)
- KONO-FM (101.1 FM; HELOTES, TX; Owner: CXR HOLDINGS, INC.)
- KTFM (102.7 FM; SAN ANTONIO, TX; Owner: INFINITY BROADCASTING CORPORATION OF SAN ANTONIO)
- KQXT-FM (101.9 FM; SAN ANTONIO, TX; Owner: CCB TEXAS LICENSES, L.P.)
- KZEP-FM (104.5 FM; SAN ANTONIO, TX; Owner: TEXAS LOTUS LTD.)
- KWCB (89.7 FM; FLORESVILLE, TX; Owner: WILSON COUNTY ED. FOUNDATION, INC.)
- KSTX (89.1 FM; SAN ANTONIO, TX; Owner: TEXAS PUBLIC RADIO)
- KEMA (94.5 FM; THREE RIVERS, TX; Owner: ROY E. HENDERSON)
TV broadcast stations around Floresville:
- K45DX (Channel 45; FLORESVILLE, TX; Owner: TELEFUTURA PARTNERSHIP OF FLORESVILLE)
- KENS-TV (Channel 5; SAN ANTONIO, TX; Owner: KENS-TV, INC.)
- WOAI-TV (Channel 4; SAN ANTONIO, TX; Owner: CCB TEXAS LICENSES, L.P.)
- KSAT-TV (Channel 12; SAN ANTONIO, TX; Owner: POST-NEWSWEEK STATIONS, SAN ANTONIO, LP)
- KVDA (Channel 60; SAN ANTONIO, TX; Owner: TELEMUNDO OF TEXAS PARTNERSHIP, LP)
- KABB (Channel 29; SAN ANTONIO, TX; Owner: KABB LICENSEE, LLC)
- KHCE (Channel 23; SAN ANTONIO, TX; Owner: SAN ANTONIO COMMUNITY EDUCATIONAL TV, INC.)
- KWEX-TV (Channel 41; SAN ANTONIO, TX; Owner: KWEX LICENSE PARTNERSHIP, L.P.)
- KSAA-LP (Channel 28; SAN ANTONIO, TX; Owner: MAKO COMMUNICATIONS, LLC)
- KFTO-CA (Channel 67; SAN ANTONIO, TX; Owner: TELEFUTURA PARTNERSHIP OF SAN ANTONIO)
- KXTM-LP (Channel 21; SAN ANTONIO, TX; Owner: HUMBERTO LOPEZ)
- KLRN (Channel 9; SAN ANTONIO, TX; Owner: ALAMO PUBLIC TELECOMMUNICATIONS COUNCIL)
- KQVE-LP (Channel 46; La VERNIA, TX; Owner: WORD OF GOD FELLOWSHIP, INC.)
- KRRT (Channel 35; KERRVILLE, TX; Owner: SAN ANTONIO (KRRT-TV) LICENSEE, INC.)
- KMHZ-LP (Channel 65; SAN ANTONIO, TX; Owner: LOUIS MARTINEZ FAMILY GROUP, LLC)
- KJLF-LP (Channel 7; SAN ANTONIO, TX; Owner: B COMMUNICATIONS JOINT VENTURE)
- KNIC-CA (Channel 17; SAN ANTONIO, TX; Owner: TELEFUTURA PARTNERSHIP OF SAN ANTONIO)
- K52EA (Channel 52; SAN ANTONIO, TX; Owner: ORTIZ BROADCASTING CORPORATION)
- KBNB-LP (Channel 10; SAN ANTONIO, TX; Owner: B COMMUNICATIONS JOINT VENTURE)
- K31EX (Channel 31; SAN ANTONIO, TX; Owner: MAKO COMMUNICATIONS, LLC)
- National Bridge Inventory (NBI) Statistics
- 23Number of bridges
- 299ft / 91.3mTotal length
- $1,969,000Total costs
- 141,712Total average daily traffic
- 14,011Total average daily truck traffic
- 200,445Total future (year 2032) average daily traffic
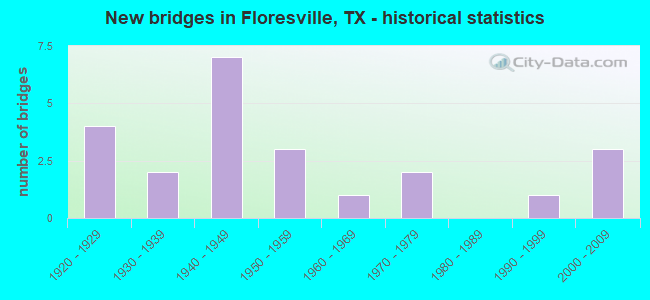
- New bridges - historical statistics
- 41920-1929
- 21930-1939
- 71940-1949
- 31950-1959
- 11960-1969
- 21970-1979
- 11990-1999
- 32000-2009
FCC Registered Antenna Towers: 234 (See the full list of FCC Registered Antenna Towers)
FCC Registered Private Land Mobile Towers: 1 (See the full list of FCC Registered Private Land Mobile Towers in Floresville, TX)
FCC Registered Broadcast Land Mobile Towers: 16 (See the full list of FCC Registered Broadcast Land Mobile Towers)
FCC Registered Microwave Towers: 519 (See the full list of FCC Registered Microwave Towers in this town)
FCC Registered Paging Towers: 1 (See the full list of FCC Registered Paging Towers)
FCC Registered Amateur Radio Licenses: 75 (See the full list of FCC Registered Amateur Radio Licenses in Floresville)
FAA Registered Aircraft: 13 (See the full list of FAA Registered Aircraft in Floresville)
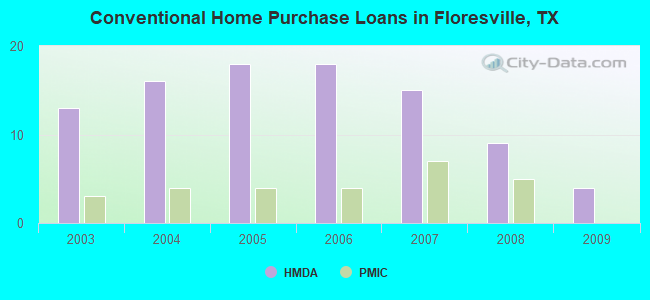
| Home Mortgage Disclosure Act Aggregated Statistics For Year 2009 (Based on 1 partial tract) | ||||||||||||
| A) FHA, FSA/RHS & VA Home Purchase Loans | B) Conventional Home Purchase Loans | C) Refinancings | D) Home Improvement Loans | F) Non-occupant Loans on < 5 Family Dwellings (A B C & D) | G) Loans On Manufactured Home Dwelling (A B C & D) | |||||||
|---|---|---|---|---|---|---|---|---|---|---|---|---|
| Number | Average Value | Number | Average Value | Number | Average Value | Number | Average Value | Number | Average Value | Number | Average Value | |
| LOANS ORIGINATED | 5 | $116,978 | 4 | $84,580 | 8 | $120,606 | 3 | $42,253 | 2 | $78,620 | 2 | $64,135 |
| APPLICATIONS APPROVED, NOT ACCEPTED | 0 | $0 | 2 | $77,715 | 2 | $91,445 | 1 | $25,650 | 1 | $36,820 | 2 | $56,890 |
| APPLICATIONS DENIED | 1 | $164,780 | 3 | $42,757 | 6 | $77,663 | 5 | $20,644 | 2 | $37,725 | 2 | $59,605 |
| APPLICATIONS WITHDRAWN | 0 | $0 | 1 | $72,130 | 3 | $104,723 | 2 | $32,445 | 0 | $0 | 0 | $0 |
| FILES CLOSED FOR INCOMPLETENESS | 0 | $0 | 0 | $0 | 0 | $0 | 0 | $0 | 0 | $0 | 0 | $0 |
Detailed HMDA statistics for the following Tracts: 9803.00
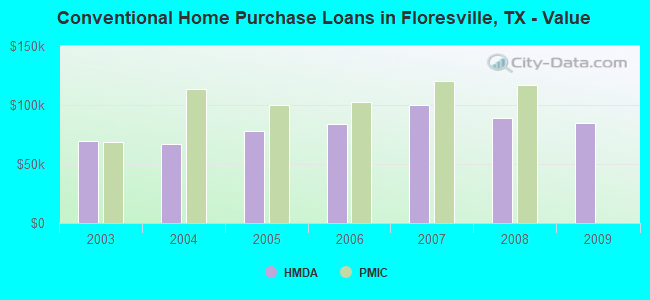
| Private Mortgage Insurance Companies Aggregated Statistics For Year 2008 (Based on 1 partial tract) | ||
| A) Conventional Home Purchase Loans | ||
|---|---|---|
| Number | Average Value | |
| LOANS ORIGINATED | 5 | $116,978 |
| APPLICATIONS APPROVED, NOT ACCEPTED | 0 | $0 |
| APPLICATIONS DENIED | 0 | $0 |
| APPLICATIONS WITHDRAWN | 0 | $0 |
| FILES CLOSED FOR INCOMPLETENESS | 0 | $0 |
Detailed PMIC statistics for the following Tracts: 9803.00
2002 - 2018 National Fire Incident Reporting System (NFIRS) incidents
- Fire incident types reported to NFIRS in Floresville, TX
- 41367.3%Outside Fires
- 12219.9%Structure Fires
- 579.3%Mobile Property/Vehicle Fires
- 223.6%Other
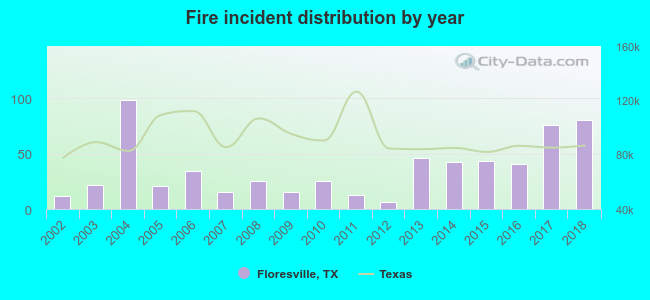 According to the data from the years 2002 - 2018 the average number of fires per year is 36. The highest number of fires - 98 took place in 2004, and the least - 6 in 2012. The data has a rising trend.
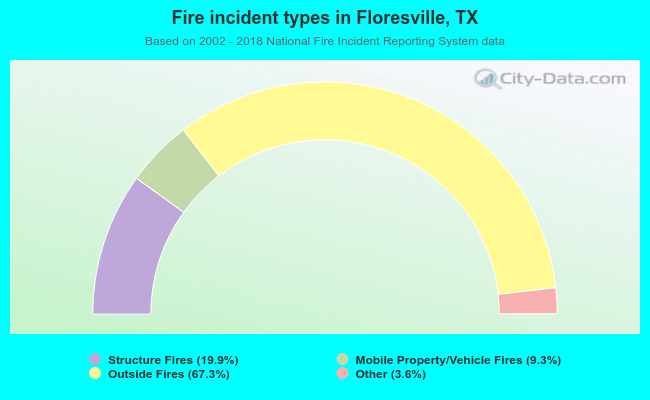 When looking into fire subcategories, the most incidents belonged to: Outside Fires (67.3%), and Structure Fires (19.9%).
Fire-safe hotels and motels in Floresville, Texas:
- Super 8 Floresville, 1500 Tenth St, Floresville, Texas 78114 , Phone: (830) 393-1953, Fax: (830) 393-2042
- Holiday Inn Express & Suites Floresville, 929 10th St, Floresville, Texas 78114 , Phone: (830) 393-7400, Fax: (830) 393-0400
- Best Western Floresville Inn, 1720 10th St, Floresville, Texas 78114 , Phone: (830) 393-0443, Fax: (830) 393-1900
- La Quinta Inn & Suites, 1910 10th St, Floresville, Texas 78114 , Phone: (800) 531-5900, Fax: (830) 393-6688
| Most common first names in Floresville, TX among deceased individuals | ||
| Name | Count | Lived (average) |
|---|---|---|
| Mary | 65 | 82.7 years |
| John | 46 | 73.7 years |
| William | 39 | 74.0 years |
| Maria | 36 | 75.0 years |
| Joe | 35 | 78.0 years |
| James | 27 | 73.5 years |
| Frank | 25 | 78.6 years |
| Robert | 25 | 74.8 years |
| Henry | 19 | 74.0 years |
| George | 18 | 74.6 years |
| Most common last names in Floresville, TX among deceased individuals | ||
| Last name | Count | Lived (average) |
|---|---|---|
| Flores | 40 | 75.3 years |
| Martinez | 40 | 74.0 years |
| Garza | 29 | 76.4 years |
| Garcia | 29 | 71.7 years |
| Gonzales | 26 | 76.0 years |
| Estrada | 23 | 73.2 years |
| Montoya | 23 | 74.0 years |
| Smith | 22 | 79.5 years |
| Rodriguez | 21 | 79.2 years |
| Johnson | 21 | 75.6 years |
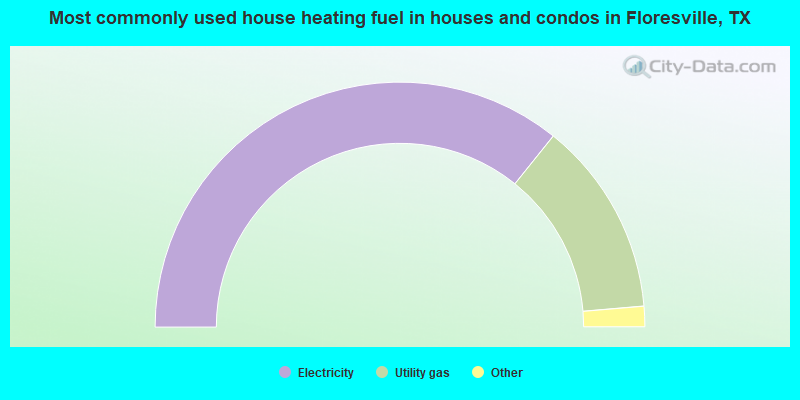
- 71.6%Electricity
- 25.8%Utility gas
- 1.8%Bottled, tank, or LP gas
- 0.9%No fuel used
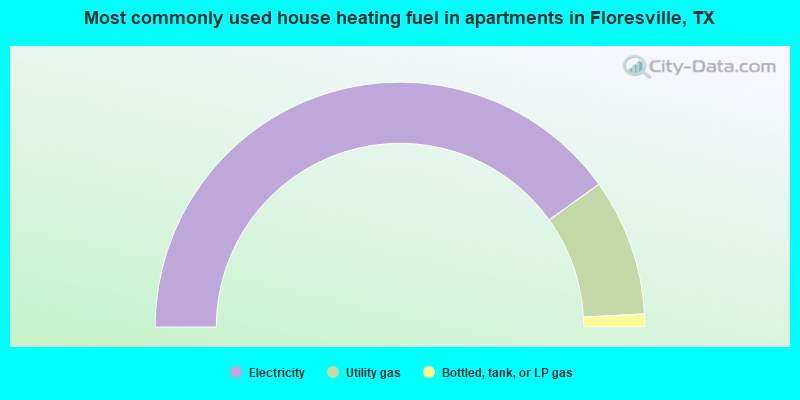
- 80.2%Electricity
- 18.1%Utility gas
- 1.7%Bottled, tank, or LP gas
Floresville compared to Texas state average:
- Unemployed percentage below state average.
- Black race population percentage significantly below state average.
- Hispanic race population percentage above state average.
- Median age above state average.
- Foreign-born population percentage significantly below state average.
- Length of stay since moving in significantly above state average.
- Institutionalized population percentage significantly above state average.
Floresville on our top lists:
- #69 on the list of "Top 101 cities with largest percentage of males in industries: utilities (population 5,000+)"
- #95 (78114) on the list of "Top 101 zip codes with the largest percentage of Czech first ancestries (pop 5,000+)"

|
|
Total of 40 patent applications in 2008-2024.