Estimated zip code population in 2022: 43,458 Zip code population in 2010: 40,396 Zip code population in 2000: 39,477
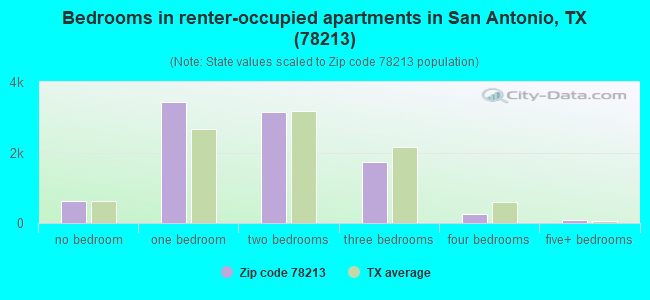
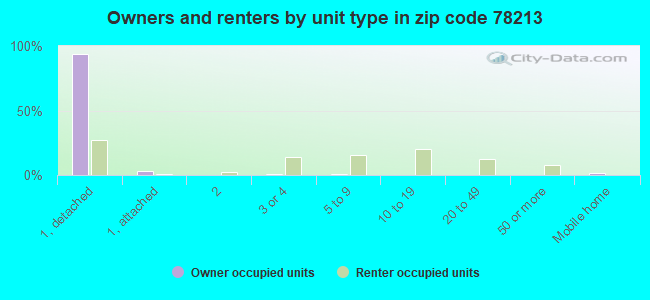
Houses and condos: 18,838 Renter-occupied apartments: 9,308
% of renters here:
53%
State:
38%
March 2022 cost of living index in zip code 78213: 88.1 (less than average, U.S. average is 100)
Land area: 8.0 sq. mi. Water area: 0.0 sq. mi.
Population density: 5,425 people per square mile
(average).
OSM Map
General Map
Google Map
MSN Map
OSM Map
General Map
Google Map
MSN Map
OSM Map
General Map
Google Map
MSN Map
OSM Map
General Map
Google Map
MSN Map
Please wait while loading the map...
Real estate property taxes paid for housing units in 2022:
This zip code:
1.7% ($3,715)
Texas:
1.5% ($4,050)
Median real estate property taxes paid for housing units with mortgages in 2022: $3,916 (1.8%) Median real estate property taxes paid for housing units with no mortgage in 2022: $3,272 (1.5%)
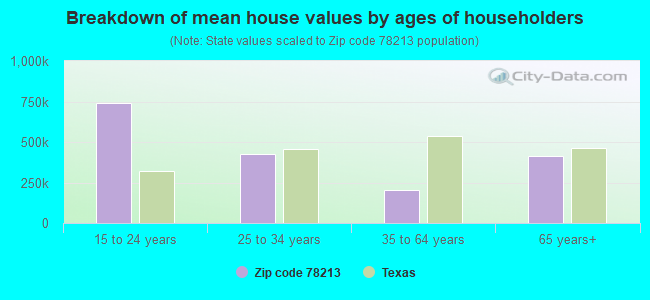
Estimated median house/condo value in 2022: $217,543
78213:
$217,543
Texas:
$275,400
According to our research of Texas and other state lists, there were 69 registered sex offenders living in 78213 zip code as of April 27, 2024. The ratio of all residents to sex offenders in zip code 78213 is 631 to 1. The ratio of registered sex offenders to all residents in this zip code is lower than the state average.
Median resident age:
This zip code:
35.7 years
Texas median age:
35.6 years
Average household size:
This zip code:
2.5 people
Texas:
2.6 people
Averages for the 2020 tax year for zip code 78213, filed in 2021:
Average Adjusted Gross Income (AGI) in 2020: $47,887 (Individual Income Tax Returns)
Here:
$47,887
State:
$77,054
Salary/wage: $40,913 (reported on 81.2% of returns)
Here:
$40,913
State:
$62,766
(% of AGI for various income ranges: 1161.5% for AGIs below $25k, 3505.0% for AGIs $25k-50k, 6240.0% for AGIs $50k-75k, 9116.4% for AGIs $75k-100k, 16982.6% for AGIs $100k-200k, 74436.9% for AGIs over 200k)
Taxable interest for individuals: $2,240 (reported on 16.7% of returns)
This zip code:
$2,240
Texas:
$2,665
(% of AGI for various income ranges: 7.2% for AGIs below $25k, 13.2% for AGIs $25k-50k, 44.2% for AGIs $50k-75k, 83.9% for AGIs $75k-100k, 199.9% for AGIs $100k-200k, 2586.9% for AGIs over 200k)
Ordinary dividends: $7,154 (reported on 9.4% of returns)
Here:
$7,154
State:
$10,044
(% of AGI for various income ranges: 10.0% for AGIs below $25k, 13.3% for AGIs $25k-50k, 54.1% for AGIs $50k-75k, 135.3% for AGIs $75k-100k, 445.0% for AGIs $100k-200k, 5158.5% for AGIs over 200k)
Net capital gain/loss in AGI: +$18,729 (reported on 8.7% of returns)
Here:
+$18,729
State:
+$39,590
(% of AGI for various income ranges: 4.1% for AGIs below $25k, 17.0% for AGIs $25k-50k, 57.7% for AGIs $50k-75k, 172.2% for AGIs $75k-100k, 697.6% for AGIs $100k-200k, 18318.5% for AGIs over 200k)
Profit/loss from business: +$11,357 (reported on 20.4% of returns)
Here:
+$11,357
State:
+$10,888
(% of AGI for various income ranges: 211.0% for AGIs below $25k, 171.8% for AGIs $25k-50k, 198.0% for AGIs $50k-75k, 391.8% for AGIs $75k-100k, 805.6% for AGIs $100k-200k, 8597.7% for AGIs over 200k)
Taxable individual retirement arrangement distribution: $16,530 (reported on 5.0% of returns)
78213:
$16,530
Texas:
$24,740
(% of AGI for various income ranges: 22.8% for AGIs below $25k, 33.6% for AGIs $25k-50k, 127.1% for AGIs $50k-75k, 298.1% for AGIs $75k-100k, 634.3% for AGIs $100k-200k, 3182.3% for AGIs over 200k)
Self-employed (Keogh) retirement plans: $15,700 (reported on 0.2% of returns)
78213:
$15,700
Texas:
$29,298
(% of AGI for various income ranges: 67.3% for AGIs $100k-200k)
Total itemized deductions: $31,025 (reported on 4.1% of returns)
Here:
$31,025
State:
$40,428
(% of AGI for various income ranges: 25.1% for AGIs below $25k, 65.9% for AGIs $25k-50k, 232.0% for AGIs $50k-75k, 318.4% for AGIs $75k-100k, 737.0% for AGIs $100k-200k, 6151.5% for AGIs over 200k)
Charity contributions: $10,531 (reported on 3.1% of returns)
Here:
$10,531
State:
$18,201
(% of AGI for various income ranges: 2.4% for AGIs below $25k, 12.1% for AGIs $25k-50k, 35.5% for AGIs $50k-75k, 52.3% for AGIs $75k-100k, 189.7% for AGIs $100k-200k, 2514.6% for AGIs over 200k)
Taxes paid: $7,108 (reported on 3.9% of returns)
78213:
$7,108
State:
$7,821
(% of AGI for various income ranges: 4.8% for AGIs below $25k, 13.4% for AGIs $25k-50k, 49.6% for AGIs $50k-75k, 74.5% for AGIs $75k-100k, 184.1% for AGIs $100k-200k, 1263.8% for AGIs over 200k)
Earned income credit: $2,491 (reported on 24.7% of returns)
Here:
$2,491
State:
$2,584
(% of AGI for various income ranges: 127.6% for AGIs below $25k, 77.2% for AGIs $25k-50k, 1.3% for AGIs $50k-75k)
Percentage of individuals using paid preparers for their 2020 taxes: 91.0%
Here:
91%
State:
92%
(% for various income ranges: 90.1% for AGIs below $25k, 92.1% for AGIs $25k-50k, 91.2% for AGIs $50k-75k, 91.2% for AGIs $75k-100k, 90.3% for AGIs $100k-200k, 91.8% for AGIs over 200k)
Averages for the 2012 tax year for zip code 78213, filed in 2013:
Average Adjusted Gross Income (AGI) in 2012: $41,430 (Individual Income Tax Returns)
Here:
$41,430
State:
$65,384
Salary/wage: $34,059 (reported on 83.7% of returns)
Here:
$34,059
State:
$52,524
(% of AGI for various income ranges: 79.5% for AGIs below $25k, 84.9% for AGIs $25k-50k, 75.8% for AGIs $50k-75k, 72.0% for AGIs $75k-100k, 65.3% for AGIs $100k-200k, 35.3% for AGIs over 200k)
Taxable interest for individuals: $2,319 (reported on 19.2% of returns)
This zip code:
$2,319
Texas:
$2,372
(% of AGI for various income ranges: 0.6% for AGIs below $25k, 0.5% for AGIs $25k-50k, 0.7% for AGIs $50k-75k, 1.1% for AGIs $75k-100k, 1.6% for AGIs $100k-200k, 2.2% for AGIs over 200k)
Ordinary dividends: $7,487 (reported on 9.9% of returns)
Here:
$7,487
State:
$9,721
(% of AGI for various income ranges: 0.7% for AGIs below $25k, 0.6% for AGIs $25k-50k, 1.0% for AGIs $50k-75k, 1.5% for AGIs $75k-100k, 2.8% for AGIs $100k-200k, 4.2% for AGIs over 200k)
Net capital gain/loss in AGI: +$11,349 (reported on 8.0% of returns)
Here:
+$11,349
State:
+$35,319
(% of AGI for various income ranges: 0.1% for AGIs below $25k, 0.1% for AGIs $25k-50k, 0.4% for AGIs $50k-75k, 1.0% for AGIs $75k-100k, 2.7% for AGIs $100k-200k, 8.1% for AGIs over 200k)
Profit/loss from business: +$11,198 (reported on 16.7% of returns)
Here:
+$11,198
State:
+$13,732
(% of AGI for various income ranges: 11.1% for AGIs below $25k, 2.8% for AGIs $25k-50k, 2.4% for AGIs $50k-75k, 3.4% for AGIs $75k-100k, 4.7% for AGIs $100k-200k, 3.4% for AGIs over 200k)
Taxable individual retirement arrangement distribution: $14,748 (reported on 6.5% of returns)
78213:
$14,748
Texas:
$19,511
(% of AGI for various income ranges: 1.2% for AGIs below $25k, 1.1% for AGIs $25k-50k, 1.9% for AGIs $50k-75k, 3.6% for AGIs $75k-100k, 4.4% for AGIs $100k-200k, 2.9% for AGIs over 200k)
Self-employment retirement plans: $18,483 (reported on 0.3% of returns)
78213:
$18,483
Texas:
$23,938
Total itemized deductions: $19,304 (18% of AGI, reported on 14.7% of returns)
Here:
$19,304
State:
$24,724
Here:
18.3% of AGI
State:
15.9% of AGI
(% of AGI for various income ranges: 4.0% for AGIs below $25k, 5.8% for AGIs $25k-50k, 8.0% for AGIs $50k-75k, 8.8% for AGIs $75k-100k, 10.1% for AGIs $100k-200k, 6.1% for AGIs over 200k)
Charity contributions: $4,315 (reported on 11.2% of returns)
Here:
$4,315
State:
$6,808
(% of AGI for various income ranges: 0.3% for AGIs below $25k, 0.5% for AGIs $25k-50k, 1.2% for AGIs $50k-75k, 1.4% for AGIs $75k-100k, 1.9% for AGIs $100k-200k, 2.0% for AGIs over 200k)
Taxes paid: $5,623 (reported on 14.2% of returns)
78213:
$5,623
State:
$6,921
(% of AGI for various income ranges: 0.8% for AGIs below $25k, 1.4% for AGIs $25k-50k, 2.0% for AGIs $50k-75k, 2.6% for AGIs $75k-100k, 3.3% for AGIs $100k-200k, 2.2% for AGIs over 200k)
Earned income credit: $2,465 (reported on 28.4% of returns)
Here:
$2,465
State:
$2,570
(% of AGI for various income ranges: 8.5% for AGIs below $25k, 1.4% for AGIs $25k-50k)
Percentage of individuals using paid preparers for their 2012 taxes: 45.3%
Here:
45%
State:
51%
(% for various income ranges: 45.4% for AGIs below $25k, 41.3% for AGIs $25k-50k, 46.4% for AGIs $50k-75k, 48.4% for AGIs $75k-100k, 53.5% for AGIs $100k-200k, 71.9% for AGIs over 200k)
Averages for the 2004 tax year for zip code 78213, filed in 2005:
Average Adjusted Gross Income (AGI) in 2004: $34,689 (Individual Income Tax Returns)
Here:
$34,689
State:
$47,881
Salary/wage: $29,802 (reported on 82.8% of returns)
Here:
$29,802
State:
$41,947
(% of AGI for various income ranges: 126.8% for AGIs below $10k, 81.5% for AGIs $10k-25k, 82.4% for AGIs $25k-50k, 74.6% for AGIs $50k-75k, 68.5% for AGIs $75k-100k, 47.7% for AGIs over 100k)
Taxable interest for individuals: $3,037 (reported on 28.8% of returns)
This zip code:
$3,037
Texas:
$2,255
(% of AGI for various income ranges: 12.0% for AGIs below $10k, 1.4% for AGIs $10k-25k, 1.3% for AGIs $25k-50k, 1.9% for AGIs $50k-75k, 2.9% for AGIs $75k-100k, 4.1% for AGIs over 100k)
Taxable dividends: $4,355 (reported on 14.1% of returns)
Here:
$4,355
State:
$4,261
(% of AGI for various income ranges: 3.4% for AGIs below $10k, 0.8% for AGIs $10k-25k, 0.6% for AGIs $25k-50k, 1.5% for AGIs $50k-75k, 1.6% for AGIs $75k-100k, 3.7% for AGIs over 100k)
Net capital gain/loss: +$12,390 (reported on 11.9% of returns)
Here:
+$12,390
State:
+$16,110
(% of AGI for various income ranges: -0.6% for AGIs below $10k, 0.3% for AGIs $10k-25k, 0.3% for AGIs $25k-50k, 1.1% for AGIs $50k-75k, 1.5% for AGIs $75k-100k, 14.2% for AGIs over 100k)
Profit/loss from business: +$9,994 (reported on 14.5% of returns)
Here:
+$9,994
State:
+$11,013
(% of AGI for various income ranges: 9.2% for AGIs below $10k, 5.3% for AGIs $10k-25k, 2.5% for AGIs $25k-50k, 2.3% for AGIs $50k-75k, 3.7% for AGIs $75k-100k, 6.3% for AGIs over 100k)
IRA payment deduction: $3,055 (reported on 1.5% of returns)
78213:
$3,055
Texas:
$3,120
(% of AGI for various income ranges: 0.1% for AGIs $10k-25k, 0.1% for AGIs $25k-50k, 0.1% for AGIs $50k-75k, 0.1% for AGIs $75k-100k, 0.2% for AGIs over 100k)
Self-employed pension: $15,054 (reported on 0.4% of returns)
Here:
$15,054
Texas:
$16,401
Total itemized deductions: $16,238 (21% of AGI, reported on 15.5% of returns)
Here:
$16,238
State:
$19,631
Here:
21.0% of AGI
State:
18.9% of AGI
(% of AGI for various income ranges: 9.4% for AGIs below $10k, 4.5% for AGIs $10k-25k, 6.2% for AGIs $25k-50k, 7.9% for AGIs $50k-75k, 9.9% for AGIs $75k-100k, 8.6% for AGIs over 100k)
Charity contributions deductions: $3,882 (5% of AGI, reported on 12.8% of returns)
Here:
$3,882
State:
$4,753
Here:
4.6% of AGI
State:
4.2% of AGI
(% of AGI for various income ranges: 0.5% for AGIs below $10k, 0.4% for AGIs $10k-25k, 0.9% for AGIs $25k-50k, 1.4% for AGIs $50k-75k, 2.1% for AGIs $75k-100k, 2.5% for AGIs over 100k)
Total tax: $5,372 (reported on 70.1% of returns)
78213:
$5,372
State:
$9,058
(% of AGI for various income ranges: 5.1% for AGIs below $10k, 3.8% for AGIs $10k-25k, 7.0% for AGIs $25k-50k, 9.8% for AGIs $50k-75k, 11.8% for AGIs $75k-100k, 20.1% for AGIs over 100k)
Earned income credit: $1,943 (reported on 25.0% of returns)
Here:
$1,943
State:
$2,024
Percentage of individuals using paid preparers for their 2004 taxes: 54.7%
Here:
55%
State:
57%
(% for various income ranges: 53.9% for AGIs below $10k, 59.1% for AGIs $10k-25k, 49.9% for AGIs $25k-50k, 50.7% for AGIs $50k-75k, 51.5% for AGIs $75k-100k, 67.4% for AGIs over 100k)
Likely homosexual households (counted as self-reported same-sex unmarried-partner households)
Lesbian couples: 0.2% of all households
Gay men: 0.4% of all households
Household received Food Stamps/SNAP in the past 12 months: 2,763 Household did not receive Food Stamps/SNAP in the past 12 months: 14,763
Women who had a birth in the past 12 months: 503 (360 now married, 143 unmarried) Women who did not have a birth in the past 12 months: 10,980 (4,073 now married, 6,930 unmarried)
Housing units in zip code 78213 with a mortgage: 4,914 (228 second mortgage, 41 home equity loan, 162 both second mortgage and home equity loan) Houses without a mortgage: 209
Median monthly owner costs for units with a mortgage: $1,447 Median monthly owner costs for units without a mortgage: $615
Residents with income below the poverty level in 2022:
This zip code:
20.3%
Whole state:
14.0%
Residents with income below 50% of the poverty level in 2022:
This zip code:
15.5%
Whole state:
7.4%
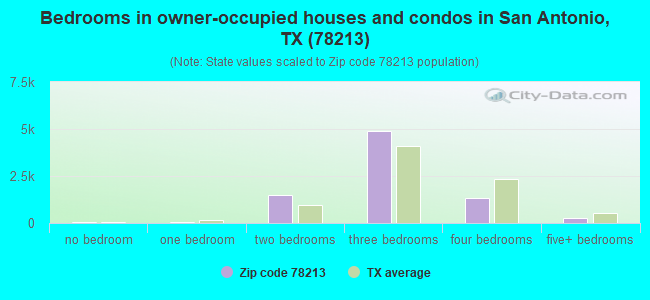
Median number of rooms in houses and condos:
Here:
5.9
State:
6.3
Median number of rooms in apartments:
Here:
3.8
State:
4.0
Notable locations in this zip code not listed on our city pages
Notable locations in zip code 78213: Antonian Retreat Center (A), Castle Hills Fire Department (B), Castle Hills City Police Department (C), Kindercare Learning Centers (D), Pilgrim School and Daycare (E), San Antonio Genealogical and Historical Society (F). Display/hide their locations on the map
Churches in zip code 78213 include: United Church of Christ Bethany Congregational (A), Church of Christ Vance Jackson (B), First Church of the Nazarene (C), Lutheran Mission Church (D), Gethsemane Lutheran Church (E), United Methodist Church Saint Marks (F), Christ Fellowship Church (G), Pilgrim Presbyterian Church (H), Covenant Presbyterian Church (I). Display/hide their locations on the map
Parks in zip code 78213 include: Olympia Park (1), Dellview Park (2), Windsor Park (3), Antonian Stadium (4), Aggie Park (5). Display/hide their locations on the map
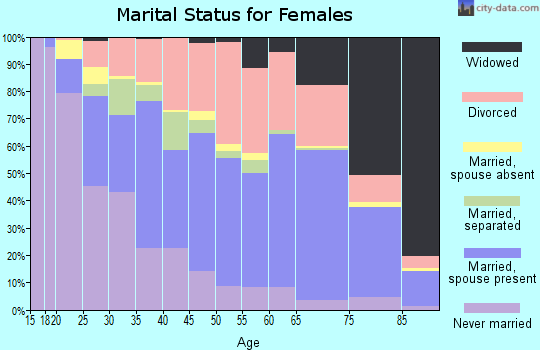
6,183 married couples with children.
3,171 single-parent households (285 men, 2,886 women).
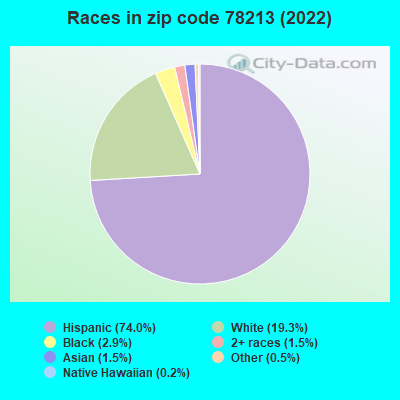
51.5% of residents of 78213 zip code speak English at home.
46.8% of residents speak Spanish at home (59% very well, 14% well, 12% not well, 14% not at all).
0.5% of residents speak other Indo-European language at home (69% very well, 5% well, 26% not well).
1.2% of residents speak Asian or Pacific Island language at home (70% very well, 8% well, 14% not well, 7% not at all).
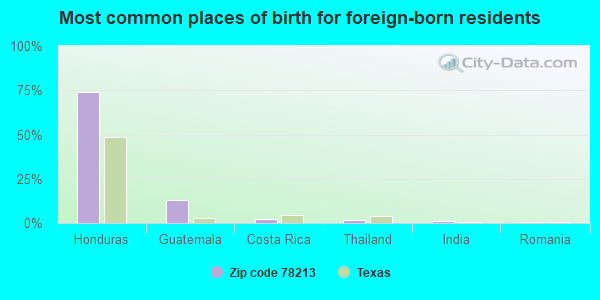
Foreign born population: 8,545 (19.7%) (26.9% of them are naturalized citizens)
Facilities with environmental interests located in this zip code:
ARNOLD EL (467 FREILING DR in SAN ANTONIO, TX)
(National Center for Education Statistics) - STATE ID-015907101 Organizations: SAN ANTONIO ISD (SCHOOL DISTRICT)
Housing units lacking complete plumbing facilities: 0.2% Housing units lacking complete kitchen facilities: 1.1%
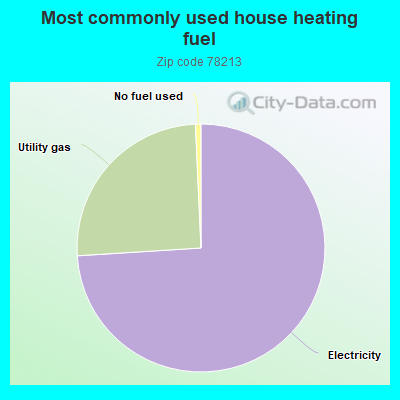
73.7%Electricity
25.2%Utility gas
0.7%No fuel used
Population in 1990: 36,060. Population change in the 1990s: +3,417 (+9.5%).
Place of birth for U.S.-born residents:
This state: 26,731
Northeast: 1,321
Midwest: 1,416
South: 2,529
West: 2,193
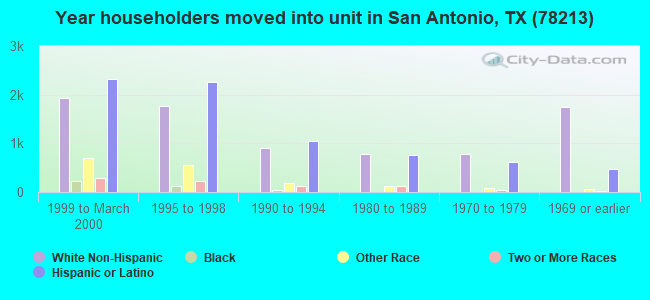
51% of the 78213 zip code residents lived in the same house 5 years ago. Out of people who lived in different houses, 70% lived in this county. Out of people who lived in different counties, 50% lived in Texas.
87% of the 78213 zip code residents lived in the same house 1 year ago. Out of people who lived in different houses, 74% moved from this county. Out of people who lived in different houses, 11% moved from different county within same state. Out of people who lived in different houses, 6% moved from different state. Out of people who lived in different houses, 5% moved from abroad.
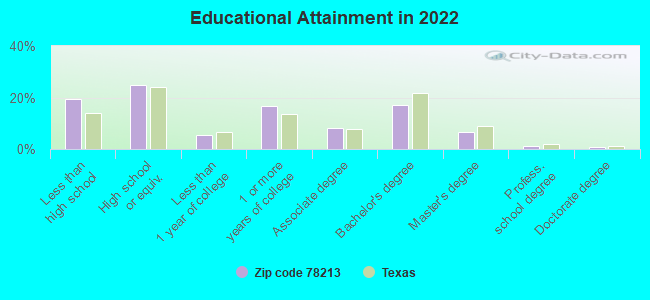
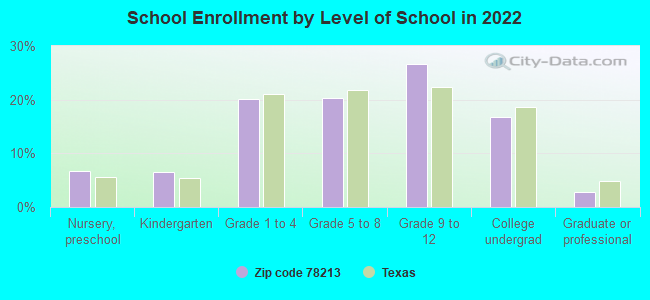
Private vs. public school enrollment:
Students in private schools in grades 1 to 8 (elementary and middle school): 482
Here:
11.5%
Texas:
8.8%
Students in private schools in grades 9 to 12 (high school): 277
Here:
10.0%
Texas:
8.0%
Students in private undergraduate colleges: 221
Here:
12.7%
Texas:
16.2%
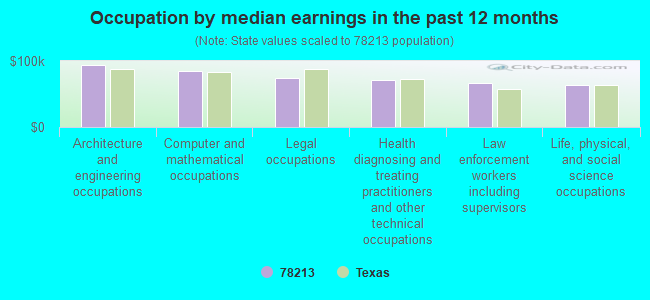
Occupation by median earnings in the past 12 months ($)
94,672Architecture and engineering occupations
84,958Computer and mathematical occupations
74,832Legal occupations
71,204Health diagnosing and treating practitioners and other technical occupations
66,397Law enforcement workers including supervisors
63,428Life, physical, and social science occupations
Companies with biggest federal contracts located in this zip code (SAN ANTONIO, TX):
MEDICAL BUS CONS OF SAN ANTNIO (6800 PARK TEN BLVD; small business) : $59,698,507 in 68 contractsfrom 1999 to 2006
Contracts for Other Professional Services, Nursing Services, General Health Care Services, Laboratory Testing Services, and moreby Office of Assistant Secretary for Health except national centers (disused code), Army, Air Force, Department of Defense, and others Signed by year:2000: $315,478; 2001: $7,668,902; 2002: $7,924,667; 2003: $6,580,123; 2004: $9,522,520; 2005: $17,363,567; 2006: $4,108,685.
Biggest contracts:
$4,890,122 with Office of Assistant Secretary for Health except national centers (disused code) for Other Professional Services. Signed on 2005-11-10. Completion date: 2007-09-30.
$4,654,644 with Office of Assistant Secretary for Health except national centers (disused code) for Nursing Services. Signed on 2005-11-10. Completion date: 2007-11-14.
$3,953,028 with Army for General Health Care Services. Signed on 2001-10-25. Completion date: 2002-09-30.
$3,800,000 with Office of Assistant Secretary for Health except national centers (disused code) for Other Professional Services. Signed on 2002-10-15. Completion date: 2003-09-15.
MAIN BUILDING MAINTENANCE, INC (6800 PARK TEN BLVD., STE.; small business) : $34,747,315 in 135 contractsfrom 1999 to 2006
Contracts for Custodial Janitorial Services, Landscaping/Groundskeeping Services, Maintenance, Repair or Alteration of Real Property -- Family Housing Facilities, Maintenance, Repair or Alteration of Real Property -- Miscellaneous Buildings, and moreby Army, Air Force, Public Buildings Service Signed by year:2000: $5,378,424; 2001: $5,314,470; 2002: $7,290,915; 2003: $5,100,293; 2004: $3,008,442; 2005: $3,630,003; 2006: $973,182.
Biggest contracts:
$2,241,051 with Army for Custodial Janitorial Services. Signed on 2003-10-24. Completion date: 2004-09-30.
$2,231,583, same as above.Signed on 2002-11-07. Completion date: 2004-09-30.
$2,112,821, same as above.Signed on 2001-12-28. Completion date: 2002-12-31.
$1,965,107, same as above.Signed on 1999-12-16. Completion date: 2002-12-31.
BELDON ROOFING & REMODELING CO (5039 WEST AVE) : $16,089,315 in 135 contractsfrom 1999 to 2005
Contracts for Maintenance, Repair or Alteration of Real Property -- Miscellaneous Buildings, Maintenance, Repair or Alteration of Real Property -- Office Buildings, Maintenance, Repair or Alteration of Real Property -- Maintenance Buildings, Maintenance, Repair or Alteration of Real Property -- Other Airfield Structures, and moreby Air Force, Navy, Army Signed by year:2000: $3,252,445; 2001: $4,537,977; 2002: $5,257,293; 2003: $1,382,625; 2004: $742,429; 2005: -$11,728; 2006: $0.
Biggest contracts:
$4,199,259 with Air Force for Maintenance, Repair or Alteration of Real Property -- Miscellaneous Buildings. Taking place in AZ. Signed on 2002-09-24. Completion date: 2002-10-31.
$769,977 with Navy for Maintenance, Repair or Alteration of Real Property -- Miscellaneous Buildings. Taking place in NC. Signed on 2000-05-31. Completion date: 2000-09-30.
$684,035 with Air Force for Maintenance, Repair or Alteration of Real Property -- Office Buildings. Taking place in FL. Signed on 2000-08-18. Completion date: 2000-09-14.
$620,849 with Air Force for Maintenance, Repair or Alteration of Real Property -- Maintenance Buildings. Taking place in AR. Signed on 2003-07-19. Completion date: 2004-02-07.
AMIGO/JT JOINT VENTURE (6800 PARK TEN BLVD SUITE; small business) : $14,688,945 in 13 contractsfrom 2000 to 2006
Contracts for Construction of Structures and Facilities -- Office Buildings, Maintenance, Repair or Alteration of Real Property -- Miscellaneous Buildings, Construction of Structures and Facilities -- Other Industrial Buildings, Construction of Structures and Facilities -- Other Airfield Structures by Army, Navy Signed by year:2000: $7,807,399; 2001: $10,000; 2002: -$1,144; 2003: $6,654,009; 2004: $65,899; 2005: $145,852; 2006: $6,930.
Biggest contracts:
$7,788,499 with Army for Construction of Structures and Facilities -- Office Buildings. Taking place in AR. Signed on 2000-09-22. Completion date: 2001-12-20.
$6,640,925 with Navy for Maintenance, Repair or Alteration of Real Property -- Miscellaneous Buildings. Signed on 2003-09-11. Completion date: 2005-11-15.
$128,349 with Navy for Construction of Structures and Facilities -- Other Industrial Buildings. Signed on 2005-03-22. Completion date: 2007-02-01.
$65,899, same as above.Signed on 2004-12-03. Completion date: 2007-02-01.
VERIDIAN INFORMATION SOLUTIONS (1100 NW LOOP 410) : $9,368,742 in 23 contractsfrom 2001 to 2006
Contracts for Engineering and Technical Services, ADPE System Configuration, ADP Software by Air Force Signed by year:2000: $0; 2001: $99,588; 2002: $0; 2003: $3,962,450; 2004: $2,738,885; 2005: $2,295,819; 2006: $272,000.
Biggest contracts:
$2,545,437 with Air Force for Engineering and Technical Services. Signed on 2004-10-01. Completion date: 2005-09-30.
$2,251,855, same as above.Signed on 2003-11-24. Completion date: 2005-11-24.
$2,054,994, same as above.Signed on 2005-10-01. Completion date: 2006-09-30.
$828,171, same as above.Signed on 2003-10-16. Completion date: 2004-10-15.
INTELLICA CORPORATION (6804 #1 WEST AVENUE; small business) : $4,242,300 in 28 contractsfrom 2002 to 2006
Contracts for Automated Information System Design and Integration Services, ADP Systems Analysis Services, Programming Services, Technical Representation Services -- Automatic Data Processing Equipment (Including Firmware), Software, Supplies and Support Equipment by Army, Federal Technology Service, Air Force, Minerals Management Service, and others Signed by year:2000: $0; 2001: $0; 2002: $198,000; 2003: $1,267,992; 2004: $1,361,573; 2005: $1,319,548; 2006: $95,187.
Biggest contracts:
$1,292,200 with Army for Automated Information System Design and Integration Services. Signed on 2004-10-08. Completion date: 2004-09-30.
$1,165,651, same as above.Signed on 2005-10-06. Completion date: 2006-09-30.
$1,014,820, same as above.Signed on 2003-12-09. Completion date: 2004-09-30.
$209,172 with Federal Technology Service for ADP Systems Analysis Services. Taking place in VA. Signed on 2003-06-26. Completion date: 2004-06-24.
JOSHUA ENGINEERING GROUP INC (2161 NW MILITARY HWY, SUIT; small business) : $2,460,865 in 50 contractsfrom 1999 to 2006
Contracts for Other Architect and Engineering Services, Architect - Engineer Services (including landscaping, interior layout, and designing), Educational Buildings, Maintenance, Repair or Alteration of Real Property -- Air Traffic Control Training Facilities, and moreby Air Force Signed by year:2000: $43,672; 2001: $115,068; 2002: $554,493; 2003: $800,533; 2004: $282,732; 2005: $593,152; 2006: $22,008.
Biggest contracts:
$399,617 with Air Force for Other Architect and Engineering Services. Signed on 2005-06-16. Completion date: 2005-12-09.
$277,621, same as above.Signed on 2003-03-31. Completion date: 2003-12-08.
$199,983, same as above.Signed on 2003-03-31. Completion date: 2004-03-10.
$139,609 with Air Force for Architect - Engineer Services (including landscaping, interior layout, and designing). Signed on 2004-09-01. Completion date: 2005-07-11.
J T CONSTRUCTION CO INC (6800 PARK TEN BLVD 226E) : $817,405 in 23 contractsfrom 1999 to 2002
Contracts for Construction of Structures and Facilities -- Troop Housing Facilities, Maintenance, Repair or Alteration of Real Property -- Dining Facilities, Maintenance, Repair or Alteration of Real Property -- Other Hospital Buildings, Maintenance, Repair or Alteration of Real Property -- Miscellaneous Buildings by Army Signed by year:2000: $179,626; 2001: $231,320; 2002: $358,701; 2003: $0; 2004: $0; 2005: $0; 2006: $0.
Biggest contracts:
$303,584 with Army for Construction of Structures and Facilities -- Troop Housing Facilities. Signed on 2002-03-11. Completion date: 2001-07-21.
$195,428, same as above.Signed on 2001-04-10. Completion date: 1999-06-27.
$75,527 with Army for Maintenance, Repair or Alteration of Real Property -- Dining Facilities. Signed on 2000-03-02. Completion date: 1997-10-23.
$59,534 with Army for Construction of Structures and Facilities -- Troop Housing Facilities. Signed on 1999-10-22. Completion date: 2000-10-13.
SEDONA CONTRACTING INC (6800 PARK TEN BLVD; small business) : $405,818 in 35 contractsfrom 2000 to 2002
Contracts for Maintenance, Repair or Alteration of Real Property -- Family Housing Facilities, Construction of Structures and Facilities -- Other Industrial Buildings, Maintenance, Repair or Alteration of Real Property -- Miscellaneous Buildings, Construction of Structures and Facilities -- Miscellaneous Buildings, and moreby Air Force, Army, U.S. Army Corps of Engineers - civil program financing only Signed by year:2000: $319,044; 2001: $86,083; 2002: $691; 2003: $0; 2004: $0; 2005: $0; 2006: $0.
Biggest contracts:
$131,000 with Air Force for Maintenance, Repair or Alteration of Real Property -- Family Housing Facilities. Signed on 2000-05-15. Completion date: 2000-07-31.
$64,338 with Army for Construction of Structures and Facilities -- Other Industrial Buildings. Signed on 2001-12-11. Completion date: 2001-09-29.
$43,644 with U.S. Army Corps of Engineers - civil program financing only for Maintenance, Repair or Alteration of Real Property -- Miscellaneous Buildings. Signed on 2000-04-05. Completion date: 2000-01-30.
$25,000 with Army for Construction of Structures and Facilities -- Other Industrial Buildings. Signed on 2000-07-21. Completion date: 2001-07-24.
LITIGATION SERVICES OF SOUTH T (315 SULLIVAN DR; small business) : $88,703 in 78 contractsfrom 2002 to 2006
Contracts for Court Reporting Services, Other Professional Services, Miscellaneous Printed Matter, Other Administrative Support Services, and moreby Army, Air Force, Department of Veterans Affairs, Defense Finance and Accounting Service, and others Signed by year:2000: $0; 2001: $0; 2002: $3,778; 2003: $17,232; 2004: $39,004; 2005: $18,045; 2006: $10,644.
Biggest contracts:
$20,000 with Army for Court Reporting Services. Signed on 2005-10-25. Completion date: 2006-10-24.
$20,000, same as above.Signed on 2004-10-28. Completion date: 2005-09-30.
$10,000, same as above.Signed on 2003-10-31. Completion date: 2004-09-30.
$3,778, same as above.Signed on 2002-07-26. Completion date: 2002-07-19.
Top industries in this zip code by the number of employees in 2005:
Administrative and Support and Waste Management and Remediation Services: Temporary Help Services (100-249 employees: 3 establishments, 50-99 employees: 3 establishments, 5-9 employees: 1 establishment, 1-4 employees: 1 establishment)
Other Services (except Public Administration): Religious Organizations (100-249: 1, 50-99: 3, 20-49: 3, 10-19: 2, 5-9: 7, 1-4: 8)
Administrative and Support and Waste Management and Remediation Services: Office Administrative Services (250-499: 1, 20-49: 1, 5-9: 1, 1-4: 3)
2002 - 2018 National Fire Incident Reporting System (NFIRS) incidents
Based on the data from the years 2002 - 2018 the average number of fires per year is 93. The highest number of fire incidents - 153 took place in 2003, and the least - 13 in 2008. The data has a dropping trend.
When looking into fire subcategories, the most reports belonged to: Outside Fires (40.5%), and Structure Fires (26.6%).
Fire incident types reported to NFIRS in Zip Code 78213

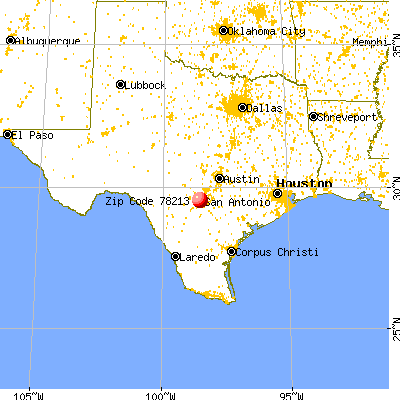


 Nearest zip codes: 78216, 78230, 78201, 78229, 78212, 78231.
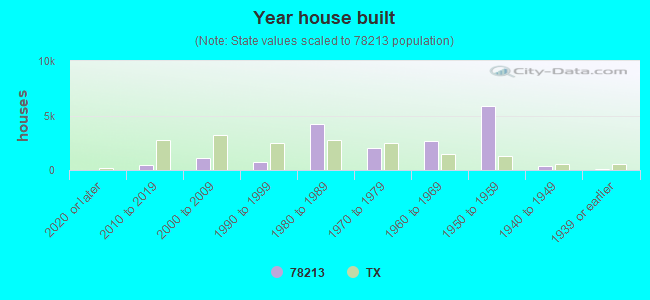


 Based on the data from the years 2002 - 2018 the average number of fires per year is 93. The highest number of fire incidents - 153 took place in 2003, and the least - 13 in 2008. The data has a dropping trend.
 When looking into fire subcategories, the most reports belonged to: Outside Fires (40.5%), and Structure Fires (26.6%).