Estimated zip code population in 2022: 10,240 Zip code population in 2010: 7,906 Zip code population in 2000: 7,615
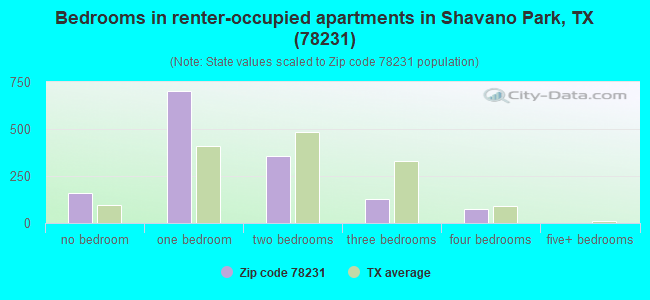
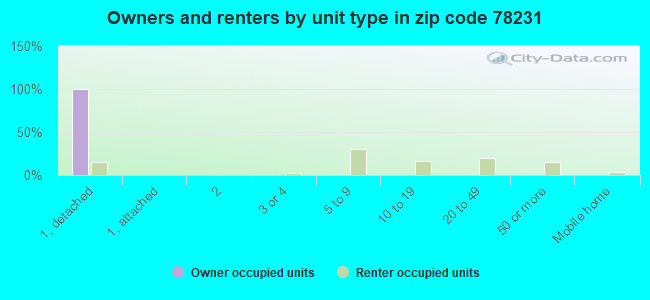
Houses and condos: 4,295 Renter-occupied apartments: 1,401
% of renters here:
33%
State:
38%
March 2022 cost of living index in zip code 78231: 88.3 (less than average, U.S. average is 100)
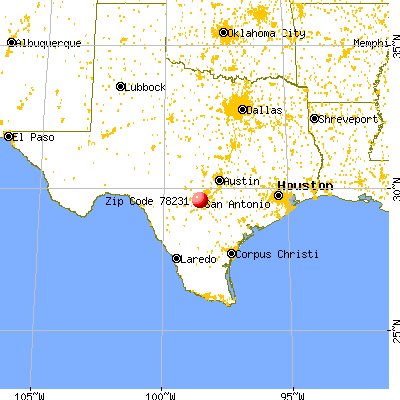
Land area: 3.9 sq. mi. Water area: 0.0 sq. mi.
Population density: 2,650 people per square mile
(average).
OSM Map
General Map
Google Map
MSN Map
OSM Map
General Map
Google Map
MSN Map
OSM Map
General Map
Google Map
MSN Map
OSM Map
General Map
Google Map
MSN Map
Please wait while loading the map...
Real estate property taxes paid for housing units in 2022:
This zip code:
1.8% ($7,664)
Texas:
1.5% ($4,050)
Median real estate property taxes paid for housing units with mortgages in 2022: $7,741 (1.8%) Median real estate property taxes paid for housing units with no mortgage in 2022: $7,713 (1.8%)
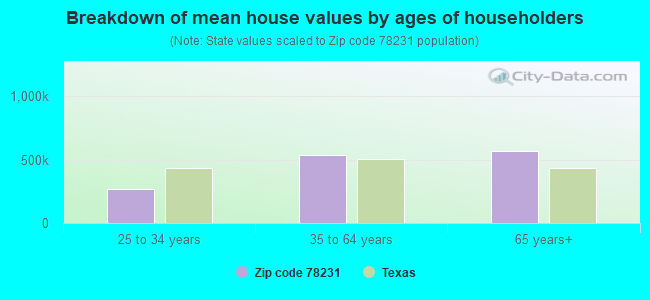
Estimated median house/condo value in 2022: $424,440
78231:
$424,440
Texas:
$275,400
According to our research of Texas and other state lists, there were 3 registered sex offenders living in 78231 zip code as of April 27, 2024. The ratio of all residents to sex offenders in zip code 78231 is 2,792 to 1. The ratio of registered sex offenders to all residents in this zip code is much lower than the state average.
Median resident age:
This zip code:
39.1 years
Texas median age:
35.6 years
Average household size:
This zip code:
2.4 people
Texas:
2.6 people
Averages for the 2020 tax year for zip code 78231, filed in 2021:
Average Adjusted Gross Income (AGI) in 2020: $185,524 (Individual Income Tax Returns)
Here:
$185,524
State:
$77,054
Salary/wage: $103,276 (reported on 76.5% of returns)
Here:
$103,276
State:
$62,766
(% of AGI for various income ranges: 1176.5% for AGIs below $25k, 3606.8% for AGIs $25k-50k, 5788.1% for AGIs $50k-75k, 8697.9% for AGIs $75k-100k, 17639.4% for AGIs $100k-200k, 102295.8% for AGIs over 200k)
Taxable interest for individuals: $4,731 (reported on 46.9% of returns)
This zip code:
$4,731
Texas:
$2,665
(% of AGI for various income ranges: 39.7% for AGIs below $25k, 52.7% for AGIs $25k-50k, 82.2% for AGIs $50k-75k, 227.5% for AGIs $75k-100k, 358.5% for AGIs $100k-200k, 3525.8% for AGIs over 200k)
Ordinary dividends: $42,744 (reported on 35.2% of returns)
Here:
$42,744
State:
$10,044
(% of AGI for various income ranges: 50.5% for AGIs below $25k, 101.4% for AGIs $25k-50k, 182.2% for AGIs $50k-75k, 423.8% for AGIs $75k-100k, 769.4% for AGIs $100k-200k, 31962.6% for AGIs over 200k)
Net capital gain/loss in AGI: +$74,897 (reported on 32.5% of returns)
Here:
+$74,897
State:
+$39,590
(% of AGI for various income ranges: 34.2% for AGIs below $25k, 55.1% for AGIs $25k-50k, 165.8% for AGIs $50k-75k, 251.7% for AGIs $75k-100k, 915.4% for AGIs $100k-200k, 53897.9% for AGIs over 200k)
Profit/loss from business: +$23,291 (reported on 20.4% of returns)
Here:
+$23,291
State:
+$10,888
(% of AGI for various income ranges: 120.5% for AGIs below $25k, 128.7% for AGIs $25k-50k, 256.1% for AGIs $50k-75k, 387.9% for AGIs $75k-100k, 1086.0% for AGIs $100k-200k, 6540.0% for AGIs over 200k)
Taxable individual retirement arrangement distribution: $28,067 (reported on 14.1% of returns)
78231:
$28,067
Texas:
$24,740
(% of AGI for various income ranges: 61.2% for AGIs below $25k, 127.3% for AGIs $25k-50k, 456.7% for AGIs $50k-75k, 560.0% for AGIs $75k-100k, 1120.0% for AGIs $100k-200k, 4243.7% for AGIs over 200k)
Self-employed (Keogh) retirement plans: $28,500 (reported on 1.6% of returns)
78231:
$28,500
Texas:
$29,298
(% of AGI for various income ranges: 79.0% for AGIs $100k-200k, 850.5% for AGIs over 200k)
Total itemized deductions: $64,342 (reported on 14.6% of returns)
Here:
$64,342
State:
$40,428
(% of AGI for various income ranges: 120.9% for AGIs below $25k, 243.7% for AGIs $25k-50k, 411.1% for AGIs $50k-75k, 638.3% for AGIs $75k-100k, 1155.2% for AGIs $100k-200k, 16228.9% for AGIs over 200k)
Charity contributions: $43,651 (reported on 12.3% of returns)
Here:
$43,651
State:
$18,201
(% of AGI for various income ranges: 5.8% for AGIs below $25k, 31.7% for AGIs $25k-50k, 74.2% for AGIs $50k-75k, 133.3% for AGIs $75k-100k, 351.5% for AGIs $100k-200k, 11311.1% for AGIs over 200k)
Taxes paid: $8,432 (reported on 14.6% of returns)
78231:
$8,432
State:
$7,821
(% of AGI for various income ranges: 20.5% for AGIs below $25k, 42.1% for AGIs $25k-50k, 105.8% for AGIs $50k-75k, 181.7% for AGIs $75k-100k, 292.7% for AGIs $100k-200k, 1495.8% for AGIs over 200k)
Earned income credit: $1,895 (reported on 8.7% of returns)
Here:
$1,895
State:
$2,584
(% of AGI for various income ranges: 63.8% for AGIs below $25k, 42.4% for AGIs $25k-50k)
Percentage of individuals using paid preparers for their 2020 taxes: 89.7%
Here:
90%
State:
92%
(% for various income ranges: 87.9% for AGIs below $25k, 91.6% for AGIs $25k-50k, 92.6% for AGIs $50k-75k, 87.5% for AGIs $75k-100k, 88.5% for AGIs $100k-200k, 90.9% for AGIs over 200k)
Averages for the 2012 tax year for zip code 78231, filed in 2013:
Average Adjusted Gross Income (AGI) in 2012: $131,892 (Individual Income Tax Returns)
Here:
$131,892
State:
$65,384
Salary/wage: $78,954 (reported on 79.5% of returns)
Here:
$78,954
State:
$52,524
(% of AGI for various income ranges: 74.9% for AGIs below $25k, 74.0% for AGIs $25k-50k, 60.7% for AGIs $50k-75k, 65.5% for AGIs $75k-100k, 68.5% for AGIs $100k-200k, 34.1% for AGIs over 200k)
Taxable interest for individuals: $5,170 (reported on 47.9% of returns)
This zip code:
$5,170
Texas:
$2,372
(% of AGI for various income ranges: 2.2% for AGIs below $25k, 1.4% for AGIs $25k-50k, 1.3% for AGIs $50k-75k, 1.4% for AGIs $75k-100k, 1.1% for AGIs $100k-200k, 2.3% for AGIs over 200k)
Ordinary dividends: $39,036 (reported on 32.5% of returns)
Here:
$39,036
State:
$9,721
(% of AGI for various income ranges: 3.0% for AGIs below $25k, 2.1% for AGIs $25k-50k, 2.2% for AGIs $50k-75k, 2.4% for AGIs $75k-100k, 1.8% for AGIs $100k-200k, 14.6% for AGIs over 200k)
Net capital gain/loss in AGI: +$24,713 (reported on 28.3% of returns)
Here:
+$24,713
State:
+$35,319
(% of AGI for various income ranges: 0.1% for AGIs below $25k, 0.6% for AGIs $25k-50k, 0.4% for AGIs $50k-75k, 0.7% for AGIs $75k-100k, 1.4% for AGIs $100k-200k, 8.2% for AGIs over 200k)
Profit/loss from business: +$25,090 (reported on 20.8% of returns)
Here:
+$25,090
State:
+$13,732
(% of AGI for various income ranges: 7.4% for AGIs below $25k, 4.4% for AGIs $25k-50k, 5.5% for AGIs $50k-75k, 3.4% for AGIs $75k-100k, 5.7% for AGIs $100k-200k, 3.1% for AGIs over 200k)
Taxable individual retirement arrangement distribution: $27,243 (reported on 14.2% of returns)
78231:
$27,243
Texas:
$19,511
(% of AGI for various income ranges: 2.8% for AGIs below $25k, 3.0% for AGIs $25k-50k, 4.3% for AGIs $50k-75k, 3.3% for AGIs $75k-100k, 3.7% for AGIs $100k-200k, 2.5% for AGIs over 200k)
Self-employment retirement plans: $26,538 (reported on 1.9% of returns)
78231:
$26,538
Texas:
$23,938
(% of AGI for various income ranges: 0.4% for AGIs $100k-200k, 0.5% for AGIs over 200k)
Total itemized deductions: $44,180 (18% of AGI, reported on 42.7% of returns)
Here:
$44,180
State:
$24,724
Here:
17.8% of AGI
State:
15.9% of AGI
(% of AGI for various income ranges: 12.5% for AGIs below $25k, 14.6% for AGIs $25k-50k, 13.8% for AGIs $50k-75k, 13.9% for AGIs $75k-100k, 12.3% for AGIs $100k-200k, 15.1% for AGIs over 200k)
Charity contributions: $18,352 (reported on 37.0% of returns)
Here:
$18,352
State:
$6,808
(% of AGI for various income ranges: 1.2% for AGIs below $25k, 1.8% for AGIs $25k-50k, 2.1% for AGIs $50k-75k, 2.3% for AGIs $75k-100k, 2.5% for AGIs $100k-200k, 7.1% for AGIs over 200k)
Taxes paid: $9,428 (reported on 42.0% of returns)
78231:
$9,428
State:
$6,921
(% of AGI for various income ranges: 3.2% for AGIs below $25k, 3.9% for AGIs $25k-50k, 4.2% for AGIs $50k-75k, 4.6% for AGIs $75k-100k, 4.5% for AGIs $100k-200k, 2.1% for AGIs over 200k)
Earned income credit: $1,898 (reported on 9.4% of returns)
Here:
$1,898
State:
$2,570
(% of AGI for various income ranges: 3.9% for AGIs below $25k, 0.7% for AGIs $25k-50k)
Percentage of individuals using paid preparers for their 2012 taxes: 46.7%
Here:
47%
State:
51%
(% for various income ranges: 38.2% for AGIs below $25k, 42.0% for AGIs $25k-50k, 49.1% for AGIs $50k-75k, 42.5% for AGIs $75k-100k, 49.4% for AGIs $100k-200k, 75.0% for AGIs over 200k)
Averages for the 2004 tax year for zip code 78231, filed in 2005:
Average Adjusted Gross Income (AGI) in 2004: $88,906 (Individual Income Tax Returns)
Here:
$88,906
State:
$47,881
Salary/wage: $69,498 (reported on 80.5% of returns)
Here:
$69,498
State:
$41,947
(% of AGI for various income ranges: 104.7% for AGIs below $10k, 75.5% for AGIs $10k-25k, 70.7% for AGIs $25k-50k, 66.4% for AGIs $50k-75k, 74.6% for AGIs $75k-100k, 58.8% for AGIs over 100k)
Taxable interest for individuals: $2,736 (reported on 57.1% of returns)
This zip code:
$2,736
Texas:
$2,255
(% of AGI for various income ranges: 5.8% for AGIs below $10k, 2.2% for AGIs $10k-25k, 2.5% for AGIs $25k-50k, 2.1% for AGIs $50k-75k, 1.6% for AGIs $75k-100k, 1.6% for AGIs over 100k)
Taxable dividends: $3,806 (reported on 38.3% of returns)
Here:
$3,806
State:
$4,261
(% of AGI for various income ranges: 7.8% for AGIs below $10k, 2.4% for AGIs $10k-25k, 2.6% for AGIs $25k-50k, 1.9% for AGIs $50k-75k, 1.7% for AGIs $75k-100k, 1.4% for AGIs over 100k)
Net capital gain/loss: +$12,451 (reported on 34.3% of returns)
Here:
+$12,451
State:
+$16,110
(% of AGI for various income ranges: -4.2% for AGIs below $10k, 0.4% for AGIs $10k-25k, 1.2% for AGIs $25k-50k, 1.3% for AGIs $50k-75k, 1.1% for AGIs $75k-100k, 6.5% for AGIs over 100k)
Profit/loss from business: +$20,307 (reported on 20.7% of returns)
Here:
+$20,307
State:
+$11,013
(% of AGI for various income ranges: 4.3% for AGIs below $10k, 7.2% for AGIs $10k-25k, 4.4% for AGIs $25k-50k, 4.7% for AGIs $50k-75k, 4.1% for AGIs $75k-100k, 4.7% for AGIs over 100k)
IRA payment deduction: $3,853 (reported on 3.7% of returns)
78231:
$3,853
Texas:
$3,120
(% of AGI for various income ranges: 0.4% for AGIs $10k-25k, 0.3% for AGIs $25k-50k, 0.2% for AGIs $50k-75k, 0.3% for AGIs $75k-100k, 0.1% for AGIs over 100k)
Self-employed pension: $14,321 (reported on 2.1% of returns)
Here:
$14,321
Texas:
$16,401
(% of AGI for various income ranges: 0.5% for AGIs $10k-25k, 0.2% for AGIs $75k-100k, 0.4% for AGIs over 100k)
Total itemized deductions: $21,367 (16% of AGI, reported on 45.0% of returns)
Here:
$21,367
State:
$19,631
Here:
15.8% of AGI
State:
18.9% of AGI
(% of AGI for various income ranges: 21.8% for AGIs below $10k, 12.7% for AGIs $10k-25k, 15.7% for AGIs $25k-50k, 16.0% for AGIs $50k-75k, 15.7% for AGIs $75k-100k, 8.6% for AGIs over 100k)
Charity contributions deductions: $6,242 (4% of AGI, reported on 40.7% of returns)
Here:
$6,242
State:
$4,753
Here:
4.4% of AGI
State:
4.2% of AGI
(% of AGI for various income ranges: 0.7% for AGIs below $10k, 1.3% for AGIs $10k-25k, 2.3% for AGIs $25k-50k, 2.5% for AGIs $50k-75k, 2.7% for AGIs $75k-100k, 3.1% for AGIs over 100k)
Total tax: $21,238 (reported on 79.9% of returns)
78231:
$21,238
State:
$9,058
(% of AGI for various income ranges: 2.9% for AGIs below $10k, 4.5% for AGIs $10k-25k, 7.7% for AGIs $25k-50k, 9.9% for AGIs $50k-75k, 11.3% for AGIs $75k-100k, 23.6% for AGIs over 100k)
Earned income credit: $1,651 (reported on 8.9% of returns)
Here:
$1,651
State:
$2,024
Percentage of individuals using paid preparers for their 2004 taxes: 50.2%
Here:
50%
State:
57%
(% for various income ranges: 44.2% for AGIs below $10k, 50.1% for AGIs $10k-25k, 47.6% for AGIs $25k-50k, 50.8% for AGIs $50k-75k, 42.1% for AGIs $75k-100k, 61.1% for AGIs over 100k)
Likely homosexual households (counted as self-reported same-sex unmarried-partner households)
Lesbian couples: 0.0% of all households
Gay men: 0.4% of all households
Household received Food Stamps/SNAP in the past 12 months: 104 Household did not receive Food Stamps/SNAP in the past 12 months: 4,124
Women who had a birth in the past 12 months: 48 (49 now married, 0 unmarried) Women who did not have a birth in the past 12 months: 2,161 (1,303 now married, 847 unmarried)
Housing units in zip code 78231 with a mortgage: 1,739 (112 second mortgage, 116 both second mortgage and home equity loan) Houses without a mortgage: 20
Median monthly owner costs for units with a mortgage: $2,326 Median monthly owner costs for units without a mortgage: $1,017
Residents with income below the poverty level in 2022:
This zip code:
4.4%
Whole state:
14.0%
Residents with income below 50% of the poverty level in 2022:
This zip code:
2.1%
Whole state:
7.4%
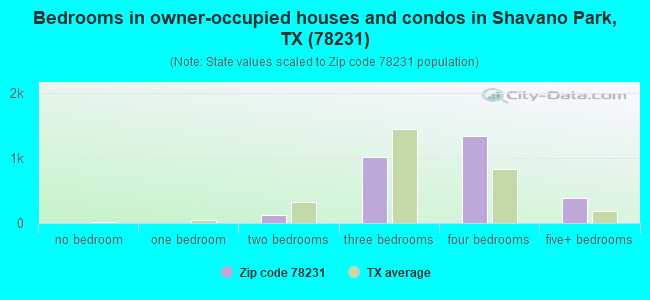
Median number of rooms in houses and condos:
Here:
7.6
State:
6.3
Median number of rooms in apartments:
Here:
2.9
State:
4.0
Notable locations in this zip code not listed on our city pages
Notable locations in zip code 78231: Bexar Metro 911 Network District Office (A), Shavano Park Fire Department and Emergency Medical Services (B). Display/hide their locations on the map
Churches in zip code 78231 include: Oak Meadow United Methodist Church (A), Churchill Baptist Church (B), Northwest Assembly of God (C). Display/hide their locations on the map
In group quarters: 13 (-1 institutionalized population)
Size of family households: 1,269 2-persons, 504 3-persons, 812 4-persons, 137 5-persons, 81 6-persons
Size of nonfamily households: 1,193 1-person, 247 2-persons, 5 4-persons
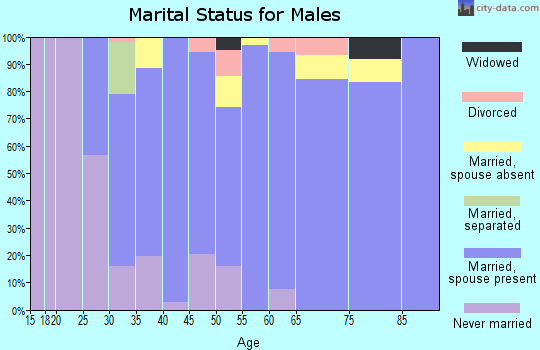
1,542 married couples with children.
360 single-parent households (19 men, 341 women).
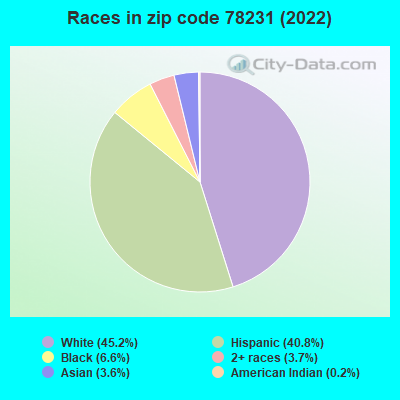
74.6% of residents of 78231 zip code speak English at home.
21.1% of residents speak Spanish at home (76% very well, 22% well, 2% not well).
2.6% of residents speak other Indo-European language at home (86% very well, 14% well).
0.5% of residents speak Asian or Pacific Island language at home (59% very well, 28% well, 13% not well).
1.7% of residents speak other language at home (100% very well).
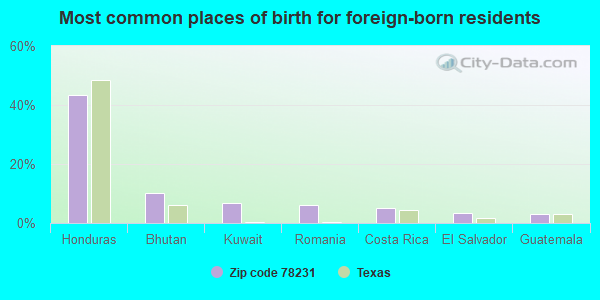
Foreign born population: 1,197 (11.7%) (75.9% of them are naturalized citizens)
This zip code:
11.7%
Whole state:
17.2%
43%Honduras
10%Bhutan
7%Kuwait
6%Romania
5%Costa Rica
3%El Salvador
3%Guatemala
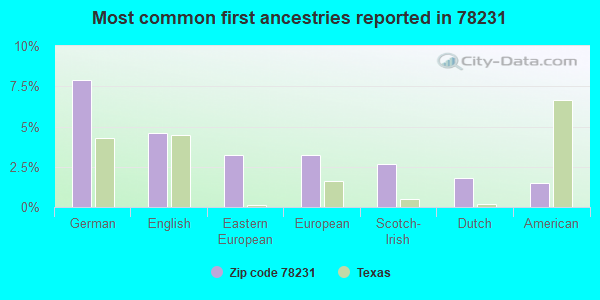
8%German
5%English
3%Eastern European
3%European
3%Scotch-Irish
2%Dutch
1%American
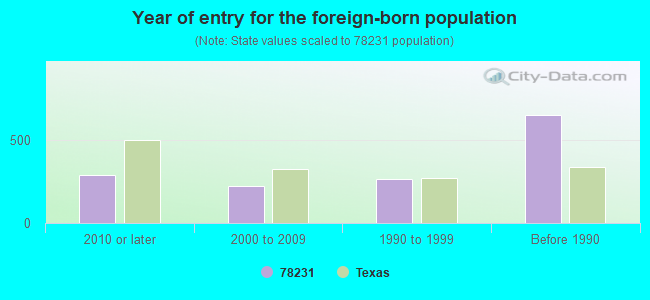
Year of entry for the foreign-born population
2922010 or later
2242000 to 2009
2691990 to 1999
653Before 1990
Housing units lacking complete kitchen facilities: 0.8%
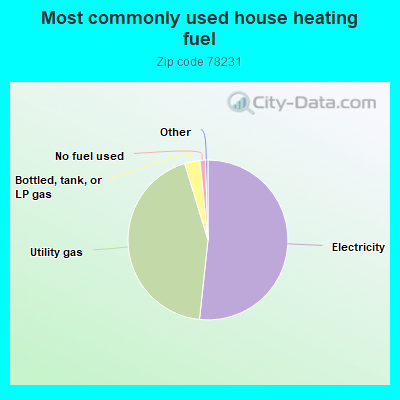
51.7%Electricity
43.6%Utility gas
3.1%Bottled, tank, or LP gas
1.1%No fuel used
Population in 1990: 7,504. Population change in the 1990s: +111 (+1.5%).
Place of birth for U.S.-born residents:
This state: 5,821
Northeast: 460
Midwest: 850
South: 929
West: 686
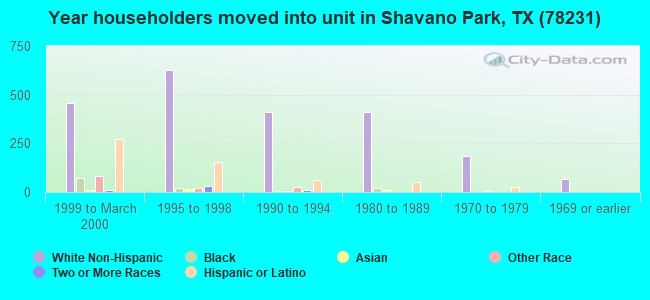
53% of the 78231 zip code residents lived in the same house 5 years ago. Out of people who lived in different houses, 58% lived in this county. Out of people who lived in different counties, 50% lived in Texas.
85% of the 78231 zip code residents lived in the same house 1 year ago. Out of people who lived in different houses, 50% moved from this county. Out of people who lived in different houses, 27% moved from different county within same state. Out of people who lived in different houses, 22% moved from different state.
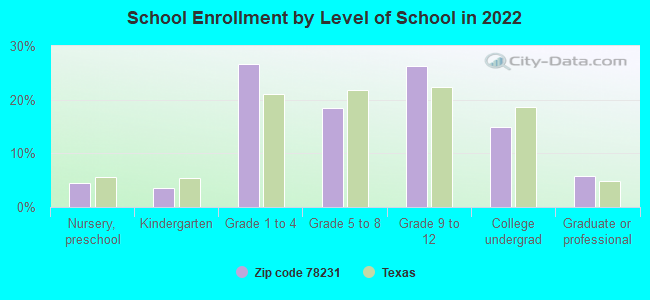
Private vs. public school enrollment:
Students in private schools in grades 1 to 8 (elementary and middle school): 176
Here:
16.2%
Texas:
8.8%
Students in private schools in grades 9 to 12 (high school): 56
Here:
8.9%
Texas:
8.0%
Students in private undergraduate colleges: 94
Here:
26.4%
Texas:
16.2%
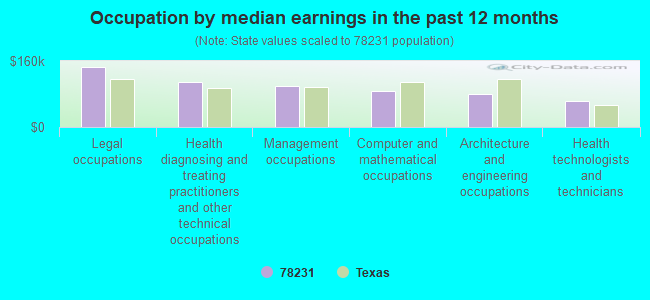
Occupation by median earnings in the past 12 months ($)
146,665Legal occupations
109,112Health diagnosing and treating practitioners and other technical occupations
100,276Management occupations
88,152Computer and mathematical occupations
80,208Architecture and engineering occupations
63,997Health technologists and technicians
Companies with federal contracts located in this zip code (SAN ANTONIO, TX):
THE CME GROUP INC (1618 NEW BOND ST; small business)
$850,000 with Air Force for Other Research and Development -- Applied Research and Exploratory Development (R&D). Signed on 2005-06-22. Completion date: 2007-06-29.
BEXAR BREATH TESTING (13710 FOREST ROCK DR; small business) : $27,500 in 11 contractsfrom 2002 to 2005
Contracts for Maintenance, Repair and Rebuilding of Equipment -- Office Machines, Text Processing Systems and Visible Record Equipment, Maintenance, Repair and Rebuilding of Equipment -- Instruments and Laboratory Equipment, Maintenance, Repair and Rebuilding of Equipment -- Medical, Dental, and Veterinary Equipment and Supplies, Other Education and Training Services, and moreby Air Force, Army Signed by year:2000: $0; 2001: $0; 2002: $4,800; 2003: $0; 2004: $14,000; 2005: $8,700; 2006: $0.
Biggest contracts:
$5,100 with Air Force for Maintenance, Repair and Rebuilding of Equipment -- Office Machines, Text Processing Systems and Visible Record Equipment. Signed on 2005-10-01. Completion date: 2006-09-30.
$4,800 with Air Force for Maintenance, Repair and Rebuilding of Equipment -- Instruments and Laboratory Equipment. Signed on 2005-10-01. Completion date: 2006-09-30.
$4,800 with Air Force for Maintenance, Repair and Rebuilding of Equipment -- Medical, Dental, and Veterinary Equipment and Supplies. Signed on 2004-10-01. Completion date: 2005-09-30.
$4,800 with Air Force for Maintenance, Repair and Rebuilding of Equipment -- Office Machines, Text Processing Systems and Visible Record Equipment. Signed on 2004-10-01. Completion date: 2004-09-30.
BEXAR METRO 9-1-1 NETWORK (911 SADDLETREE COURT) : $26,699 in 8 contractsfrom 2004 to 2005
Contracts for Miscellaneous Communication Equipment, Maintenance, Repair and Rebuilding of Equipment -- Communication, Detection, and Coherent Radiation Equipment, Other ADP and Telecommunications Services (includes data storage on tapes, compact disks, etc.), Communications Security Equipment and Components by Air Force Signed by year:2000: $0; 2001: $0; 2002: $0; 2003: $0; 2004: $14,268; 2005: $12,431; 2006: $0.
Biggest contracts:
$19,633 with Air Force for Miscellaneous Communication Equipment. Signed on 2004-10-01. Completion date: 2005-09-30.
$16,792 with Air Force for Maintenance, Repair and Rebuilding of Equipment -- Communication, Detection, and Coherent Radiation Equipment. Signed on 2005-10-01. Completion date: 2006-10-01.
$0 with Air Force for Other ADP and Telecommunications Services (includes data storage on tapes, compact disks, etc.). Signed on 2005-11-03. Completion date: 2002-09-30.
$0, same as above.Signed on 2005-11-23. Completion date: 2005-11-28.
RELIANT SURGICAL LP (124 ELM SPRINGS LN; small business)
$9,600 with Army for Ophthalmic Instruments, Equipment, and Supplies. Signed on 2004-05-07. Completion date: 2004-04-21.
Top industries in this zip code by the number of employees in 2005:
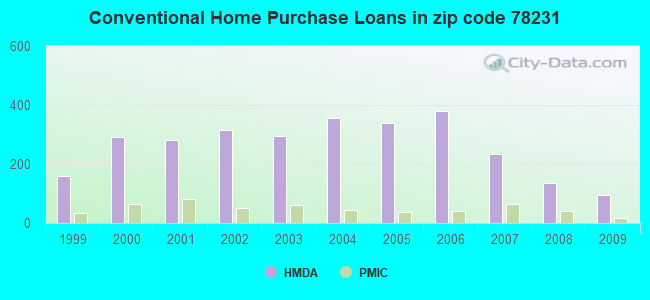
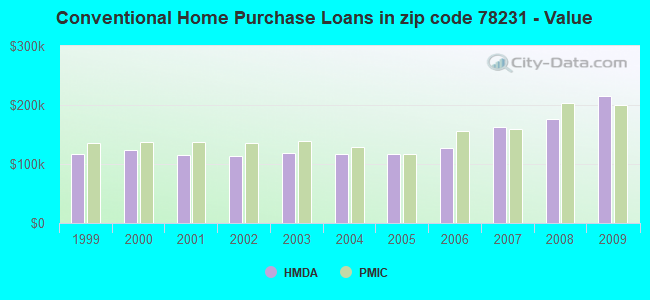
Detailed PMIC statistics for the following Tracts:1914.05
, 1915.02
2002 - 2018 National Fire Incident Reporting System (NFIRS) incidents
Based on the data from the years 2002 - 2018 the average number of fires per year is 16. The highest number of fire incidents - 26 took place in 2007, and the least - 1 in 2008. The data has a growing trend.
When looking into fire subcategories, the most reports belonged to: Outside Fires (49.8%), and Structure Fires (20.8%).
Fire incident types reported to NFIRS in Zip Code 78231


 Nearest zip codes: 78248, 78230, 78213, 78216, 78232, 78258.


 Based on the data from the years 2002 - 2018 the average number of fires per year is 16. The highest number of fire incidents - 26 took place in 2007, and the least - 1 in 2008. The data has a growing trend.
 When looking into fire subcategories, the most reports belonged to: Outside Fires (49.8%), and Structure Fires (20.8%).